| Param | Original file | Final file |
|---|---|---|
| Filename | modeM0/AS1A10_110T04_9000004094_28495cztM0_level2.evt | modeM0/AS1A10_110T04_9000004094_28495cztM0_level2_quad_clean.evt |
| Size (bytes) | 1,214,251,200 | 157,573,440 |
| Size | 1.1 GB | 150.3 MB |
| Events in quadrant A | 5,914,175 | 1,032,492 |
| Events in quadrant B | 10,206,162 | 1,017,450 |
| Events in quadrant C | 6,041,477 | 1,017,021 |
| Events in quadrant D | 13,773,511 | 845,579 |
| Mode M0 | |||
|---|---|---|---|
| Quadrant | BADHDUFLAG | Total packets | Discarded packets |
| A | 0 | 25829 | 2 |
| B | 0 | 38542 | 2 |
| C | 0 | 25998 | 2 |
| D | 0 | 49434 | 2 |
| Mode SS | |||
|---|---|---|---|
| Quadrant | BADHDUFLAG | Total packets | Discarded packets |
| A | 0 | 254 | 0 |
| B | 0 | 254 | 0 |
| C | 0 | 254 | 0 |
| D | 0 | 254 | 0 |
| Mode M9 | |||
|---|---|---|---|
| Quadrant | BADHDUFLAG | Total packets | Discarded packets |
| A | 0 | 4 | 0 |
| B | 0 | 4 | 0 |
| C | 0 | 4 | 0 |
| D | 0 | 4 | 0 |
| Quadrant | Total seconds | Saturated seconds | Saturation percentage |
|---|---|---|---|
| A | 12410 | 173 | 1.394037% |
| B | 12411 | 1601 | 12.899847% |
| C | 12411 | 275 | 2.215776% |
| D | 12411 | 3030 | 24.413826% |
Noise dominated data is calculated using 1-second bins in cleaned event files. If a bin has >2000 counts, and if more than 50% of those come from <1% of pixels, then it is considered to be noise-dominated and hence unusable.
| Quadrant | # 1 sec bins | Bins with >0 counts | Bins with >2000 counts | High rate bins dominated by noise | Noise dominated (total time) | Noise dominated (detector-on time) | Marked lightcurve |
|---|---|---|---|---|---|---|---|
| A | 12885 | 12411 | 0 | 0 | 0.00% | 0.00% | 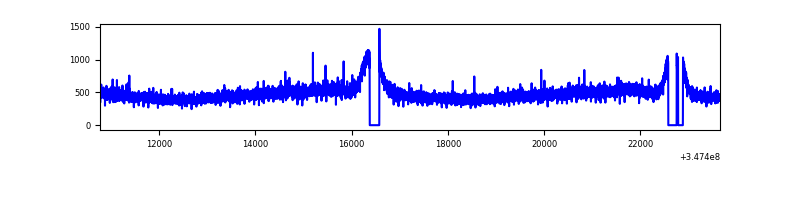 |
| B | 12886 | 12412 | 1125 | 1125 | 8.73% | 9.06% | 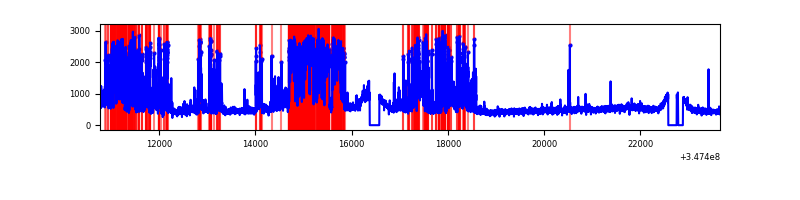 |
| C | 12886 | 12411 | 0 | 0 | 0.00% | 0.00% | 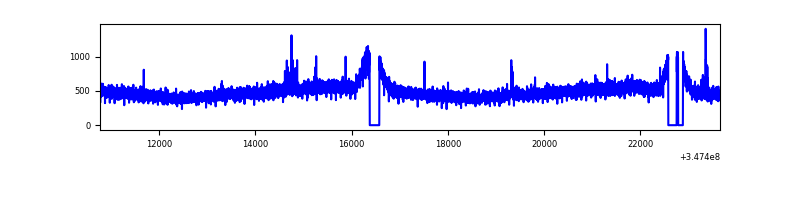 |
| D | 12886 | 12411 | 2472 | 2472 | 19.18% | 19.92% | 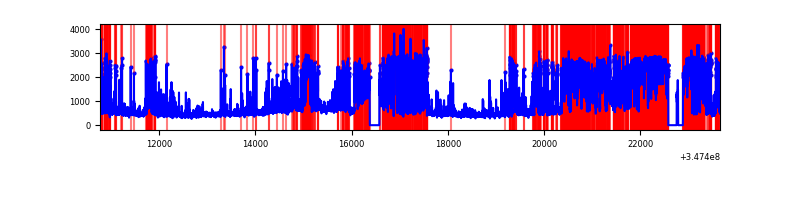 |
Top three noisy pixels from each quadrant. If the there are fewer than three noisy pixels in the level2.evt file, extra rows are filled as -1
| Pixel properties | Quadrant properties | ||||||
|---|---|---|---|---|---|---|---|
| Quadrant | DetID | PixID | Counts | Sigma | Mean | Median | Sigma |
| A | 13 | 254 | 19306 | 57.61 | 1529 | 1498 | 309.1 |
| A | 3 | 137 | 15421 | 45.04 | 1529 | 1498 | 309.1 |
| A | 0 | 226 | 12883 | 36.83 | 1529 | 1498 | 309.1 |
| B | 10 | 245 | 4513624 | 16236.88 | 1442 | 1408 | 277.9 |
| B | 12 | 111 | 35227 | 121.7 | 1442 | 1408 | 277.9 |
| B | 11 | 111 | 31807 | 109.39 | 1442 | 1408 | 277.9 |
| C | 14 | 238 | 235717 | 676.31 | 1470 | 1480 | 346.3 |
| C | 7 | 247 | 26667 | 72.72 | 1470 | 1480 | 346.3 |
| C | 3 | 233 | 15176 | 39.54 | 1470 | 1480 | 346.3 |
| D | 1 | 52 | 7290202 | 23361.21 | 1293 | 1255 | 312.0 |
| D | 8 | 195 | 660218 | 2111.99 | 1293 | 1255 | 312.0 |
| D | 12 | 233 | 433682 | 1385.94 | 1293 | 1255 | 312.0 |
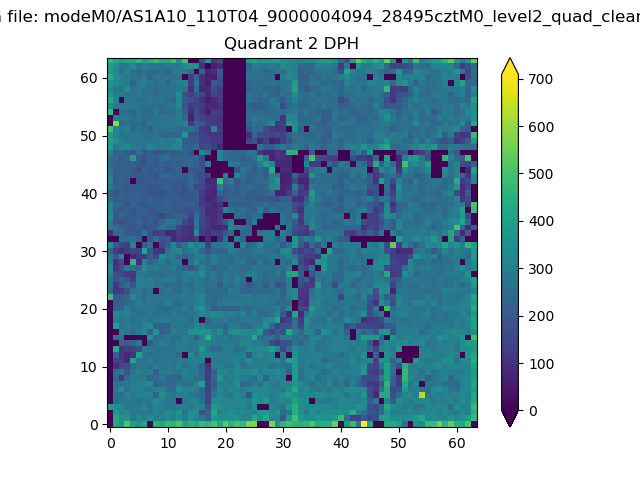
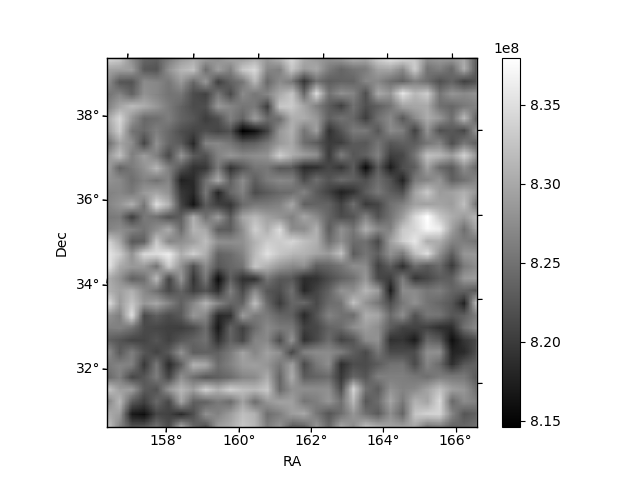
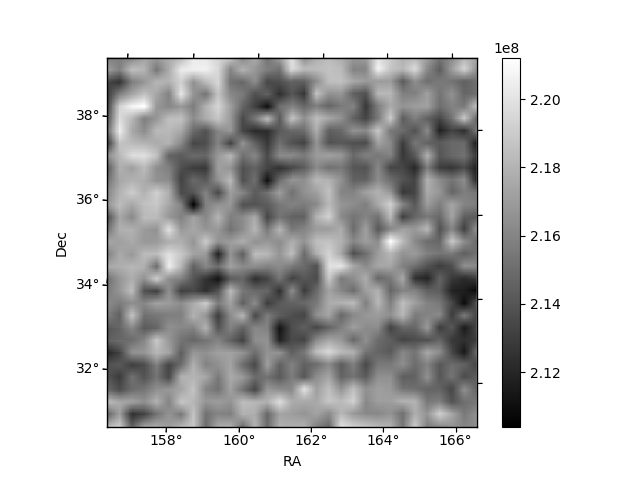
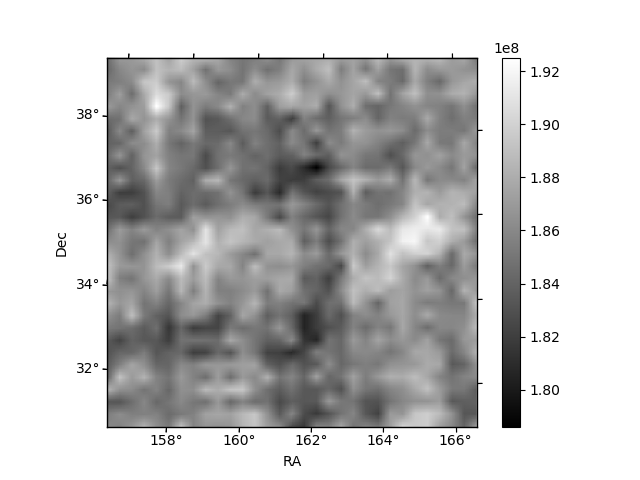
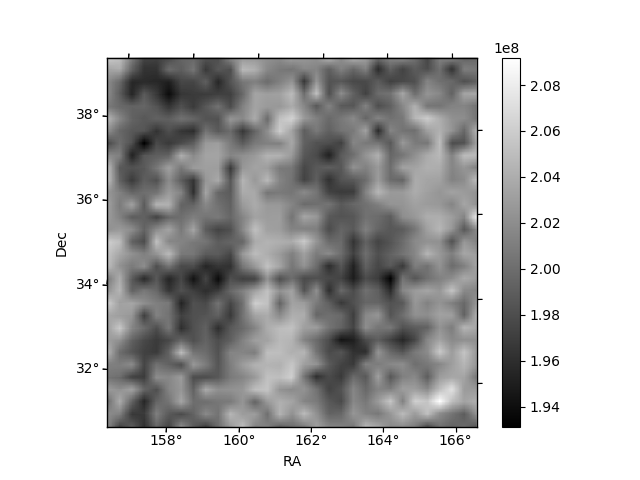
Histogram calculated using DETX and DETY for each event in the final _common_clean file
| Quadrant A | 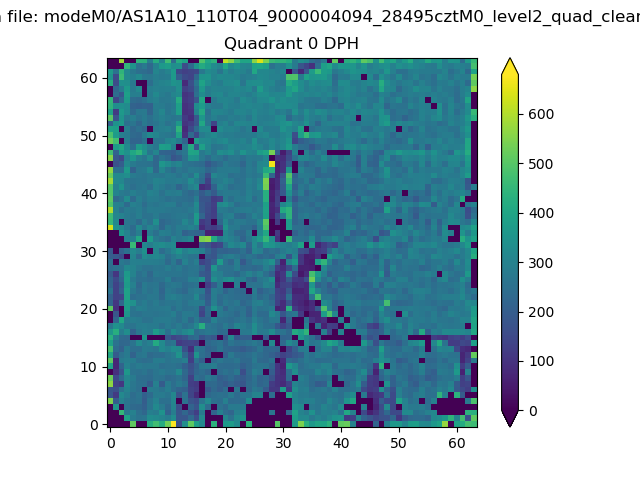 |
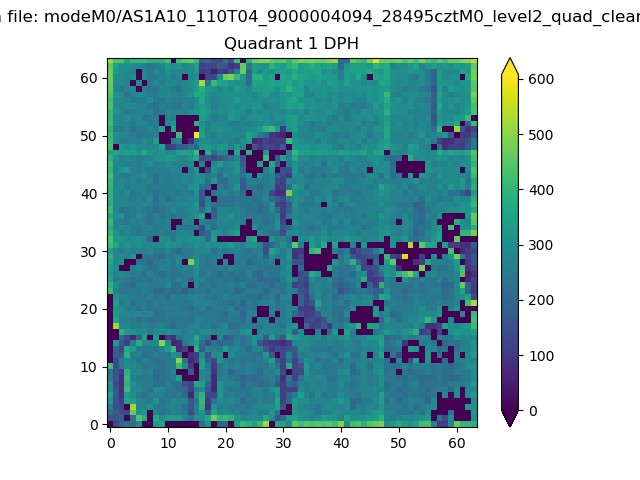 |
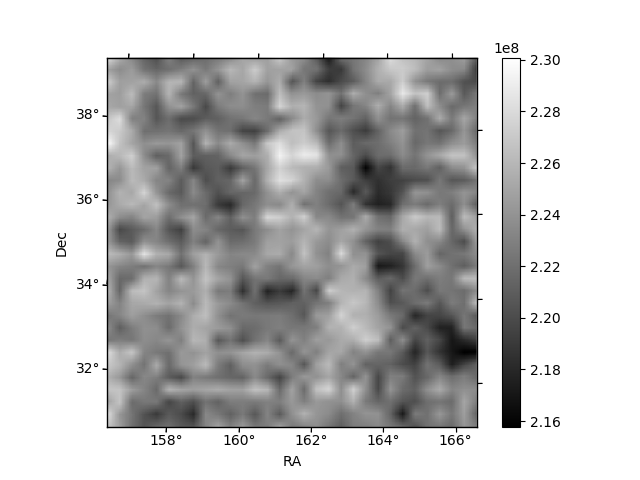
Quadrant B |
|---|---|---|---|
| Quadrant D | 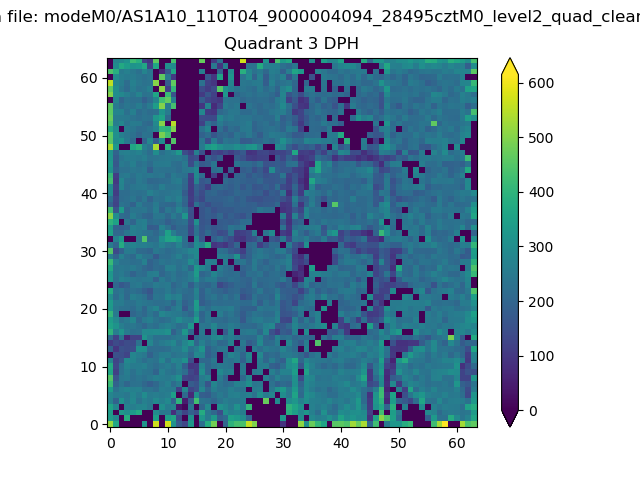 |
 |
Quadrant C |
| Plot type | Count rate plots | Images |
|---|---|---|
| Comparison with Poisson distribution Blue bars denote a histogram of data divided into 1 sec bins. Red curve is a Poisson curve with rate = median count rate of data. |
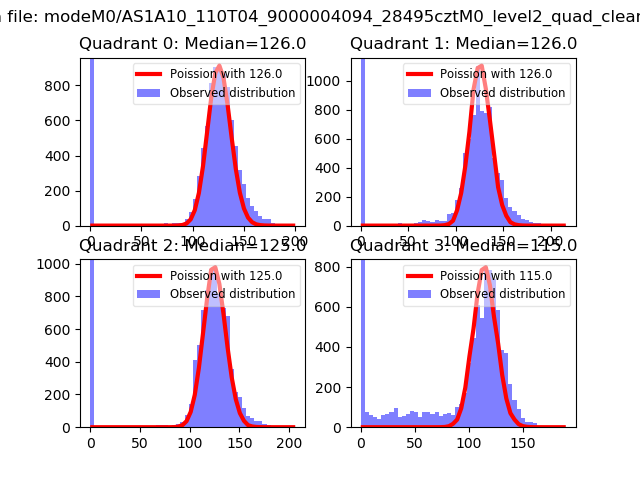 |
 |
| Quadrant-wise count rates Data is divided into 100 sec bins |
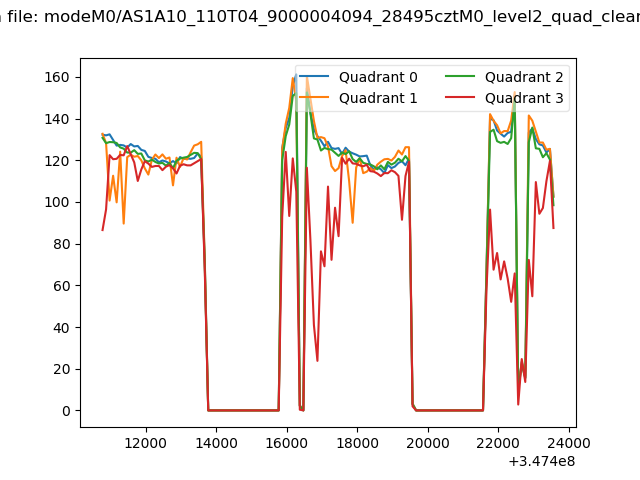 |
|
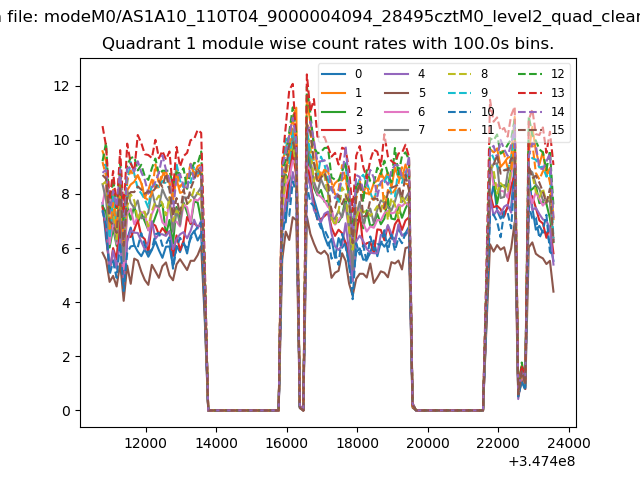
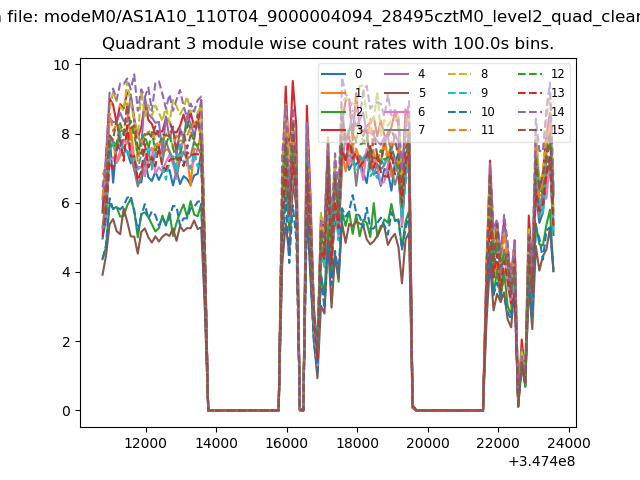
| Module-wise count rates for Quadrant A Data is divided into 100 sec bins |
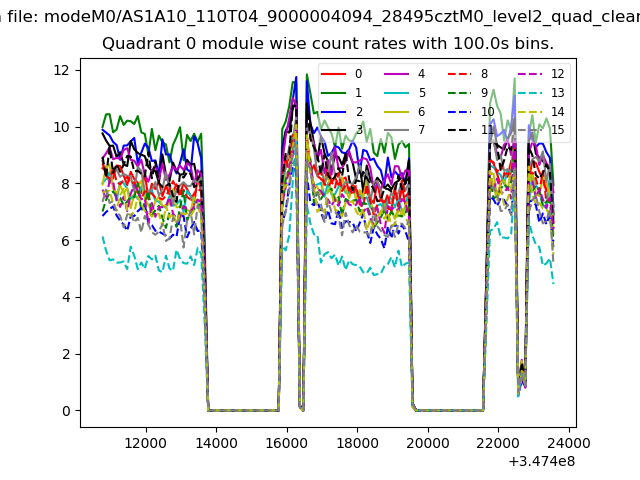 |
 |
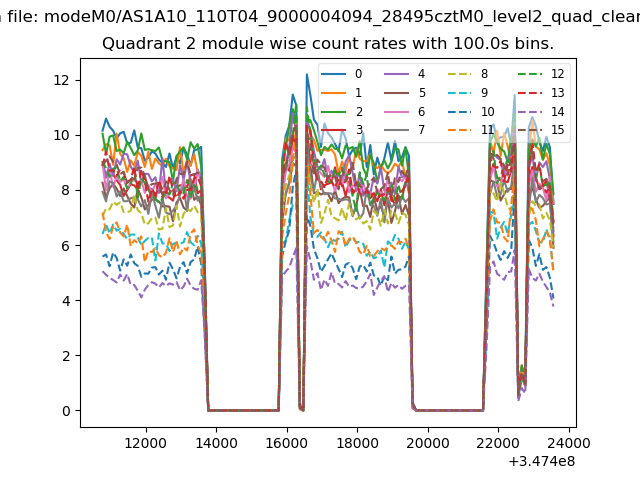
| Module-wise count rates for Quadrant B Data is divided into 100 sec bins |
 |
 |
| Module-wise count rates for Quadrant C Data is divided into 100 sec bins |
 |
 |
| Module-wise count rates for Quadrant D Data is divided into 100 sec bins |
 |
 |
| Parameter | Plot |
|---|---|
| CZT HV Monitor | 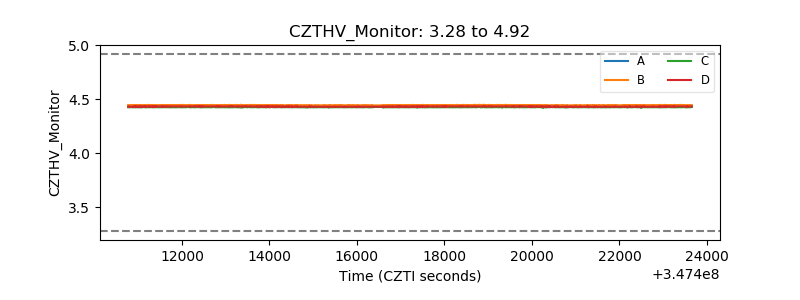 |
| D_VDD | 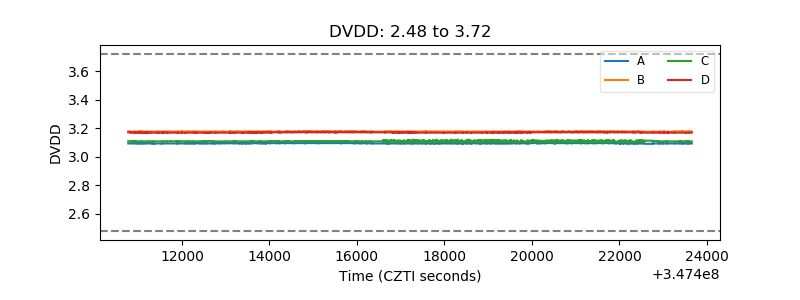 |
| Temperature 1 | 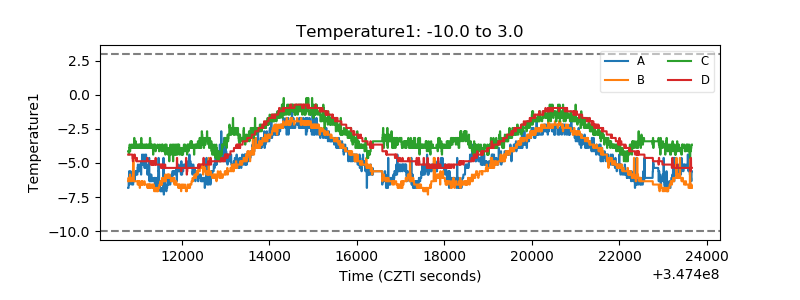 |
| Veto HV Monitor | 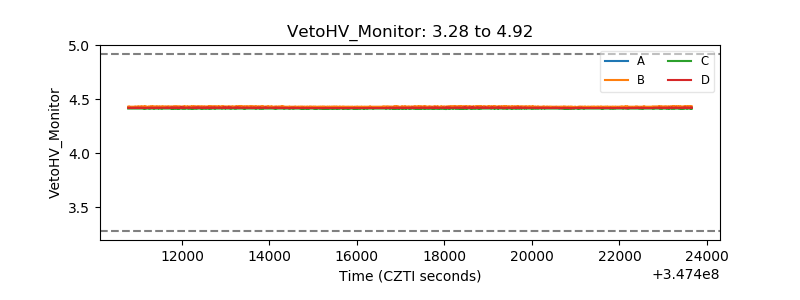 |
| Veto LLD | 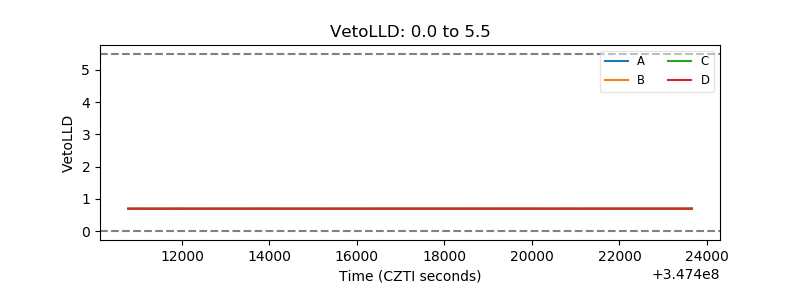 |
| Alpha Counter | 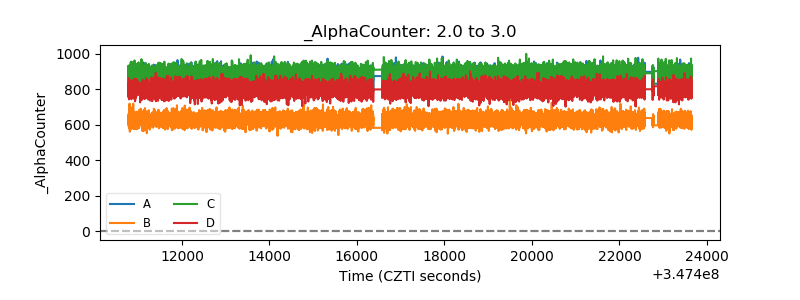 |
| _CPM_Rate | 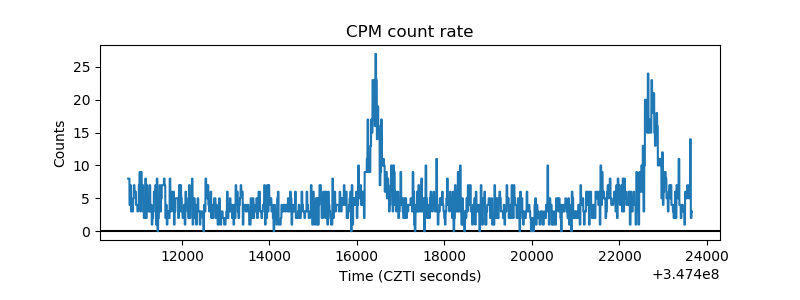 |
| CZT Counter | 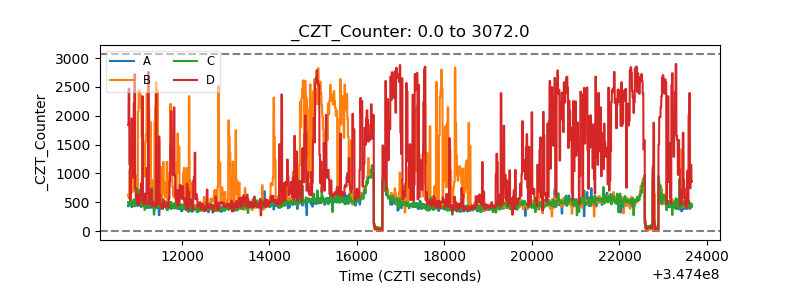 |
| +2.5 Volts monitor |  |
| +5 Volts monitor |  |
| _ROLL_ROT | 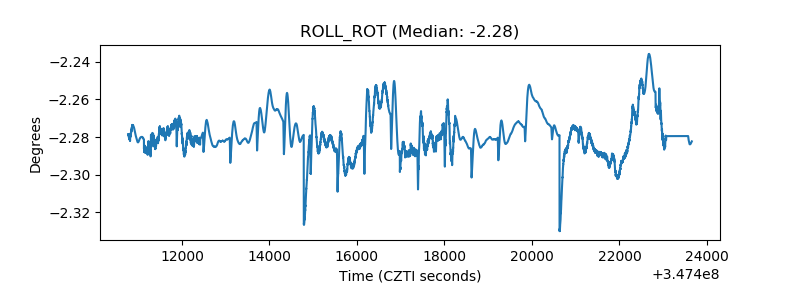 |
| _Roll_DEC | 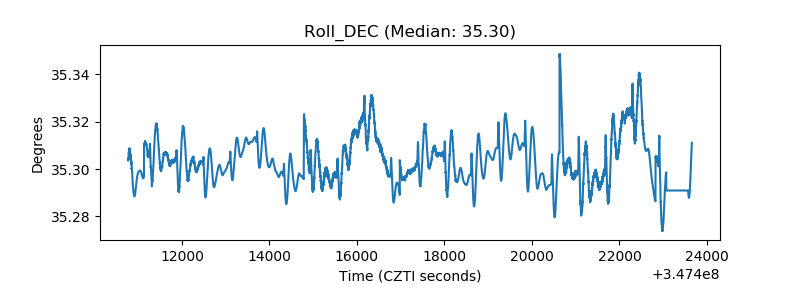 |
| _Roll_RA | 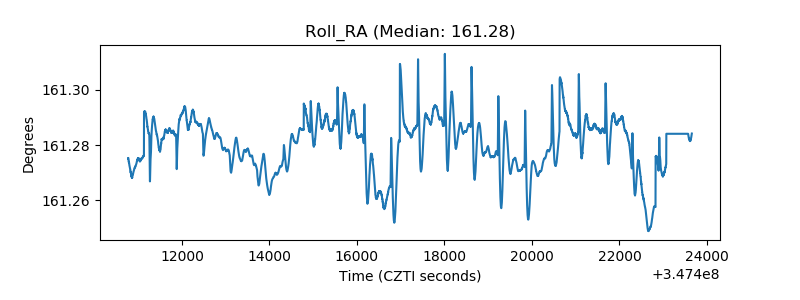 |
| Veto Counter | 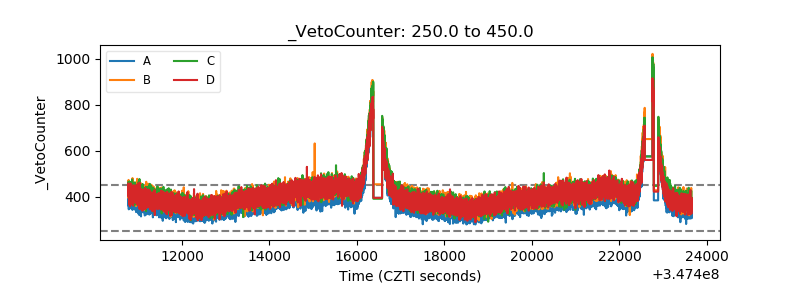 |