| Param | Original file | Final file |
|---|---|---|
| Filename | modeM0/AS1A10_110T05_9000004098cztM0_level2.fits | modeM0/AS1A10_110T05_9000004098cztM0_level2_quad_clean.evt |
| Size (bytes) | 581,463,360 | 645,053,760 |
| Size | 554.5 MB | 615.2 MB |
| Events in quadrant A | 3,592,704 | 4,071,657 |
| Events in quadrant B | 3,437,676 | 4,080,064 |
| Events in quadrant C | 3,520,042 | 3,914,684 |
| Events in quadrant D | 2,941,904 | 3,355,504 |
| Mode M9 | |||
|---|---|---|---|
| Quadrant | BADHDUFLAG | Total packets | Discarded packets |
| A | 0 | 88 | 0 |
| B | 0 | 88 | 0 |
| C | 0 | 88 | 0 |
| D | 0 | 88 | 0 |
| Mode SS | |||
|---|---|---|---|
| Quadrant | BADHDUFLAG | Total packets | Discarded packets |
| A | 0 | 1220 | 0 |
| B | 0 | 1220 | 0 |
| C | 0 | 1220 | 0 |
| D | 0 | 1220 | 0 |
| Mode M0 | |||
|---|---|---|---|
| Quadrant | BADHDUFLAG | Total packets | Discarded packets |
| A | 0 | 125309 | 0 |
| B | 0 | 128307 | 0 |
| C | 0 | 127692 | 0 |
| D | 0 | 204722 | 0 |
| Quadrant | Total seconds | Saturated seconds | Saturation percentage |
|---|---|---|---|
| A | 59990 | 494 | 0.823471% |
| B | 59990 | 822 | 1.370228% |
| C | 59990 | 1145 | 1.908651% |
| D | 59990 | 6943 | 11.573596% |
Noise dominated data is calculated using 1-second bins in cleaned event files. If a bin has >2000 counts, and if more than 50% of those come from <1% of pixels, then it is considered to be noise-dominated and hence unusable.
| Quadrant | # 1 sec bins | Bins with >0 counts | Bins with >2000 counts | High rate bins dominated by noise | Noise dominated (total time) | Noise dominated (detector-on time) | Marked lightcurve |
|---|---|---|---|---|---|---|---|
| A | 68720 | 59983 | 0 | 0 | 0.00% | 0.00% |  |
| B | 68720 | 59978 | 0 | 0 | 0.00% | 0.00% | 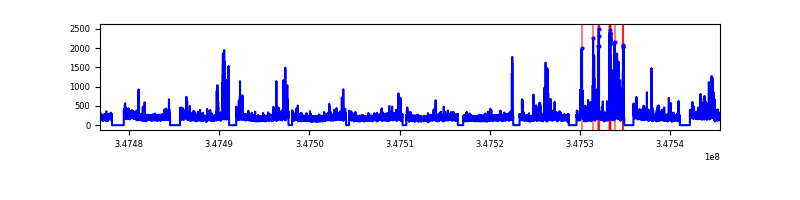 |
| C | 68720 | 59981 | 0 | 0 | 0.00% | 0.00% |  |
| D | 68720 | 59940 | 0 | 0 | 0.00% | 0.00% | 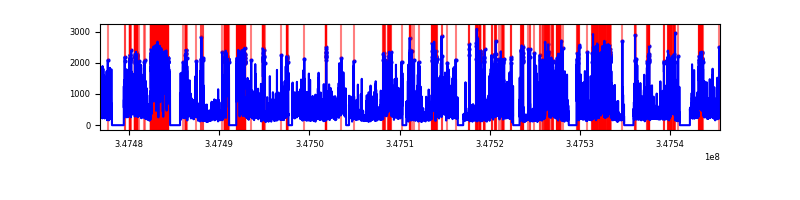 |
Top three noisy pixels from each quadrant. If the there are fewer than three noisy pixels in the level2.evt file, extra rows are filled as -1
| Pixel properties | Quadrant properties | ||||||
|---|---|---|---|---|---|---|---|
| Quadrant | DetID | PixID | Counts | Sigma | Mean | Median | Sigma |
| A | 0 | 29 | 3437 | 11.03 | 937 | 881 | 231.7 |
| A | 7 | 110 | 2833 | 8.42 | 937 | 881 | 231.7 |
| A | 0 | 30 | 2690 | 7.81 | 937 | 881 | 231.7 |
| B | 2 | 9 | 2796 | 10.78 | 910 | 873 | 178.5 |
| B | 2 | 8 | 2297 | 7.98 | 910 | 873 | 178.5 |
| B | 5 | 128 | 2258 | 7.76 | 910 | 873 | 178.5 |
| C | 12 | 241 | 2466 | 6.86 | 930 | 874 | 232.2 |
| C | 3 | 126 | 2457 | 6.82 | 930 | 874 | 232.2 |
| C | 3 | 187 | 2382 | 6.5 | 930 | 874 | 232.2 |
| D | 6 | 67 | 2155 | 6.27 | 839 | 768 | 221.2 |
| D | 3 | 14 | 2116 | 6.09 | 839 | 768 | 221.2 |
| D | 15 | 47 | 2032 | 5.71 | 839 | 768 | 221.2 |
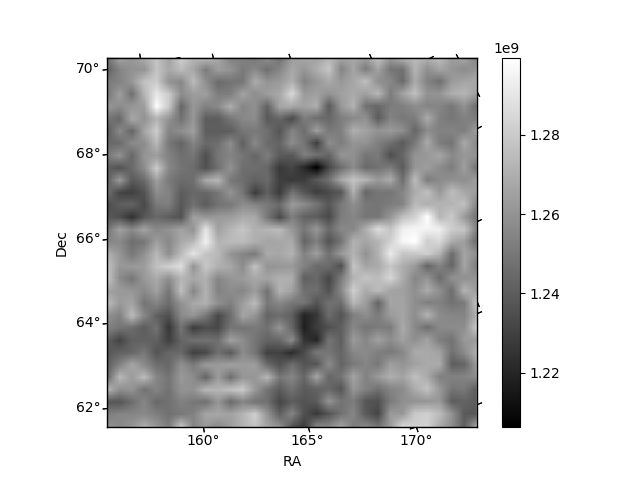
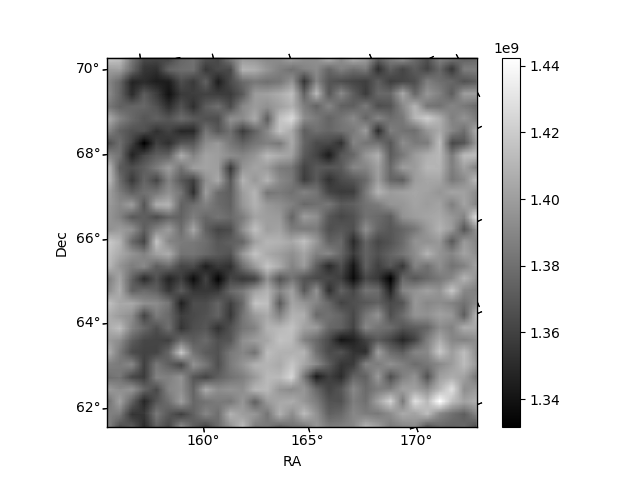
Histogram calculated using DETX and DETY for each event in the final _common_clean file
| Quadrant A | 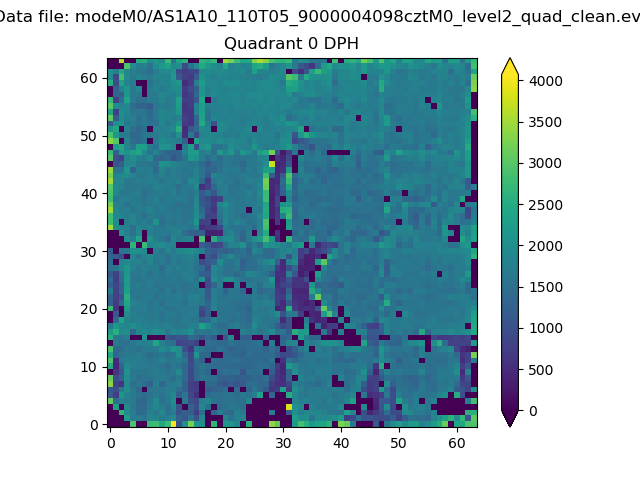 |
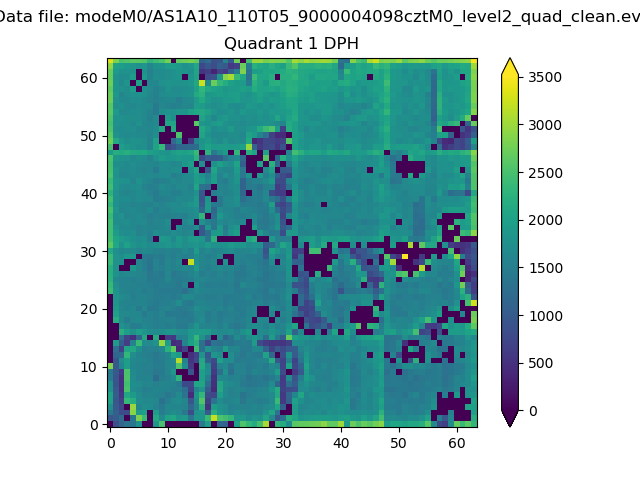 |
Quadrant B |
|---|---|---|---|
| Quadrant D |  |
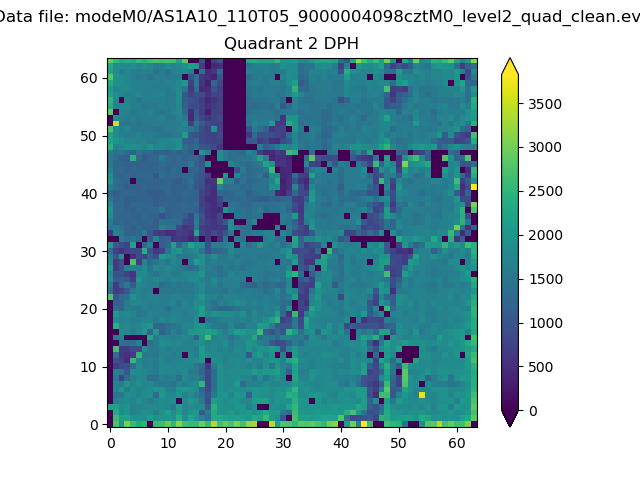 |
Quadrant C |
| Plot type | Count rate plots | Images |
|---|---|---|
| Comparison with Poisson distribution Blue bars denote a histogram of data divided into 1 sec bins. Red curve is a Poisson curve with rate = median count rate of data. |
 |
 |
| Quadrant-wise count rates Data is divided into 100 sec bins |
 |
|
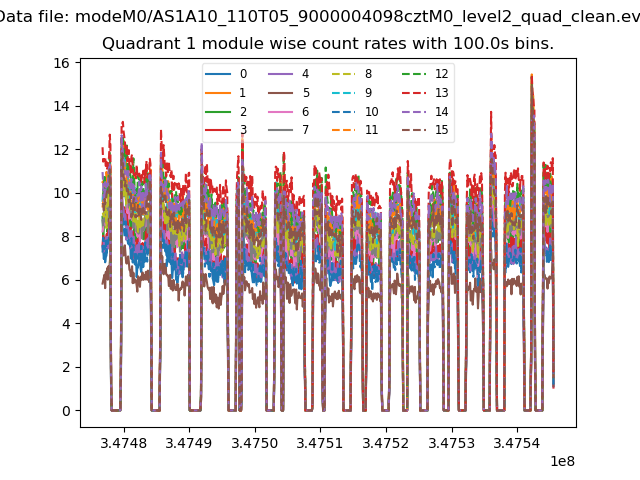
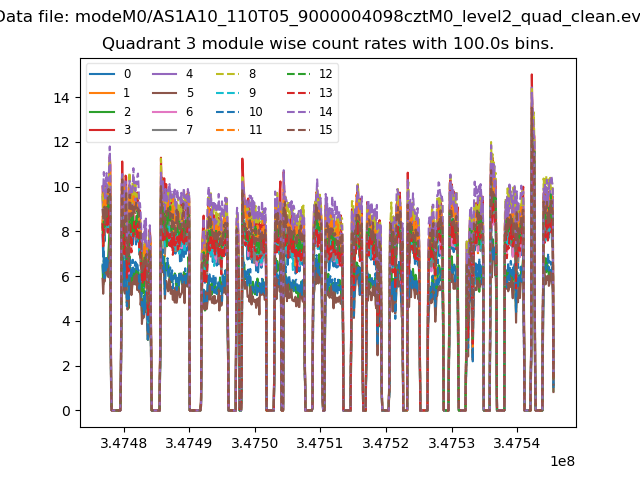
| Module-wise count rates for Quadrant A Data is divided into 100 sec bins |
 |
 |
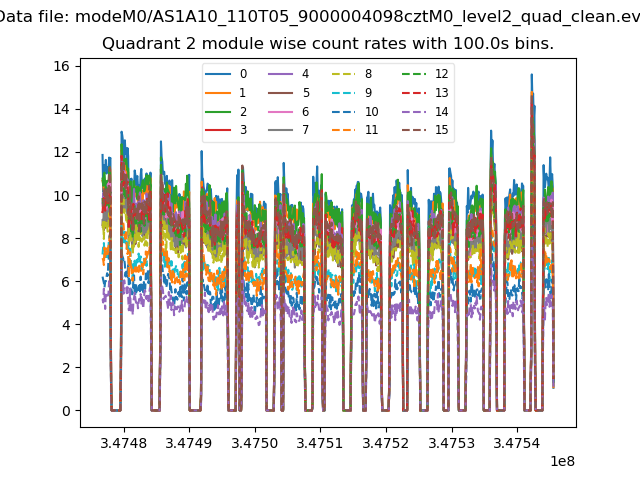
| Module-wise count rates for Quadrant B Data is divided into 100 sec bins |
 |
 |
| Module-wise count rates for Quadrant C Data is divided into 100 sec bins |
 |
 |
| Module-wise count rates for Quadrant D Data is divided into 100 sec bins |
 |
 |
| Parameter | Plot |
|---|---|
| CZT HV Monitor |  |
| D_VDD |  |
| Temperature 1 | 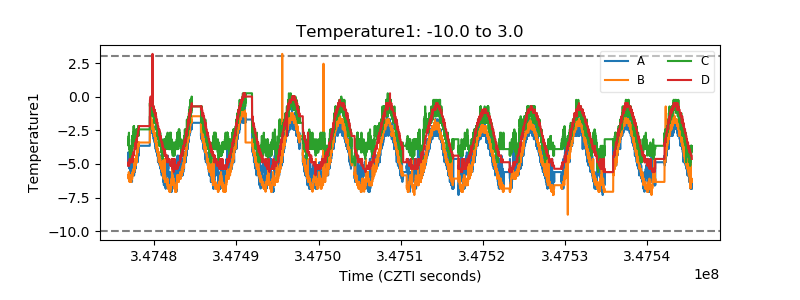 |
| Veto HV Monitor |  |
| Veto LLD | 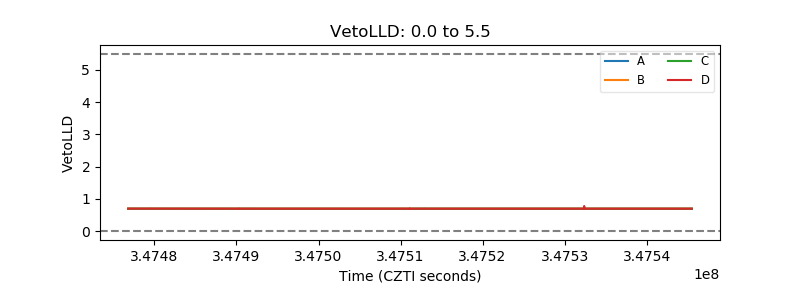 |
| Alpha Counter |  |
| _CPM_Rate | 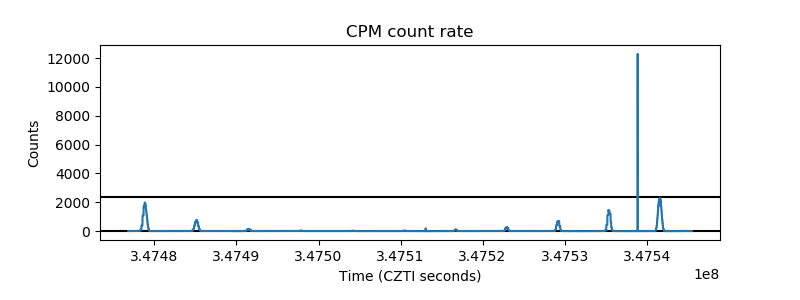 |
| CZT Counter |  |
| +2.5 Volts monitor |  |
| +5 Volts monitor |  |
| _ROLL_ROT |  |
| _Roll_DEC |  |
| _Roll_RA | 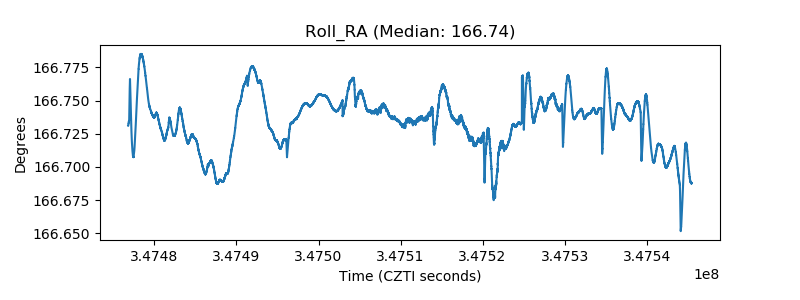 |
| Veto Counter |  |