| Param | Original file | Final file |
|---|---|---|
| Filename | modeM0/AS1A10_110T05_9000004098_28502cztM0_level2.evt | modeM0/AS1A10_110T05_9000004098_28502cztM0_level2_quad_clean.evt |
| Size (bytes) | 255,110,400 | 50,932,800 |
| Size | 243.3 MB | 48.6 MB |
| Events in quadrant A | 1,643,758 | 346,097 |
| Events in quadrant B | 1,423,186 | 358,564 |
| Events in quadrant C | 1,432,747 | 346,568 |
| Events in quadrant D | 3,051,212 | 307,249 |
| Mode M9 | |||
|---|---|---|---|
| Quadrant | BADHDUFLAG | Total packets | Discarded packets |
| A | 0 | 13 | 0 |
| B | 0 | 13 | 0 |
| C | 0 | 13 | 0 |
| D | 0 | 13 | 0 |
| Mode SS | |||
|---|---|---|---|
| Quadrant | BADHDUFLAG | Total packets | Discarded packets |
| A | 0 | 52 | 0 |
| B | 0 | 52 | 0 |
| C | 0 | 52 | 0 |
| D | 0 | 52 | 0 |
| Mode M0 | |||
|---|---|---|---|
| Quadrant | BADHDUFLAG | Total packets | Discarded packets |
| A | 0 | 6621 | 1 |
| B | 0 | 5849 | 1 |
| C | 0 | 5921 | 1 |
| D | 0 | 10857 | 1 |
| Quadrant | Total seconds | Saturated seconds | Saturation percentage |
|---|---|---|---|
| A | 2561 | 86 | 3.358063% |
| B | 2561 | 87 | 3.397111% |
| C | 2561 | 119 | 4.646622% |
| D | 2561 | 590 | 23.037876% |
Noise dominated data is calculated using 1-second bins in cleaned event files. If a bin has >2000 counts, and if more than 50% of those come from <1% of pixels, then it is considered to be noise-dominated and hence unusable.
| Quadrant | # 1 sec bins | Bins with >0 counts | Bins with >2000 counts | High rate bins dominated by noise | Noise dominated (total time) | Noise dominated (detector-on time) | Marked lightcurve |
|---|---|---|---|---|---|---|---|
| A | 3881 | 2561 | 3 | 3 | 0.08% | 0.12% | 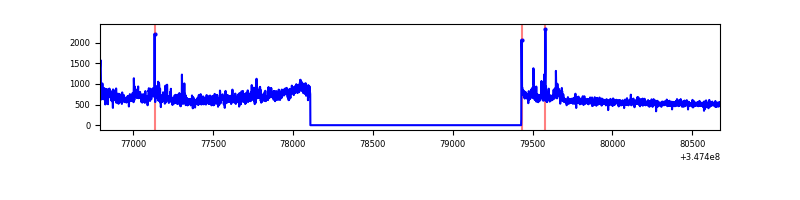 |
| B | 3881 | 2561 | 0 | 0 | 0.00% | 0.00% | 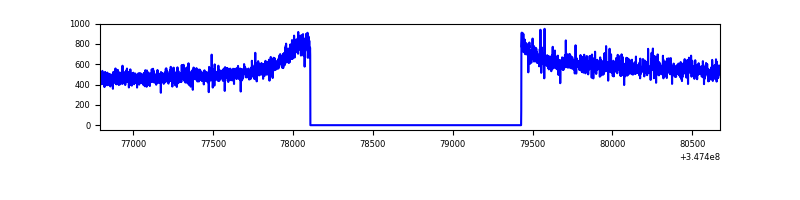 |
| C | 3881 | 2561 | 0 | 0 | 0.00% | 0.00% | 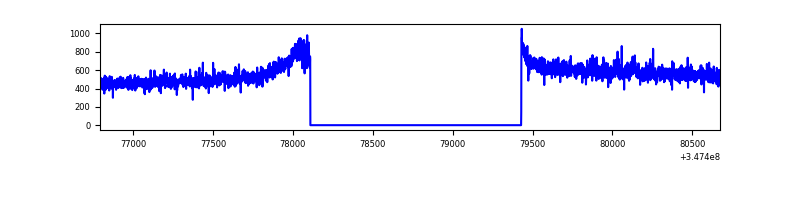 |
| D | 3880 | 2560 | 346 | 346 | 8.92% | 13.52% | 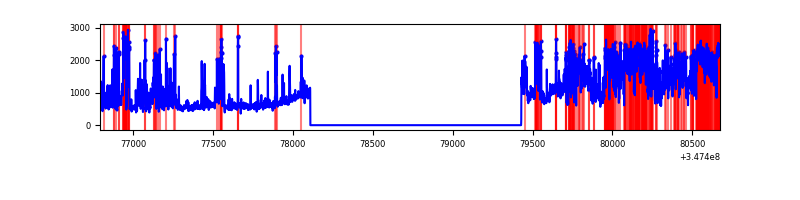 |
Top three noisy pixels from each quadrant. If the there are fewer than three noisy pixels in the level2.evt file, extra rows are filled as -1
| Pixel properties | Quadrant properties | ||||||
|---|---|---|---|---|---|---|---|
| Quadrant | DetID | PixID | Counts | Sigma | Mean | Median | Sigma |
| A | 15 | 174 | 255480 | 3555.56 | 357 | 352 | 71.8 |
| A | 8 | 192 | 5344 | 69.57 | 357 | 352 | 71.8 |
| A | 13 | 254 | 4467 | 57.35 | 357 | 352 | 71.8 |
| B | 0 | 230 | 19182 | 279.99 | 356 | 348 | 67.3 |
| B | 12 | 111 | 7887 | 112.07 | 356 | 348 | 67.3 |
| B | 11 | 111 | 7181 | 101.58 | 356 | 348 | 67.3 |
| C | 14 | 238 | 56985 | 706.59 | 348 | 351 | 80.2 |
| C | 7 | 247 | 6759 | 79.95 | 348 | 351 | 80.2 |
| C | 3 | 233 | 5171 | 60.14 | 348 | 351 | 80.2 |
| D | 1 | 52 | 1512723 | 19066.85 | 331 | 323 | 79.3 |
| D | 8 | 195 | 170679 | 2147.68 | 331 | 323 | 79.3 |
| D | 2 | 250 | 69280 | 869.34 | 331 | 323 | 79.3 |
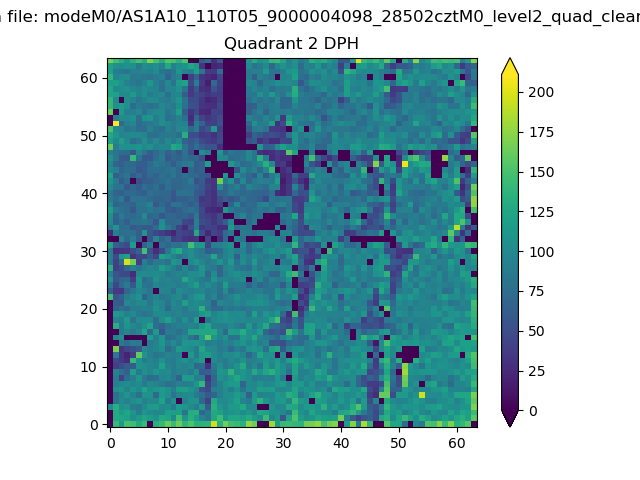
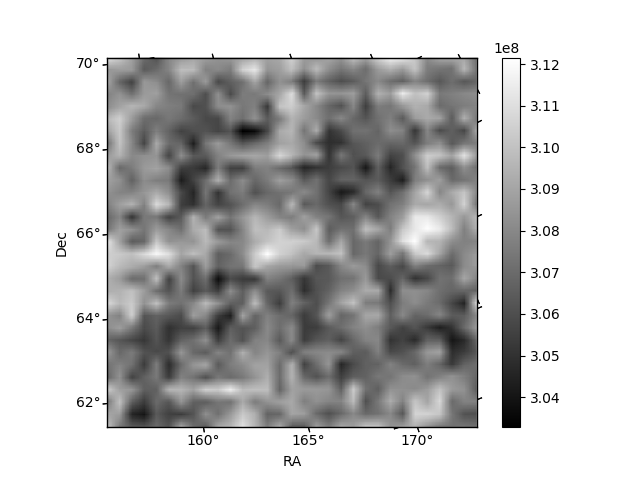
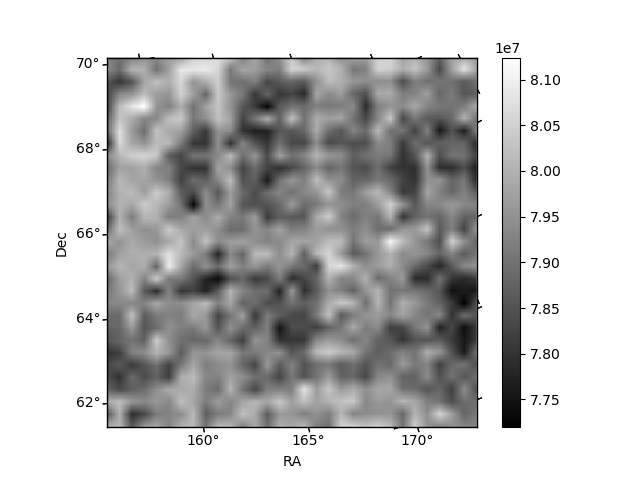
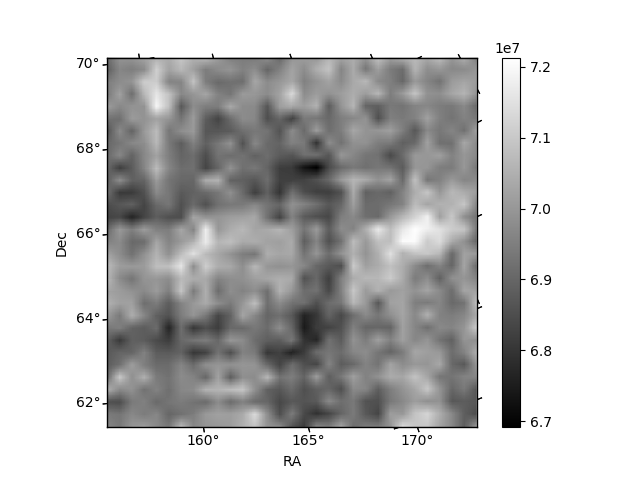
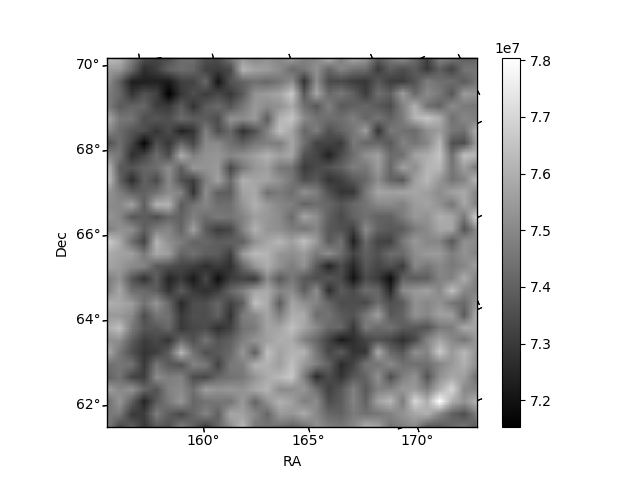
Histogram calculated using DETX and DETY for each event in the final _common_clean file
| Quadrant A | 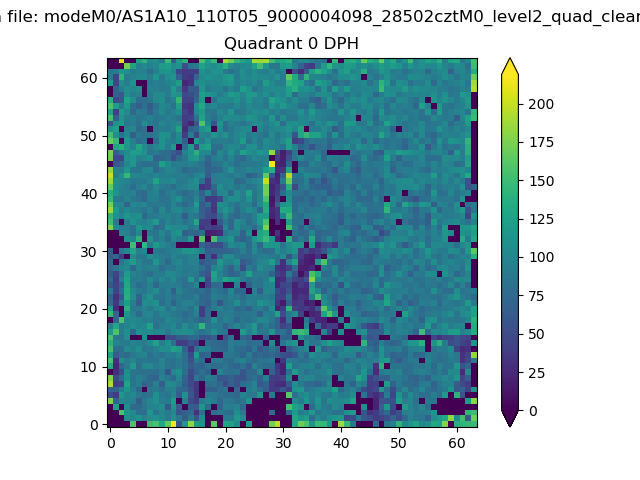 |
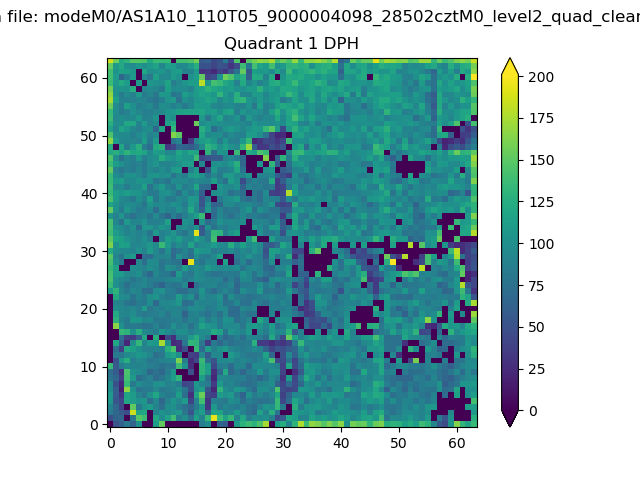 |
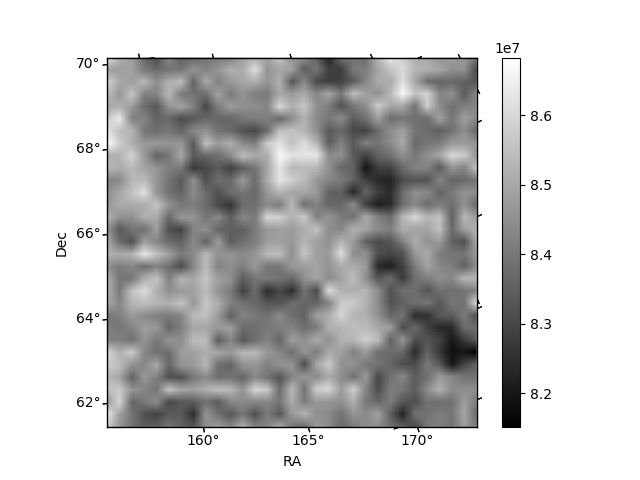
Quadrant B |
|---|---|---|---|
| Quadrant D | 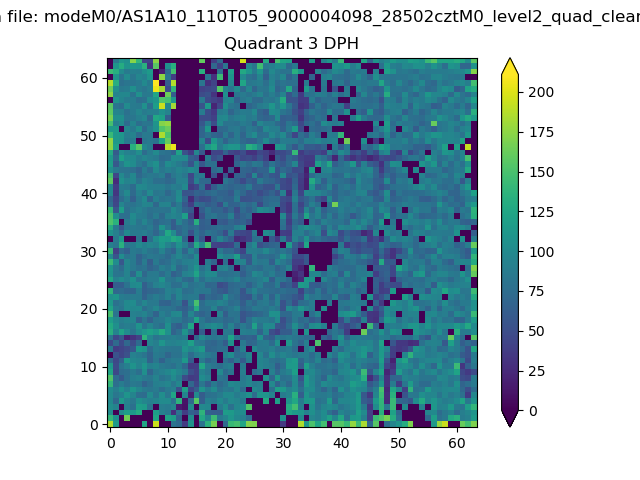 |
 |
Quadrant C |
| Plot type | Count rate plots | Images |
|---|---|---|
| Comparison with Poisson distribution Blue bars denote a histogram of data divided into 1 sec bins. Red curve is a Poisson curve with rate = median count rate of data. |
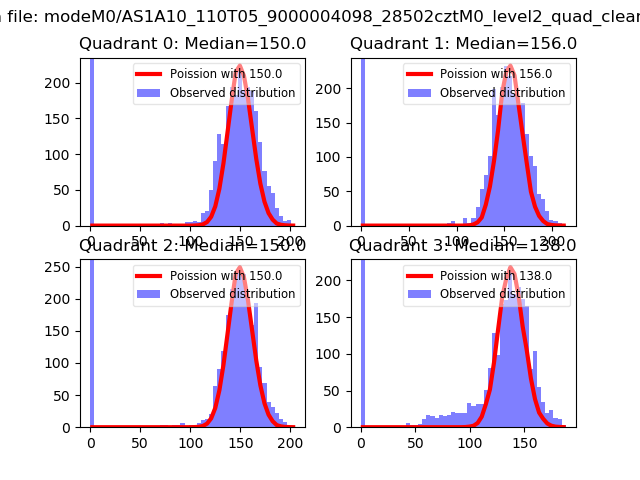 |
 |
| Quadrant-wise count rates Data is divided into 100 sec bins |
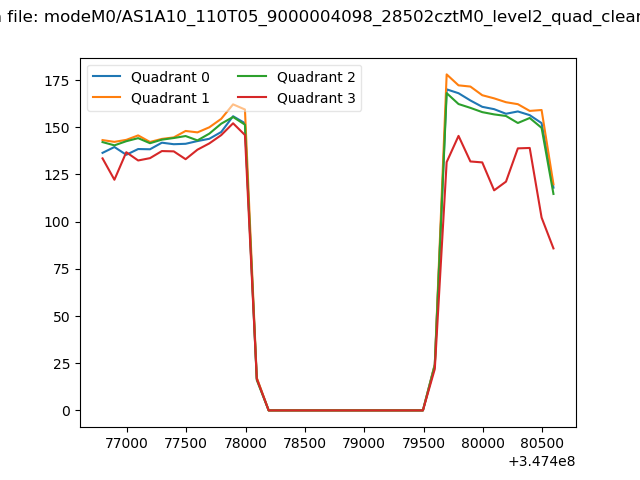 |
|
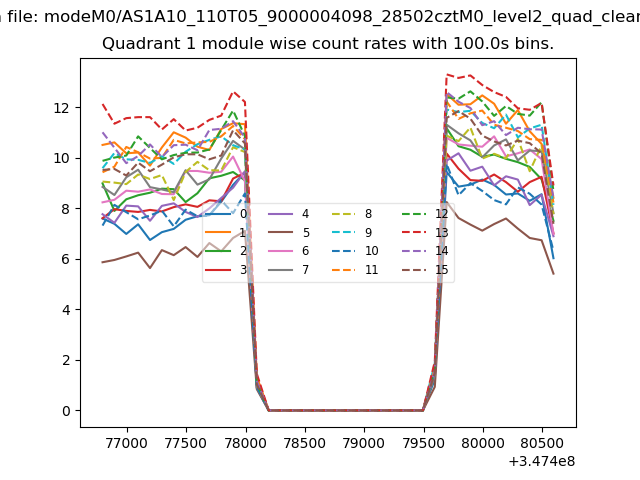
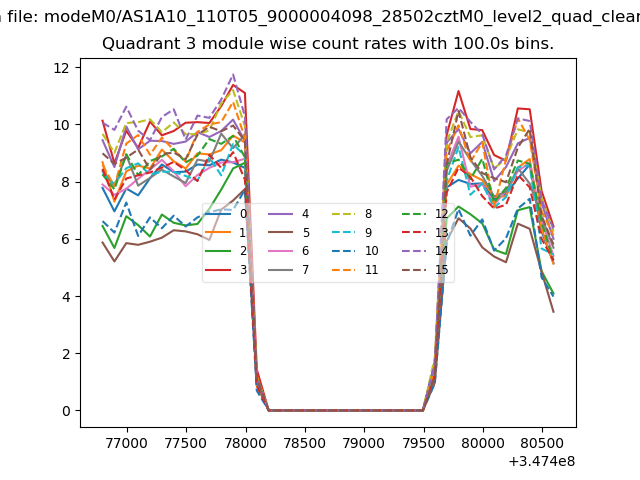
| Module-wise count rates for Quadrant A Data is divided into 100 sec bins |
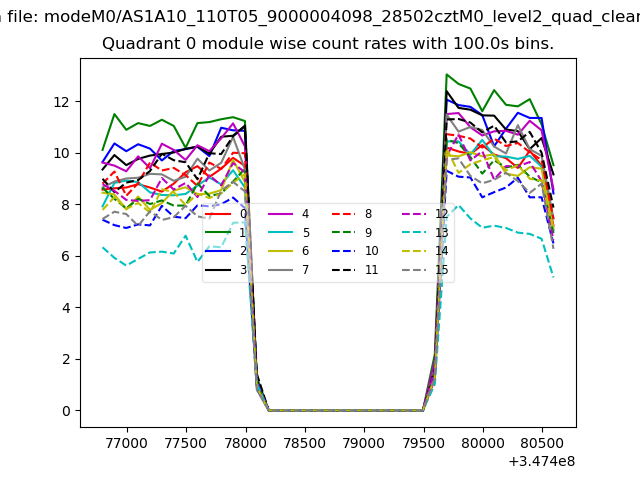 |
 |
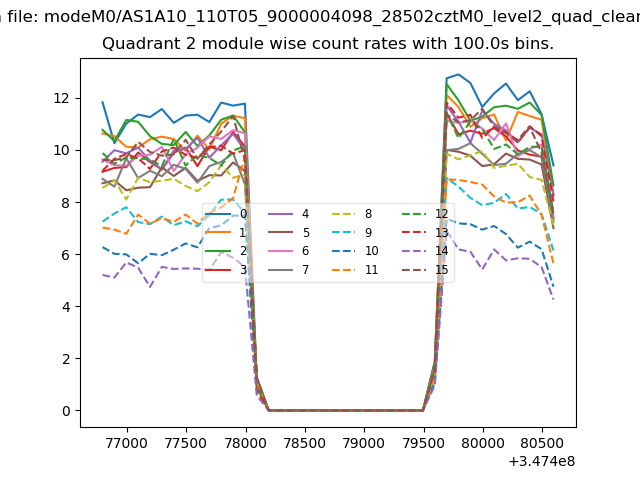
| Module-wise count rates for Quadrant B Data is divided into 100 sec bins |
 |
 |
| Module-wise count rates for Quadrant C Data is divided into 100 sec bins |
 |
 |
| Module-wise count rates for Quadrant D Data is divided into 100 sec bins |
 |
 |
| Parameter | Plot |
|---|---|
| CZT HV Monitor |  |
| D_VDD | 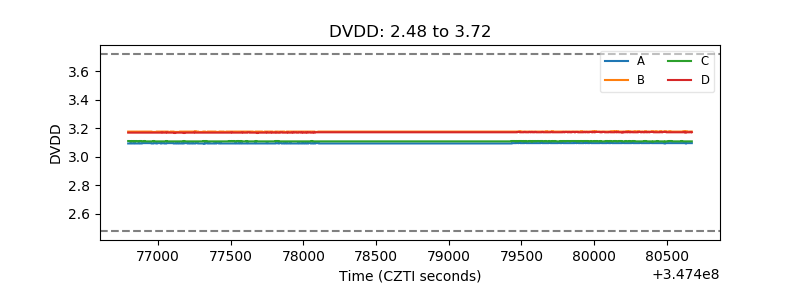 |
| Temperature 1 | 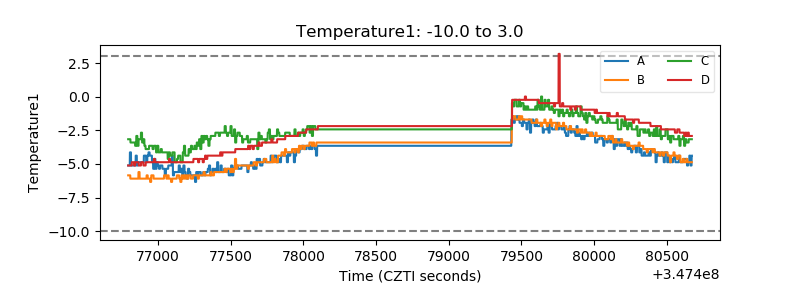 |
| Veto HV Monitor | 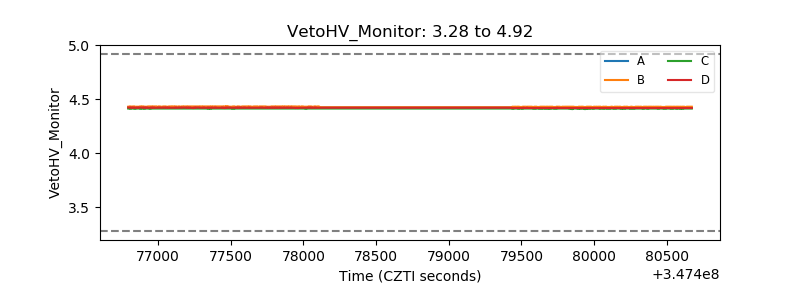 |
| Veto LLD | 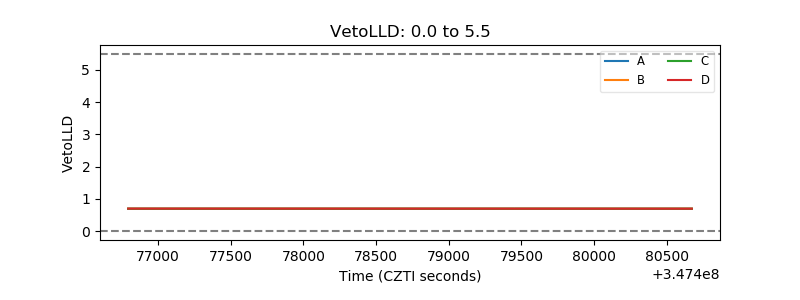 |
| Alpha Counter | 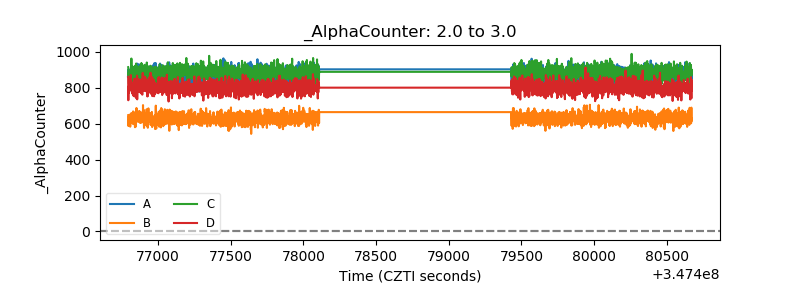 |
| _CPM_Rate | 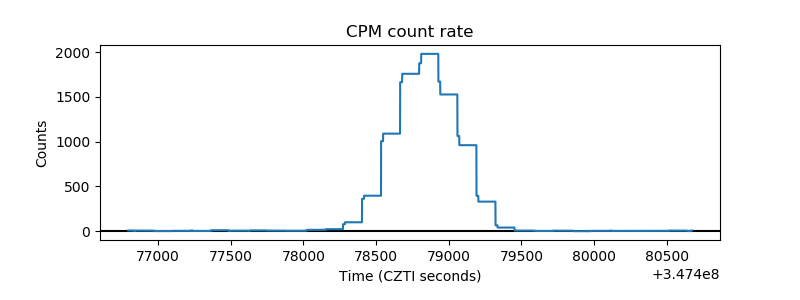 |
| CZT Counter | 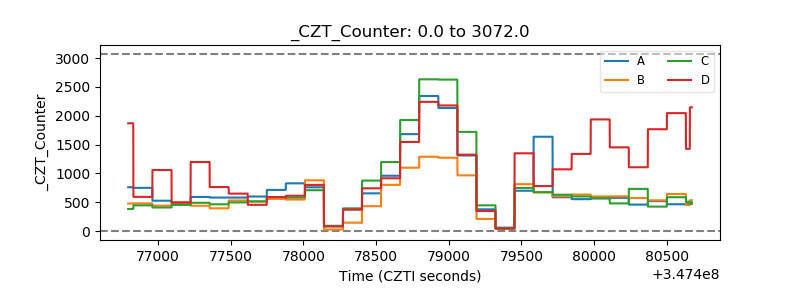 |
| +2.5 Volts monitor | 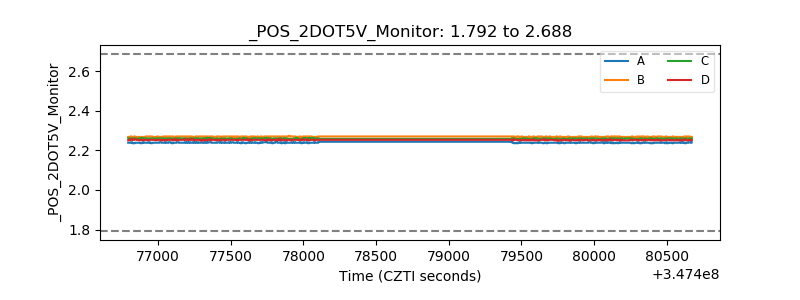 |
| +5 Volts monitor | 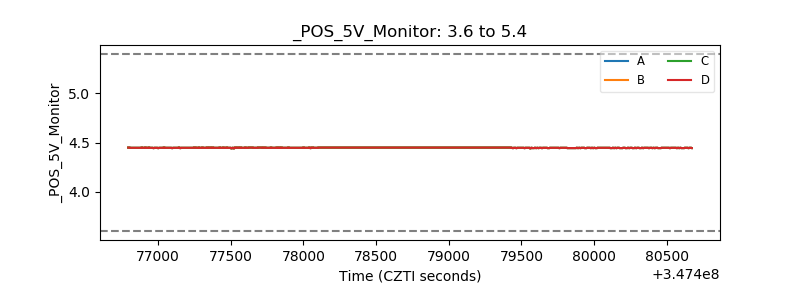 |
| _ROLL_ROT | 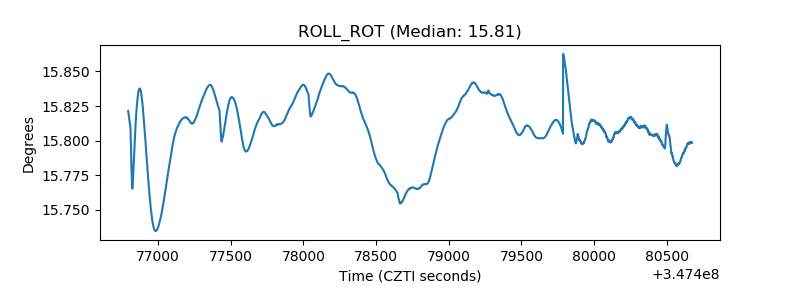 |
| _Roll_DEC | 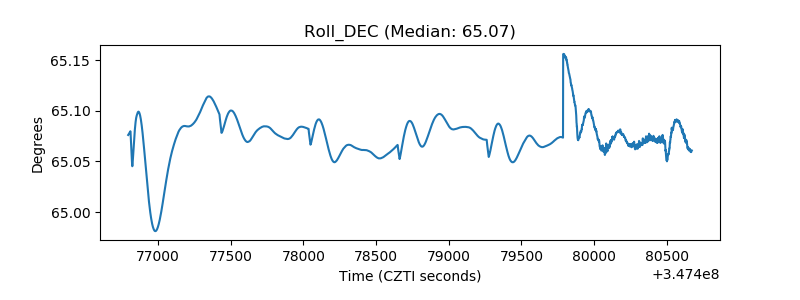 |
| _Roll_RA | 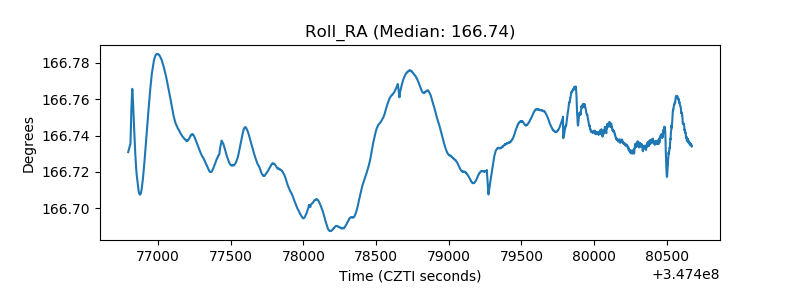 |
| Veto Counter | 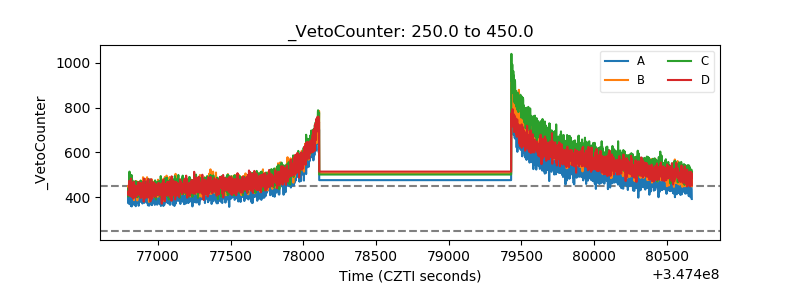 |