| Param | Original file | Final file |
|---|---|---|
| Filename | modeM0/AS1A10_110T05_9000004098_28503cztM0_level2.evt | modeM0/AS1A10_110T05_9000004098_28503cztM0_level2_quad_clean.evt |
| Size (bytes) | 678,389,760 | 121,224,960 |
| Size | 647.0 MB | 115.6 MB |
| Events in quadrant A | 3,268,664 | 838,004 |
| Events in quadrant B | 3,276,128 | 859,993 |
| Events in quadrant C | 4,023,093 | 824,240 |
| Events in quadrant D | 9,544,494 | 702,077 |
| Mode M9 | |||
|---|---|---|---|
| Quadrant | BADHDUFLAG | Total packets | Discarded packets |
| A | 0 | 11 | 0 |
| B | 0 | 11 | 0 |
| C | 0 | 11 | 0 |
| D | 0 | 11 | 0 |
| Mode SS | |||
|---|---|---|---|
| Quadrant | BADHDUFLAG | Total packets | Discarded packets |
| A | 0 | 130 | 0 |
| B | 0 | 130 | 0 |
| C | 0 | 130 | 0 |
| D | 0 | 130 | 0 |
| Mode M0 | |||
|---|---|---|---|
| Quadrant | BADHDUFLAG | Total packets | Discarded packets |
| A | 0 | 13842 | 3 |
| B | 0 | 13864 | 2 |
| C | 0 | 16088 | 2 |
| D | 0 | 32812 | 2 |
| Quadrant | Total seconds | Saturated seconds | Saturation percentage |
|---|---|---|---|
| A | 6395 | 110 | 1.720094% |
| B | 6396 | 104 | 1.626016% |
| C | 6396 | 321 | 5.018762% |
| D | 6396 | 2277 | 35.600375% |
Noise dominated data is calculated using 1-second bins in cleaned event files. If a bin has >2000 counts, and if more than 50% of those come from <1% of pixels, then it is considered to be noise-dominated and hence unusable.
| Quadrant | # 1 sec bins | Bins with >0 counts | Bins with >2000 counts | High rate bins dominated by noise | Noise dominated (total time) | Noise dominated (detector-on time) | Marked lightcurve |
|---|---|---|---|---|---|---|---|
| A | 7505 | 6395 | 6 | 6 | 0.08% | 0.09% | 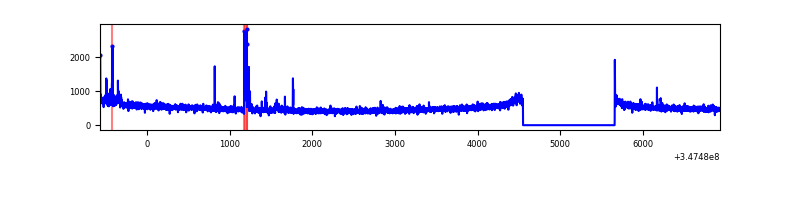 |
| B | 7506 | 6396 | 0 | 0 | 0.00% | 0.00% | 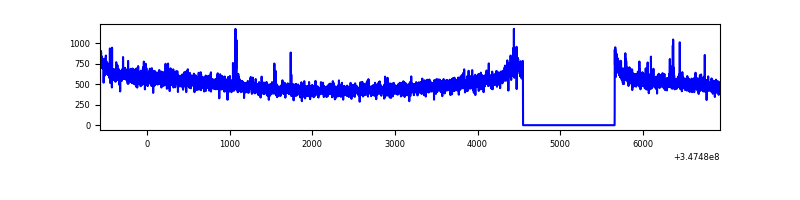 |
| C | 7506 | 6396 | 126 | 126 | 1.68% | 1.97% | 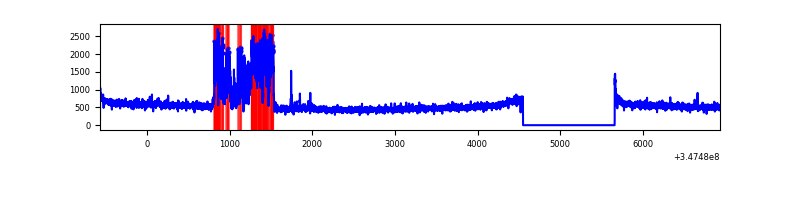 |
| D | 7506 | 6396 | 2072 | 2072 | 27.60% | 32.40% | 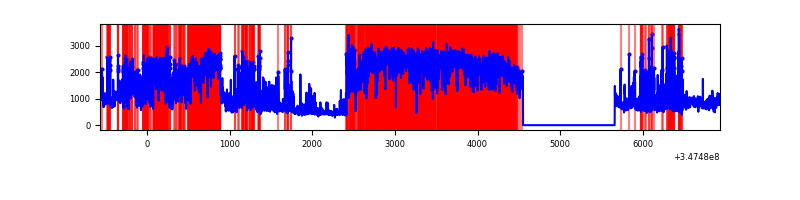 |
Top three noisy pixels from each quadrant. If the there are fewer than three noisy pixels in the level2.evt file, extra rows are filled as -1
| Pixel properties | Quadrant properties | ||||||
|---|---|---|---|---|---|---|---|
| Quadrant | DetID | PixID | Counts | Sigma | Mean | Median | Sigma |
| A | 15 | 174 | 97511 | 603.56 | 816 | 800 | 160.2 |
| A | 13 | 254 | 12139 | 70.76 | 816 | 800 | 160.2 |
| A | 8 | 192 | 10983 | 63.55 | 816 | 800 | 160.2 |
| B | 0 | 230 | 42630 | 276.19 | 818 | 798 | 151.5 |
| B | 12 | 111 | 18142 | 114.51 | 818 | 798 | 151.5 |
| B | 11 | 111 | 16115 | 101.13 | 818 | 798 | 151.5 |
| C | 4 | 254 | 738819 | 4041.47 | 799 | 806 | 182.6 |
| C | 14 | 238 | 129828 | 706.54 | 799 | 806 | 182.6 |
| C | 3 | 233 | 22604 | 119.37 | 799 | 806 | 182.6 |
| D | 8 | 195 | 3619976 | 21651.32 | 716 | 697 | 167.2 |
| D | 1 | 52 | 2968787 | 17755.76 | 716 | 697 | 167.2 |
| D | 2 | 250 | 93758 | 556.71 | 716 | 697 | 167.2 |
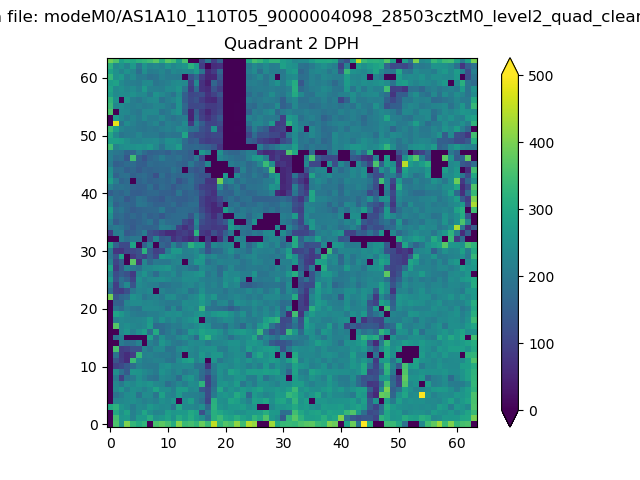
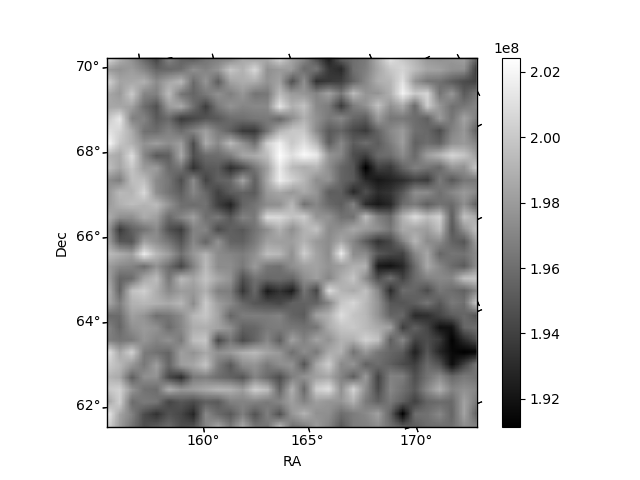
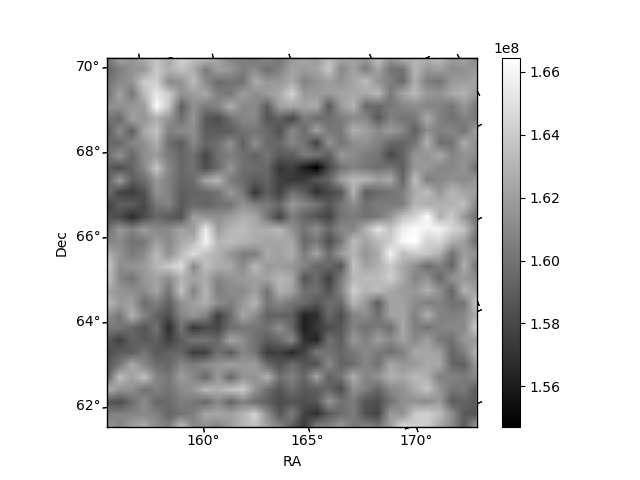
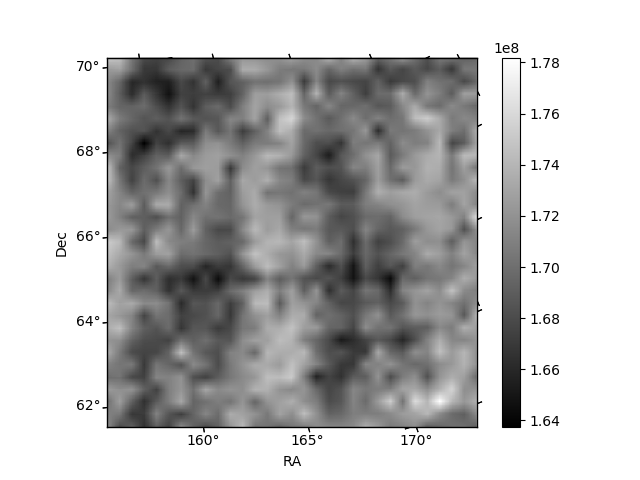
Histogram calculated using DETX and DETY for each event in the final _common_clean file
| Quadrant A | 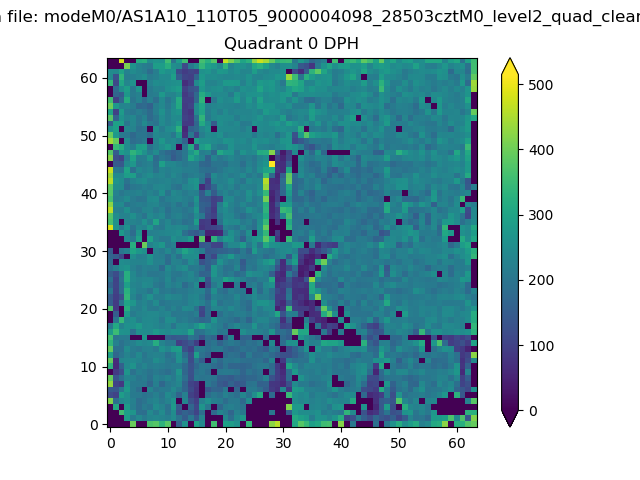 |
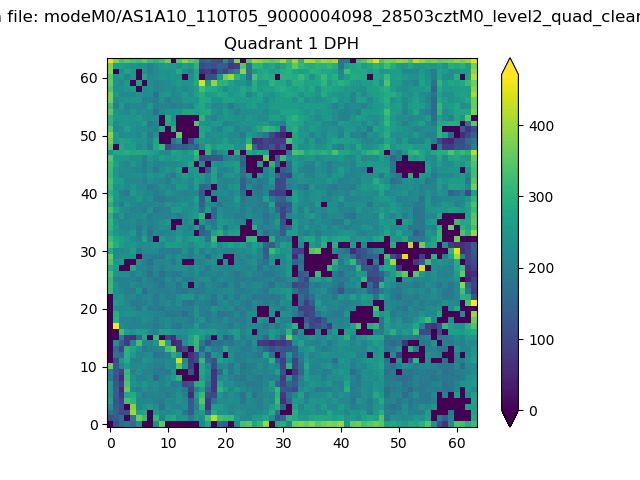 |
Quadrant B |
|---|---|---|---|
| Quadrant D | 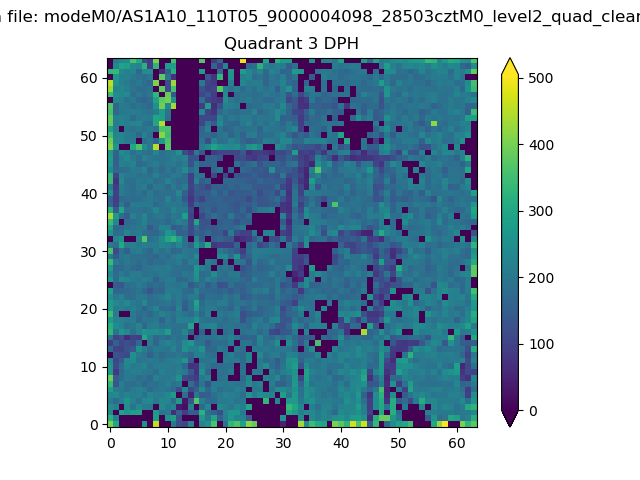 |
 |
Quadrant C |
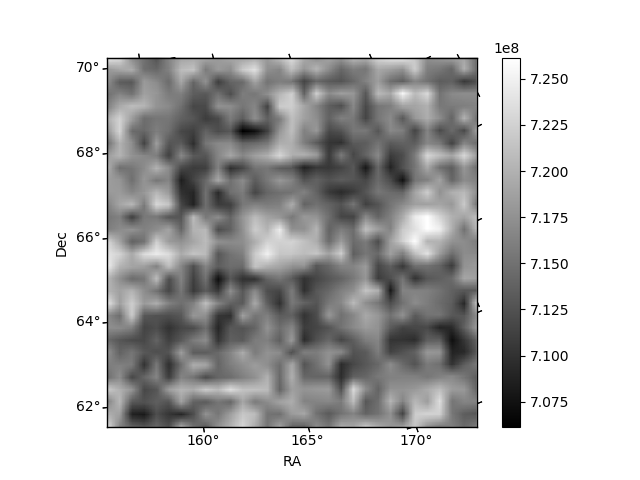
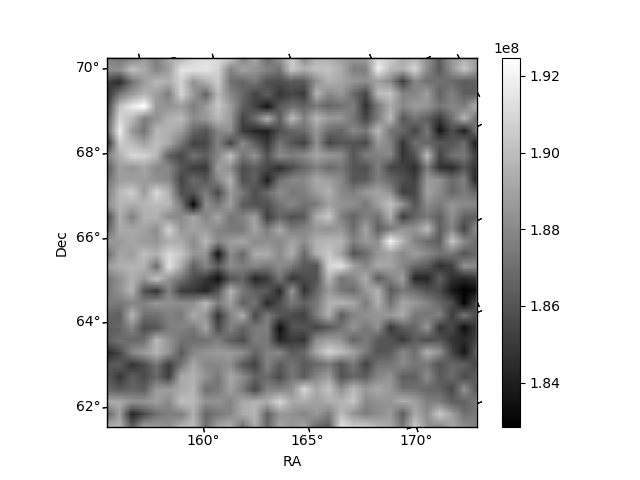
| Plot type | Count rate plots | Images |
|---|---|---|
| Comparison with Poisson distribution Blue bars denote a histogram of data divided into 1 sec bins. Red curve is a Poisson curve with rate = median count rate of data. |
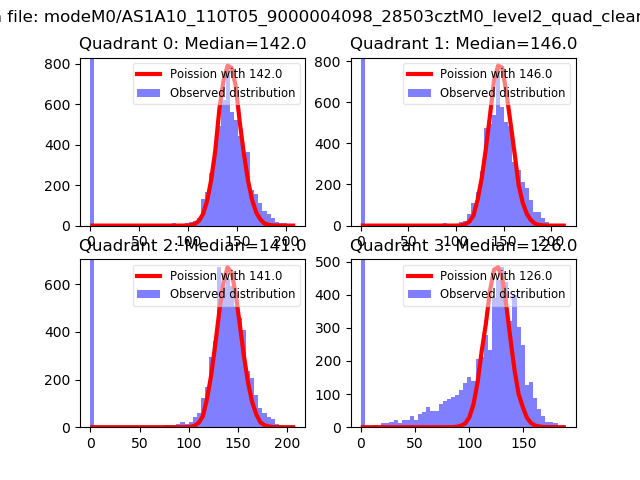 |
 |
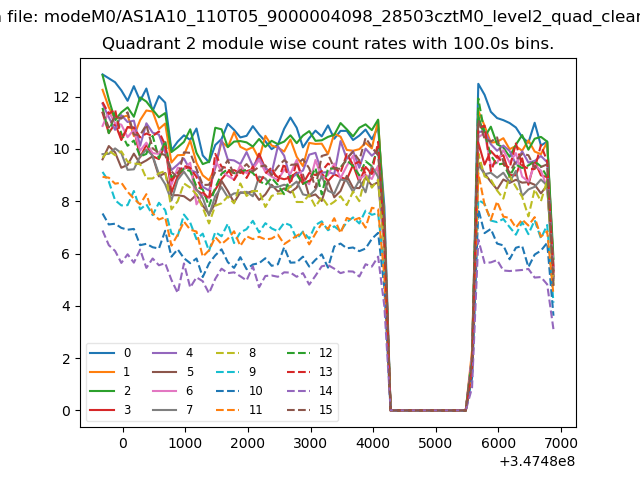
| Quadrant-wise count rates Data is divided into 100 sec bins |
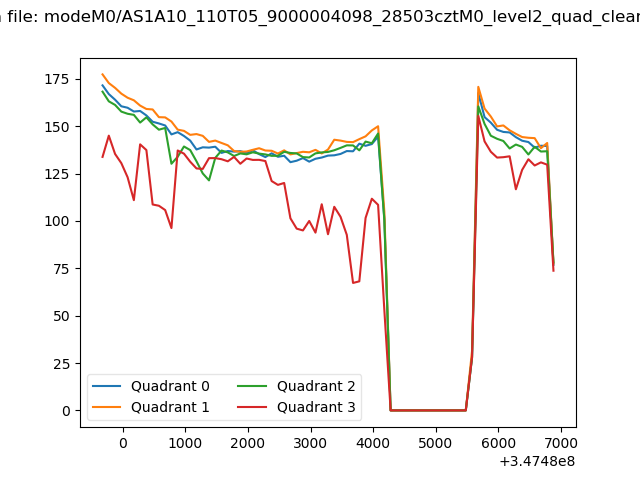 |
|
| Module-wise count rates for Quadrant A Data is divided into 100 sec bins |
 |
 |
| Module-wise count rates for Quadrant B Data is divided into 100 sec bins |
 |
 |
| Module-wise count rates for Quadrant C Data is divided into 100 sec bins |
 |
 |
| Module-wise count rates for Quadrant D Data is divided into 100 sec bins |
 |
 |
| Parameter | Plot |
|---|---|
| CZT HV Monitor | 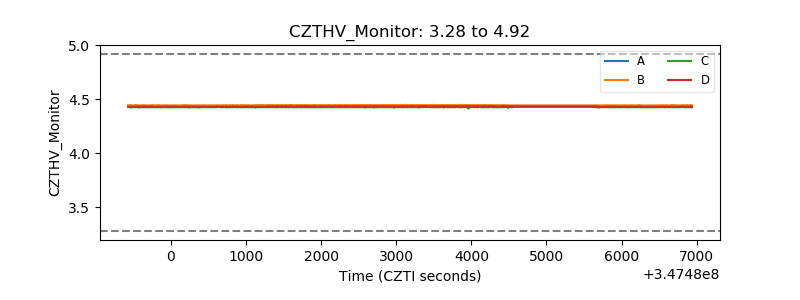 |
| D_VDD |  |
| Temperature 1 |  |
| Veto HV Monitor | 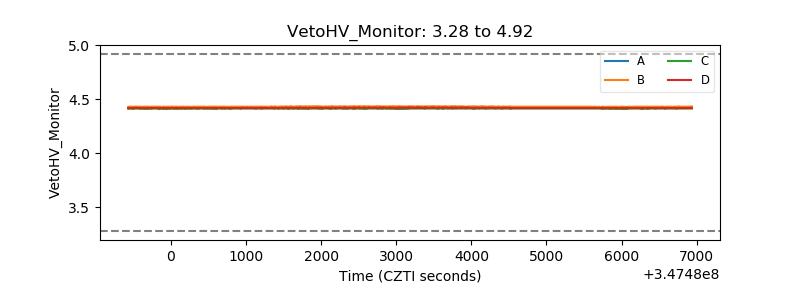 |
| Veto LLD |  |
| Alpha Counter | 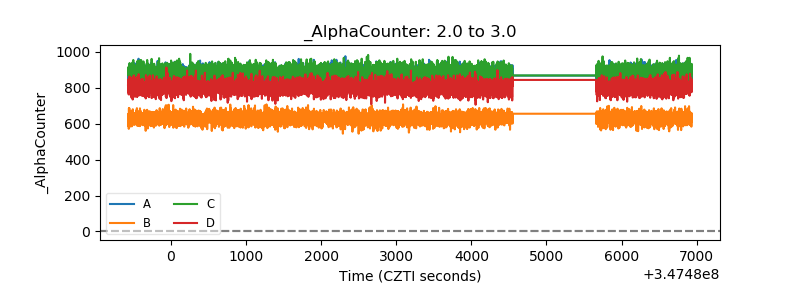 |
| _CPM_Rate | 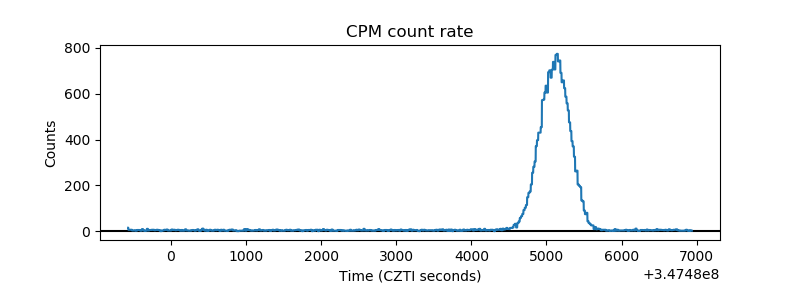 |
| CZT Counter | 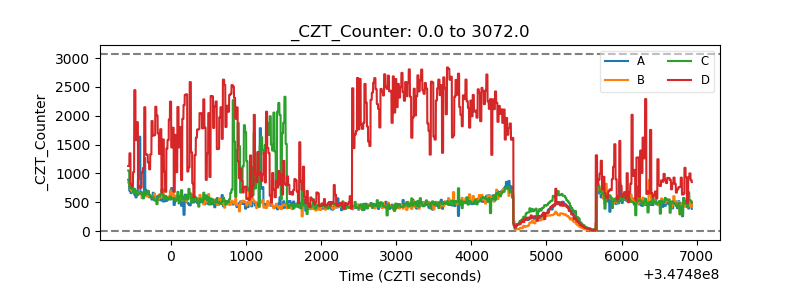 |
| +2.5 Volts monitor |  |
| +5 Volts monitor |  |
| _ROLL_ROT | 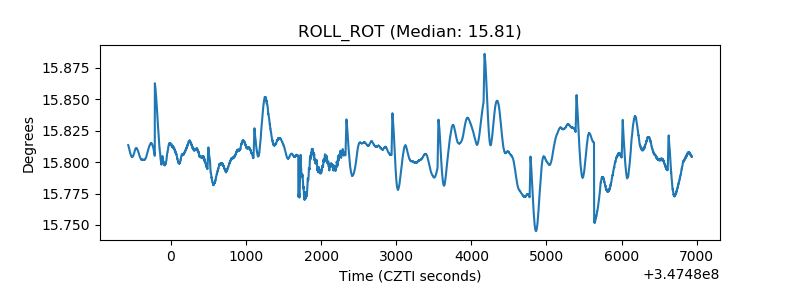 |
| _Roll_DEC | 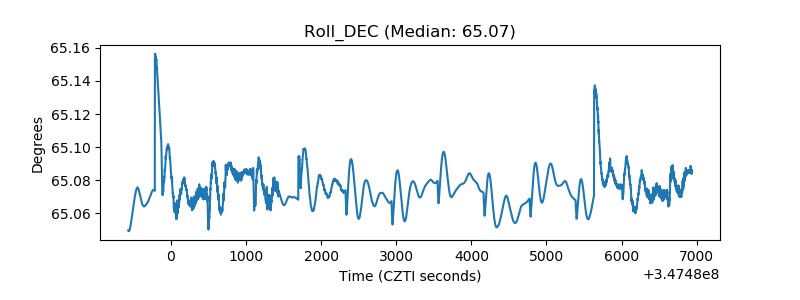 |
| _Roll_RA | 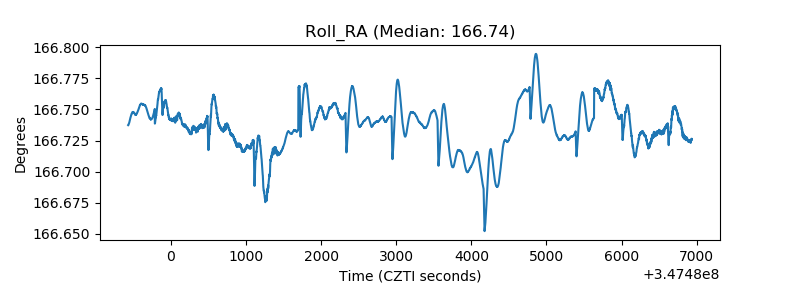 |
| Veto Counter | 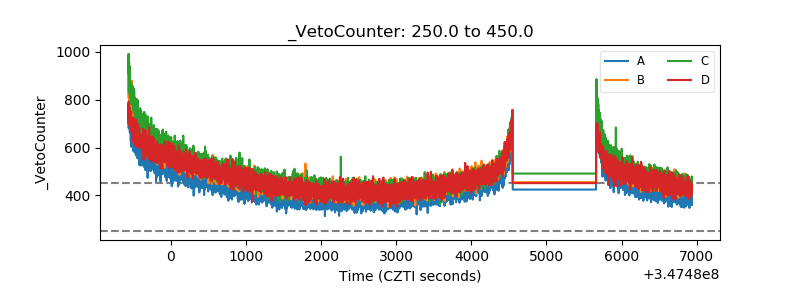 |