| Param | Original file | Final file |
|---|---|---|
| Filename | modeM0/AS1A10_110T05_9000004098_28504cztM0_level2.evt | modeM0/AS1A10_110T05_9000004098_28504cztM0_level2_quad_clean.evt |
| Size (bytes) | 572,276,160 | 117,679,680 |
| Size | 545.8 MB | 112.2 MB |
| Events in quadrant A | 3,245,872 | 785,801 |
| Events in quadrant B | 3,465,662 | 802,997 |
| Events in quadrant C | 3,345,285 | 778,319 |
| Events in quadrant D | 6,810,046 | 719,397 |
| Mode M9 | |||
|---|---|---|---|
| Quadrant | BADHDUFLAG | Total packets | Discarded packets |
| A | 0 | 10 | 0 |
| B | 0 | 11 | 0 |
| C | 0 | 11 | 0 |
| D | 0 | 11 | 0 |
| Mode SS | |||
|---|---|---|---|
| Quadrant | BADHDUFLAG | Total packets | Discarded packets |
| A | 0 | 140 | 0 |
| B | 0 | 140 | 0 |
| C | 0 | 140 | 0 |
| D | 0 | 140 | 0 |
| Mode M0 | |||
|---|---|---|---|
| Quadrant | BADHDUFLAG | Total packets | Discarded packets |
| A | 0 | 14176 | 2 |
| B | 0 | 14779 | 2 |
| C | 0 | 14312 | 2 |
| D | 0 | 25027 | 2 |
| Quadrant | Total seconds | Saturated seconds | Saturation percentage |
|---|---|---|---|
| A | 6848 | 35 | 0.511098% |
| B | 6847 | 70 | 1.022346% |
| C | 6847 | 109 | 1.591938% |
| D | 6847 | 1178 | 17.204615% |
Noise dominated data is calculated using 1-second bins in cleaned event files. If a bin has >2000 counts, and if more than 50% of those come from <1% of pixels, then it is considered to be noise-dominated and hence unusable.
| Quadrant | # 1 sec bins | Bins with >0 counts | Bins with >2000 counts | High rate bins dominated by noise | Noise dominated (total time) | Noise dominated (detector-on time) | Marked lightcurve |
|---|---|---|---|---|---|---|---|
| A | 7648 | 6849 | 1 | 1 | 0.01% | 0.01% | 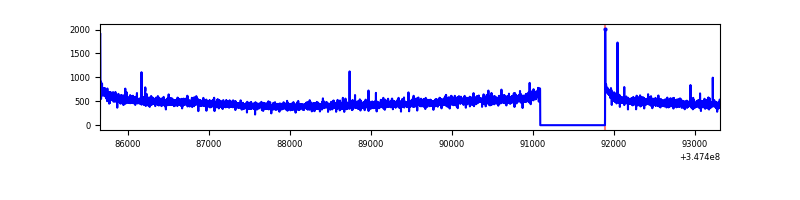 |
| B | 7647 | 6848 | 4 | 4 | 0.05% | 0.06% | 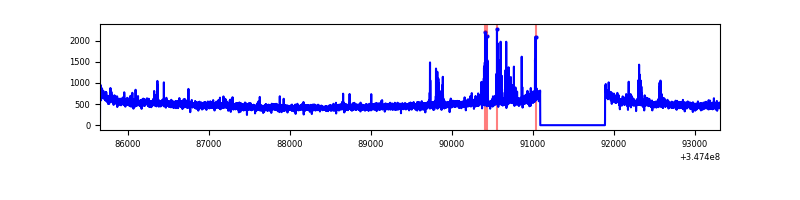 |
| C | 7647 | 6848 | 0 | 0 | 0.00% | 0.00% | 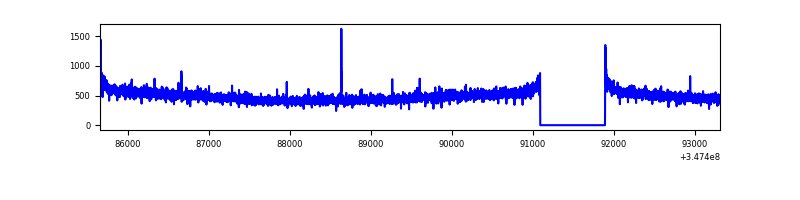 |
| D | 7647 | 6847 | 1028 | 1028 | 13.44% | 15.01% | 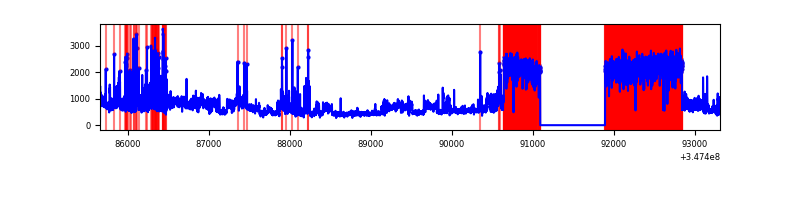 |
Top three noisy pixels from each quadrant. If the there are fewer than three noisy pixels in the level2.evt file, extra rows are filled as -1
| Pixel properties | Quadrant properties | ||||||
|---|---|---|---|---|---|---|---|
| Quadrant | DetID | PixID | Counts | Sigma | Mean | Median | Sigma |
| A | 13 | 254 | 12870 | 73.09 | 831 | 814 | 165.0 |
| A | 12 | 96 | 11934 | 67.41 | 831 | 814 | 165.0 |
| A | 8 | 192 | 10209 | 56.95 | 831 | 814 | 165.0 |
| B | 5 | 255 | 106567 | 682.16 | 832 | 813 | 155.0 |
| B | 0 | 230 | 70421 | 449.0 | 832 | 813 | 155.0 |
| B | 12 | 111 | 18681 | 115.26 | 832 | 813 | 155.0 |
| C | 14 | 238 | 132598 | 705.06 | 809 | 815 | 186.9 |
| C | 3 | 233 | 33374 | 174.2 | 809 | 815 | 186.9 |
| C | 7 | 247 | 10294 | 50.71 | 809 | 815 | 186.9 |
| D | 8 | 195 | 2336053 | 12707.83 | 774 | 754 | 183.8 |
| D | 1 | 52 | 1310728 | 7128.39 | 774 | 754 | 183.8 |
| D | 2 | 250 | 60308 | 324.07 | 774 | 754 | 183.8 |
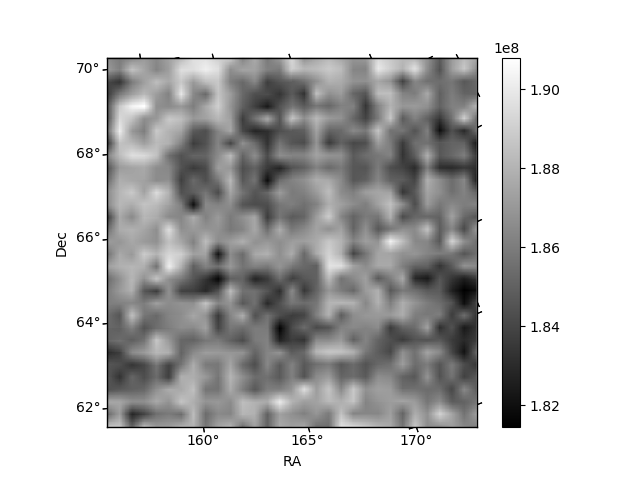
Histogram calculated using DETX and DETY for each event in the final _common_clean file
| Quadrant A |  |
 |
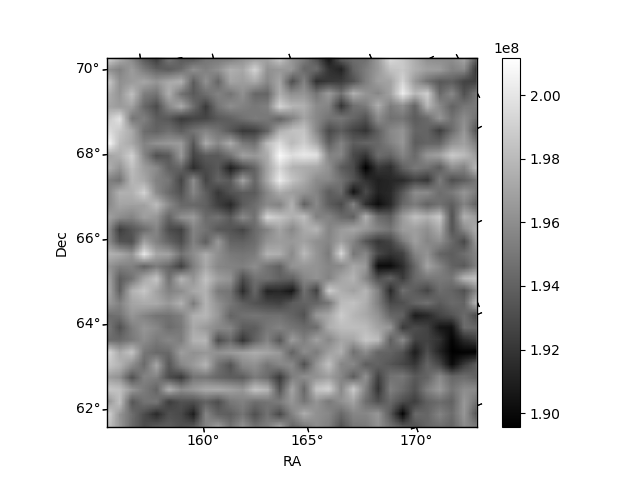
Quadrant B |
|---|---|---|---|
| Quadrant D | 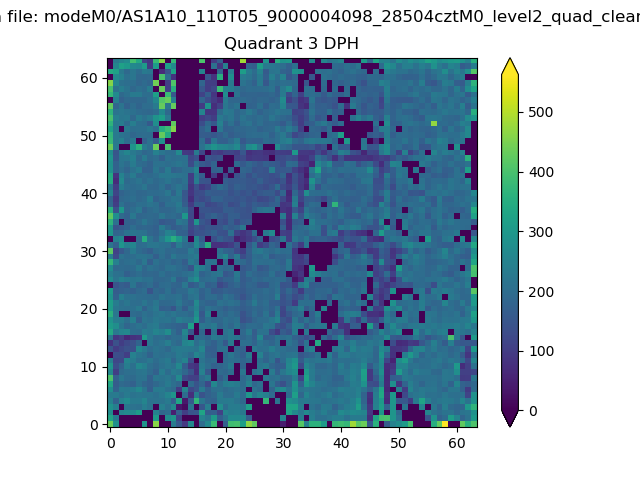 |
 |
Quadrant C |
| Plot type | Count rate plots | Images |
|---|---|---|
| Comparison with Poisson distribution Blue bars denote a histogram of data divided into 1 sec bins. Red curve is a Poisson curve with rate = median count rate of data. |
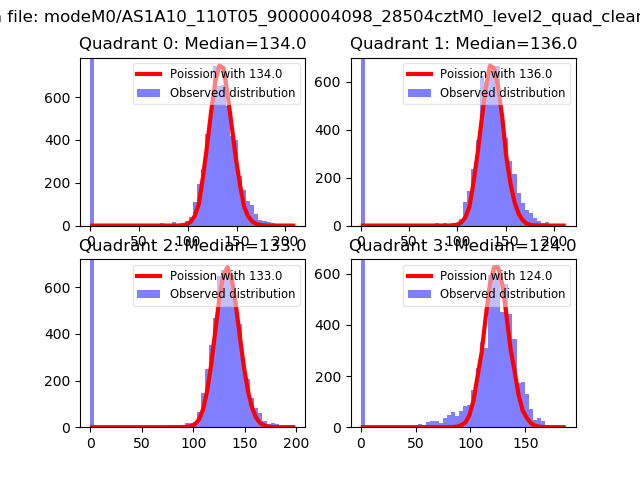 |
 |
| Quadrant-wise count rates Data is divided into 100 sec bins |
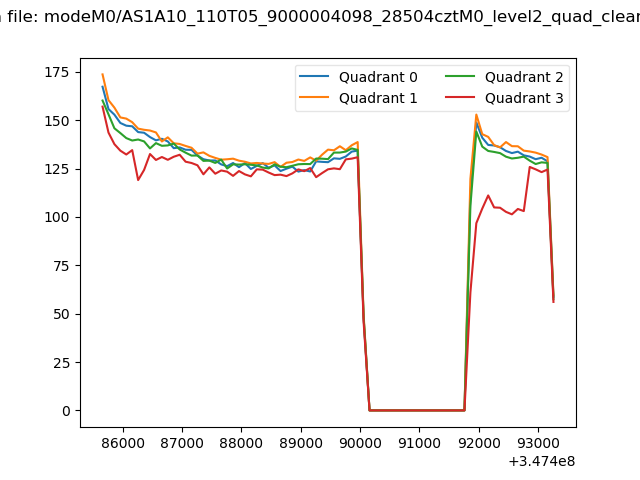 |
|
| Module-wise count rates for Quadrant A Data is divided into 100 sec bins |
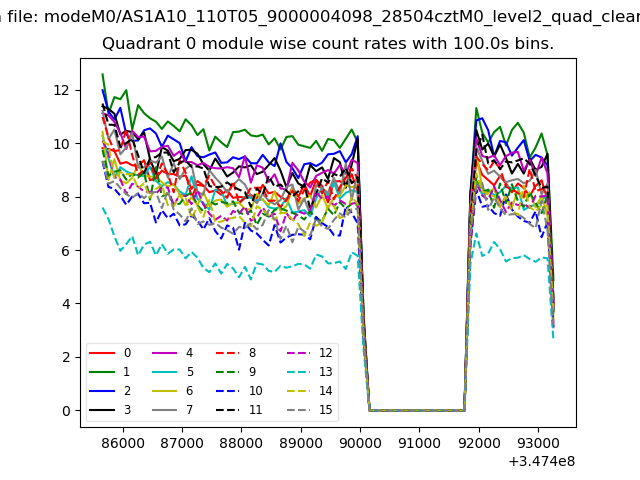 |
 |
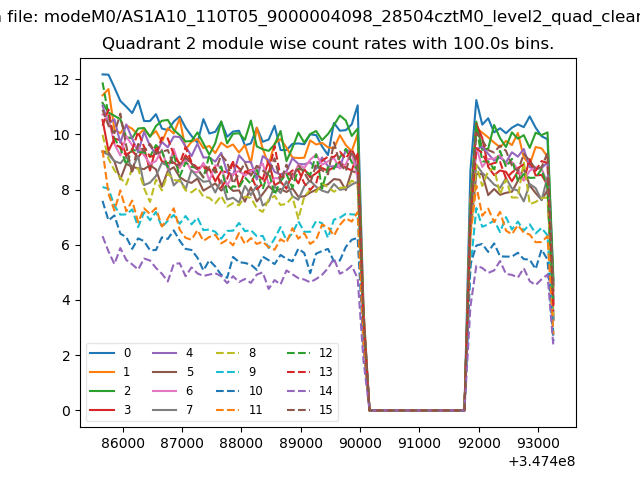
| Module-wise count rates for Quadrant B Data is divided into 100 sec bins |
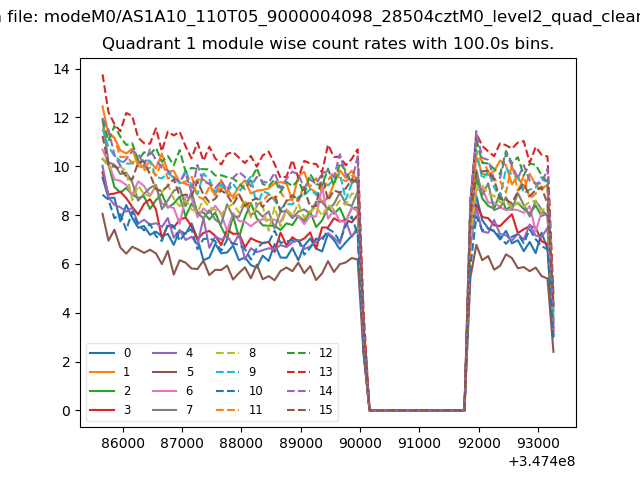 |
 |
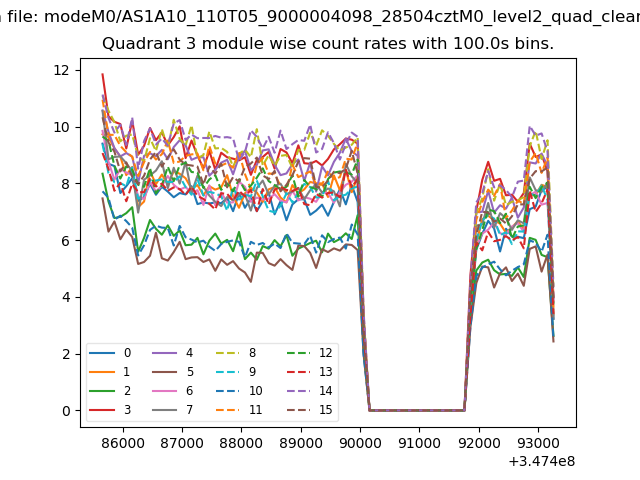
| Module-wise count rates for Quadrant C Data is divided into 100 sec bins |
 |
 |
| Module-wise count rates for Quadrant D Data is divided into 100 sec bins |
 |
 |
| Parameter | Plot |
|---|---|
| CZT HV Monitor |  |
| D_VDD | 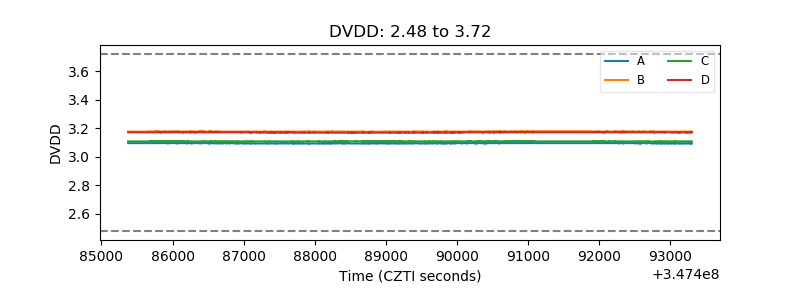 |
| Temperature 1 | 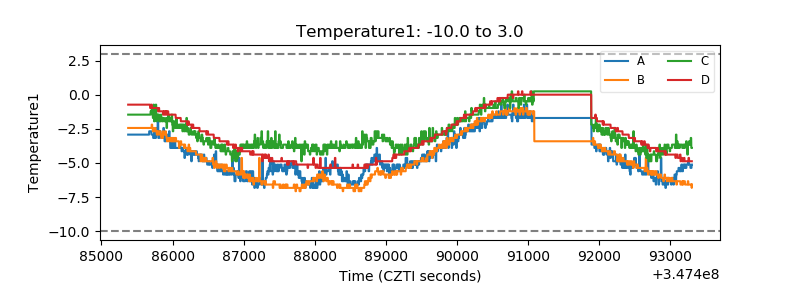 |
| Veto HV Monitor | 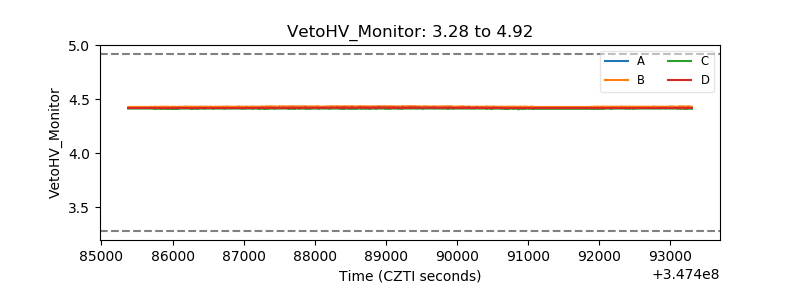 |
| Veto LLD | 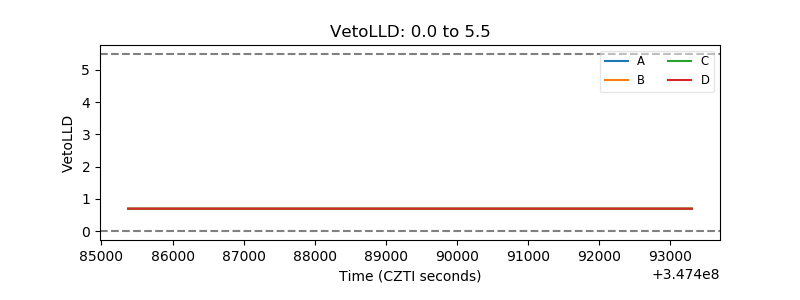 |
| Alpha Counter | 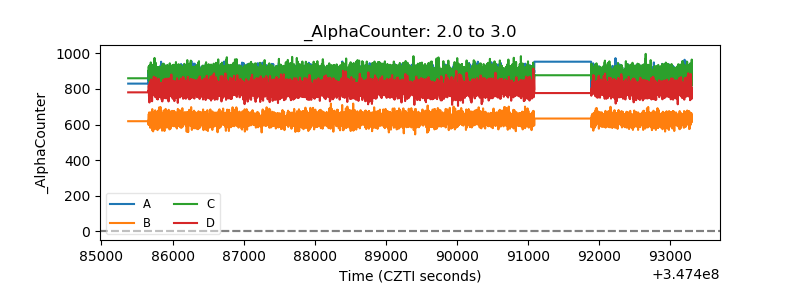 |
| _CPM_Rate | 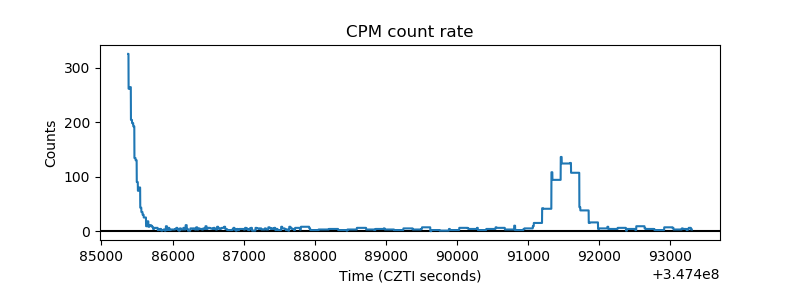 |
| CZT Counter | 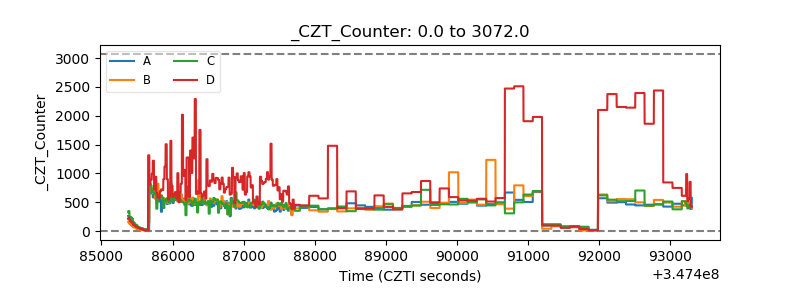 |
| +2.5 Volts monitor |  |
| +5 Volts monitor |  |
| _ROLL_ROT | 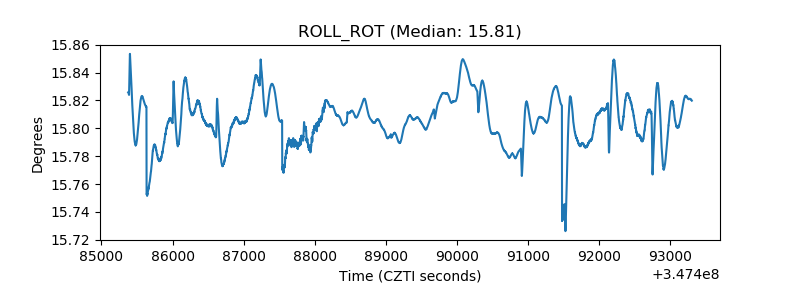 |
| _Roll_DEC | 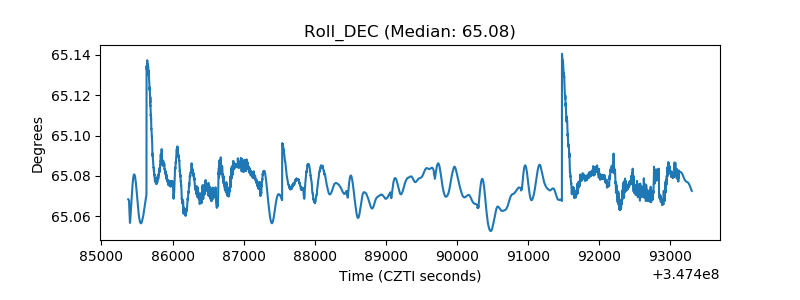 |
| _Roll_RA | 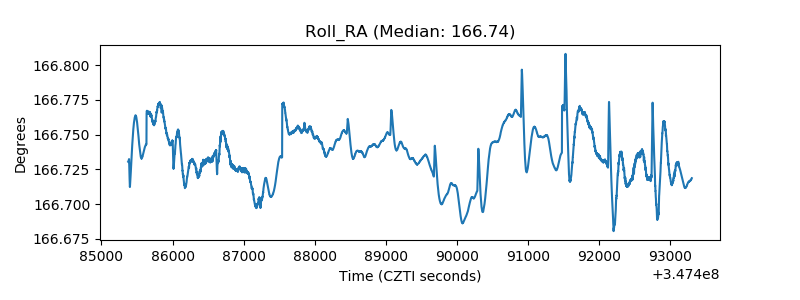 |
| Veto Counter | 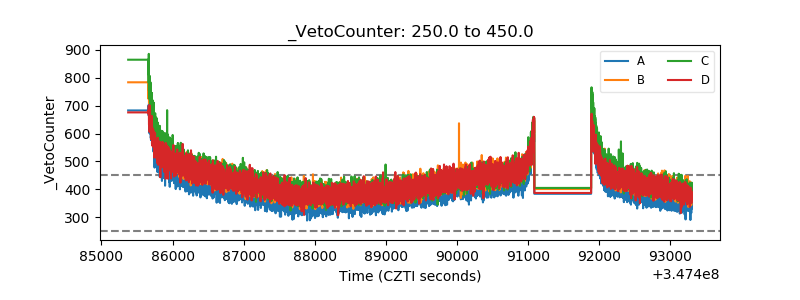 |