| Param | Original file | Final file |
|---|---|---|
| Filename | modeM0/AS1A10_110T05_9000004098_28505cztM0_level2.evt | modeM0/AS1A10_110T05_9000004098_28505cztM0_level2_quad_clean.evt |
| Size (bytes) | 600,145,920 | 118,831,680 |
| Size | 572.3 MB | 113.3 MB |
| Events in quadrant A | 3,487,562 | 787,072 |
| Events in quadrant B | 3,598,473 | 805,758 |
| Events in quadrant C | 3,571,558 | 778,110 |
| Events in quadrant D | 7,019,299 | 715,916 |
| Mode M9 | |||
|---|---|---|---|
| Quadrant | BADHDUFLAG | Total packets | Discarded packets |
| A | 0 | 7 | 0 |
| B | 0 | 8 | 0 |
| C | 0 | 8 | 0 |
| D | 0 | 8 | 0 |
| Mode SS | |||
|---|---|---|---|
| Quadrant | BADHDUFLAG | Total packets | Discarded packets |
| A | 0 | 148 | 0 |
| B | 0 | 148 | 0 |
| C | 0 | 148 | 0 |
| D | 0 | 148 | 0 |
| Mode M0 | |||
|---|---|---|---|
| Quadrant | BADHDUFLAG | Total packets | Discarded packets |
| A | 0 | 15401 | 2 |
| B | 0 | 15634 | 2 |
| C | 0 | 15486 | 3 |
| D | 0 | 25998 | 2 |
| Quadrant | Total seconds | Saturated seconds | Saturation percentage |
|---|---|---|---|
| A | 7358 | 40 | 0.543626% |
| B | 7358 | 76 | 1.032889% |
| C | 7357 | 140 | 1.902950% |
| D | 7357 | 958 | 13.021612% |
Noise dominated data is calculated using 1-second bins in cleaned event files. If a bin has >2000 counts, and if more than 50% of those come from <1% of pixels, then it is considered to be noise-dominated and hence unusable.
| Quadrant | # 1 sec bins | Bins with >0 counts | Bins with >2000 counts | High rate bins dominated by noise | Noise dominated (total time) | Noise dominated (detector-on time) | Marked lightcurve |
|---|---|---|---|---|---|---|---|
| A | 7763 | 7359 | 4 | 4 | 0.05% | 0.05% | 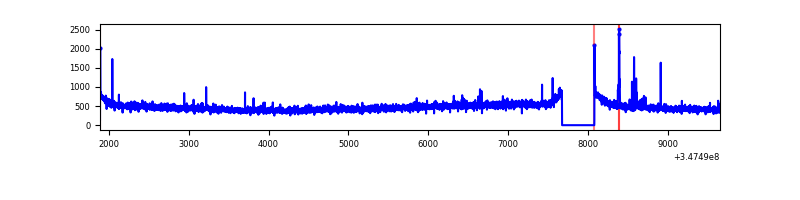 |
| B | 7763 | 7359 | 3 | 3 | 0.04% | 0.04% | 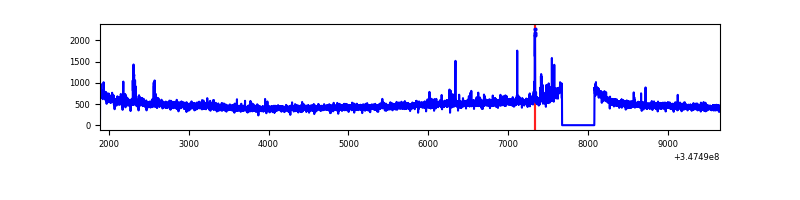 |
| C | 7762 | 7358 | 2 | 2 | 0.03% | 0.03% | 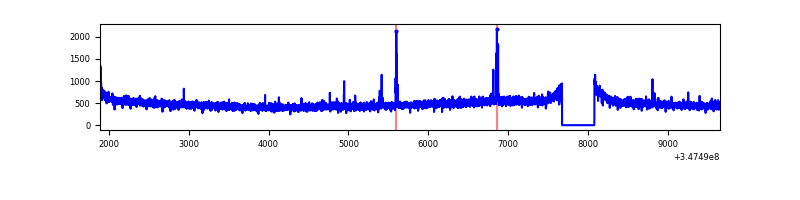 |
| D | 7762 | 7358 | 864 | 864 | 11.13% | 11.74% | 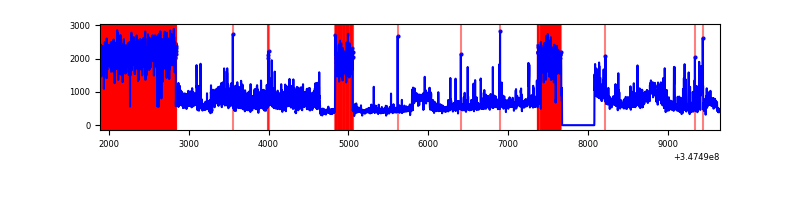 |
Top three noisy pixels from each quadrant. If the there are fewer than three noisy pixels in the level2.evt file, extra rows are filled as -1
| Pixel properties | Quadrant properties | ||||||
|---|---|---|---|---|---|---|---|
| Quadrant | DetID | PixID | Counts | Sigma | Mean | Median | Sigma |
| A | 12 | 96 | 34321 | 189.4 | 882 | 863 | 176.6 |
| A | 15 | 174 | 26795 | 146.8 | 882 | 863 | 176.6 |
| A | 13 | 254 | 12832 | 67.76 | 882 | 863 | 176.6 |
| B | 0 | 230 | 79315 | 469.05 | 884 | 859 | 167.3 |
| B | 5 | 255 | 22581 | 129.86 | 884 | 859 | 167.3 |
| B | 12 | 111 | 20849 | 119.51 | 884 | 859 | 167.3 |
| C | 14 | 238 | 138584 | 688.62 | 858 | 862 | 200.0 |
| C | 3 | 233 | 33419 | 162.79 | 858 | 862 | 200.0 |
| C | 7 | 247 | 29575 | 143.57 | 858 | 862 | 200.0 |
| D | 8 | 195 | 2441420 | 12378.18 | 830 | 810 | 197.2 |
| D | 1 | 52 | 1198374 | 6073.76 | 830 | 810 | 197.2 |
| D | 2 | 250 | 56611 | 283.01 | 830 | 810 | 197.2 |
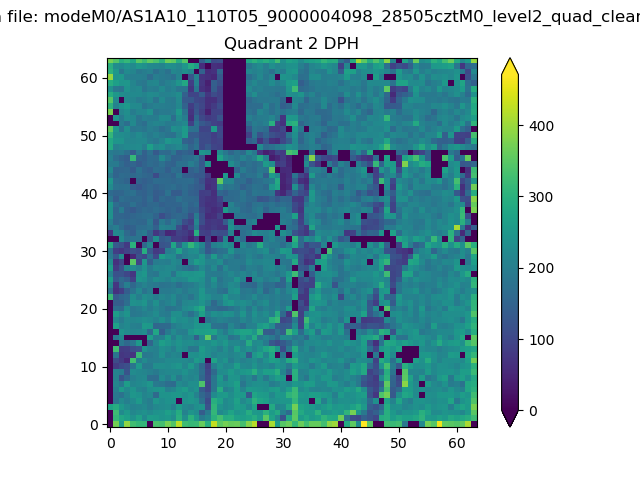
Histogram calculated using DETX and DETY for each event in the final _common_clean file
| Quadrant A | 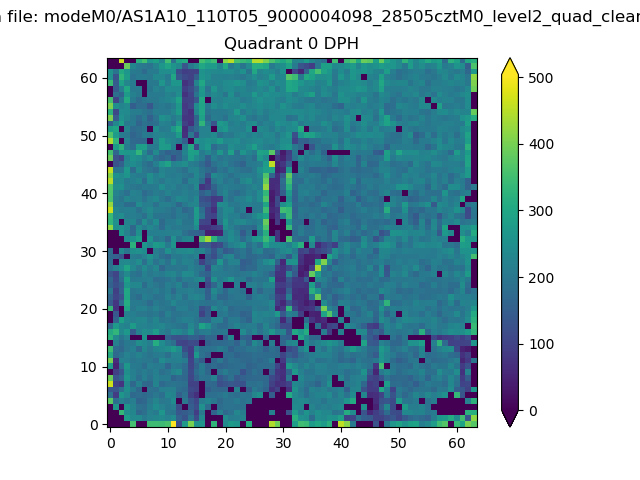 |
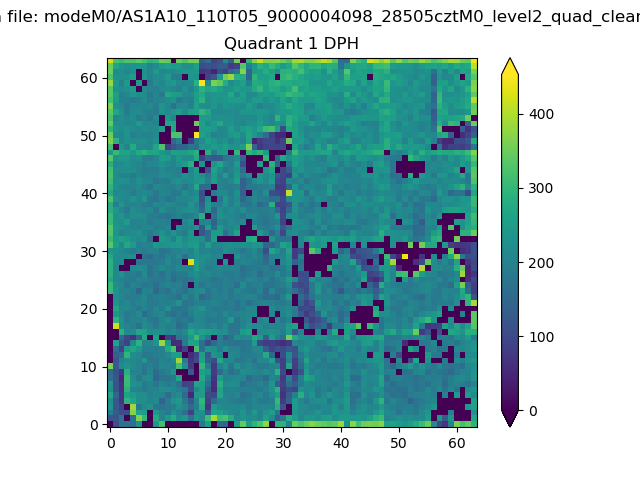 |
Quadrant B |
|---|---|---|---|
| Quadrant D | 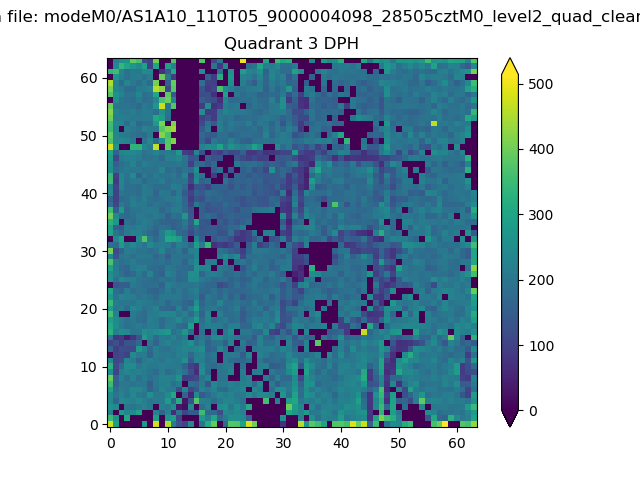 |
 |
Quadrant C |
| Plot type | Count rate plots | Images |
|---|---|---|
| Comparison with Poisson distribution Blue bars denote a histogram of data divided into 1 sec bins. Red curve is a Poisson curve with rate = median count rate of data. |
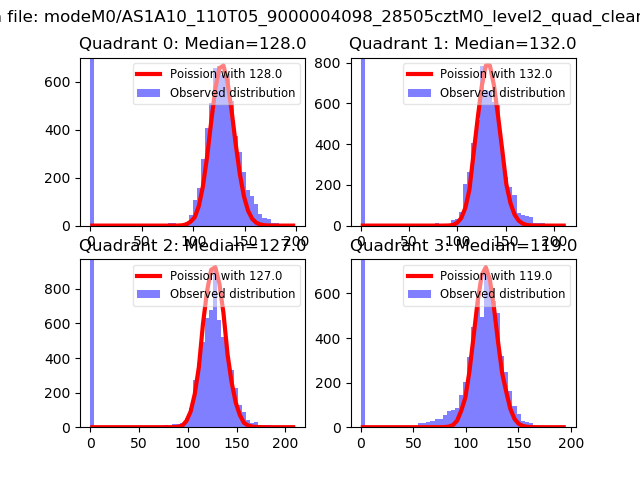 |
 |
| Quadrant-wise count rates Data is divided into 100 sec bins |
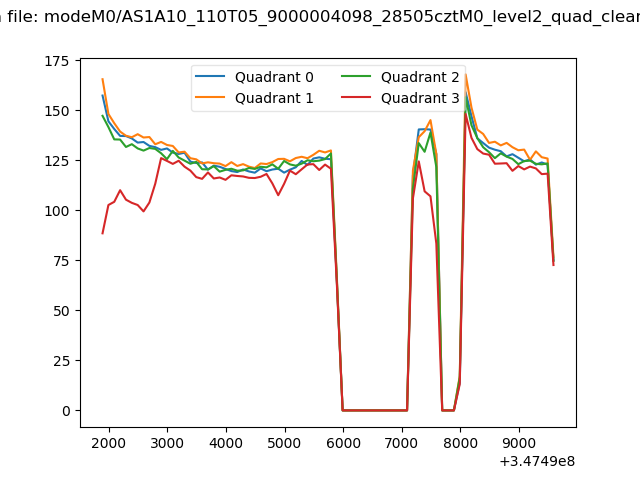 |
|
| Module-wise count rates for Quadrant A Data is divided into 100 sec bins |
 |
 |
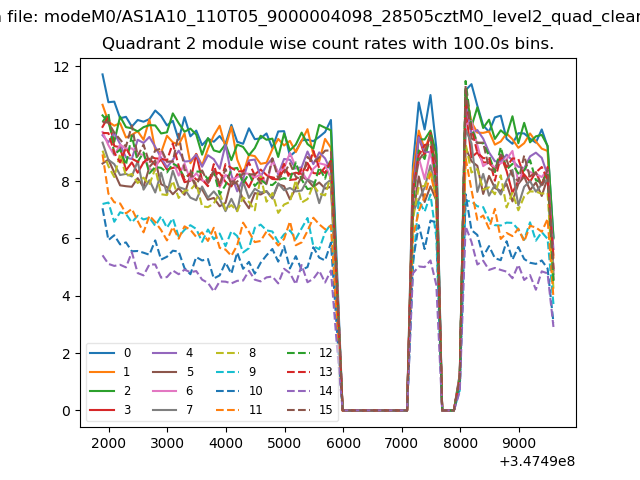
| Module-wise count rates for Quadrant B Data is divided into 100 sec bins |
 |
 |
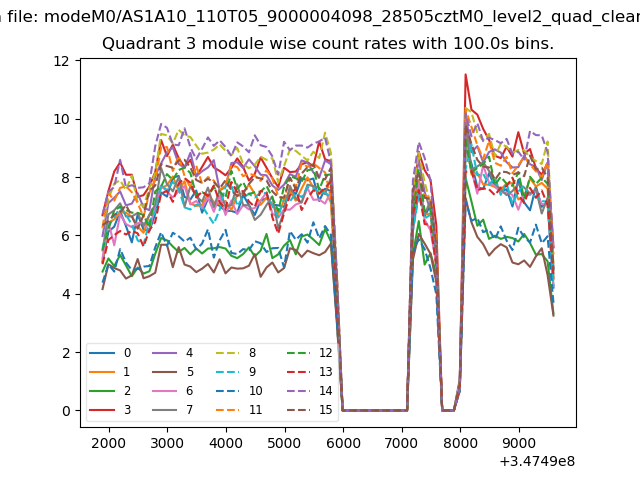
| Module-wise count rates for Quadrant C Data is divided into 100 sec bins |
 |
 |
| Module-wise count rates for Quadrant D Data is divided into 100 sec bins |
 |
 |
| Parameter | Plot |
|---|---|
| CZT HV Monitor | 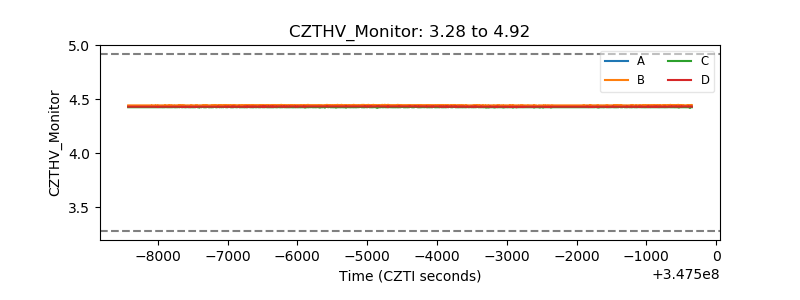 |
| D_VDD | 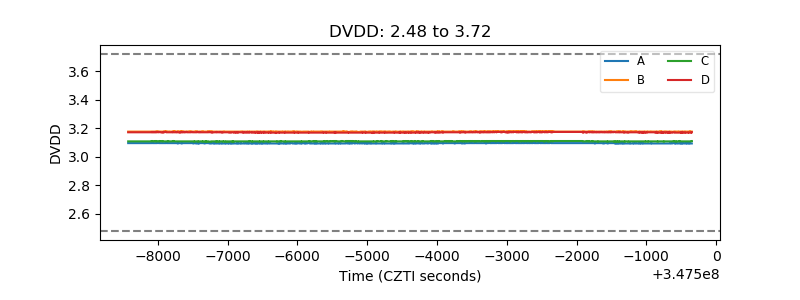 |
| Temperature 1 | 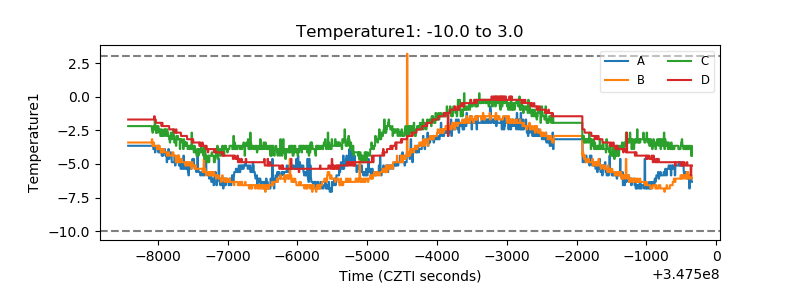 |
| Veto HV Monitor | 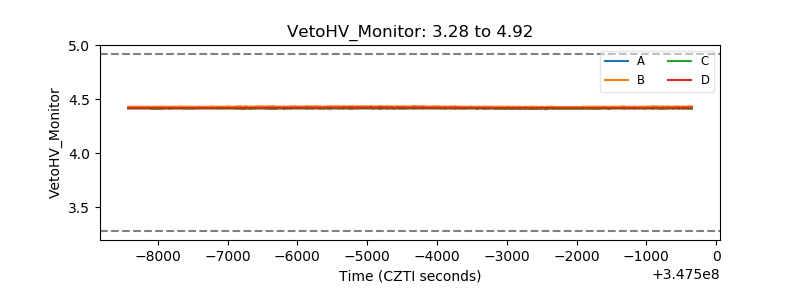 |
| Veto LLD | 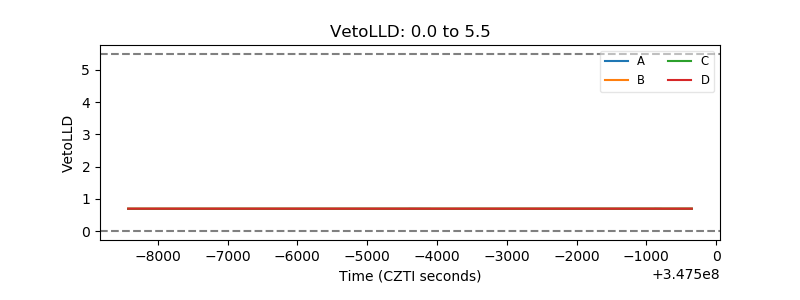 |
| Alpha Counter | 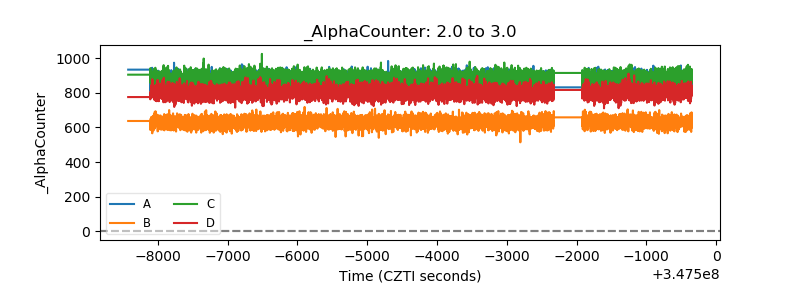 |
| _CPM_Rate | 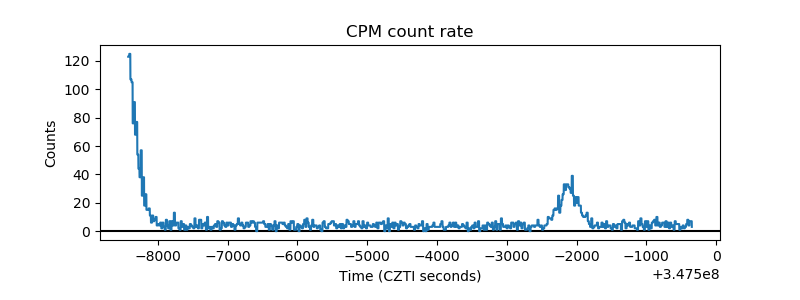 |
| CZT Counter | 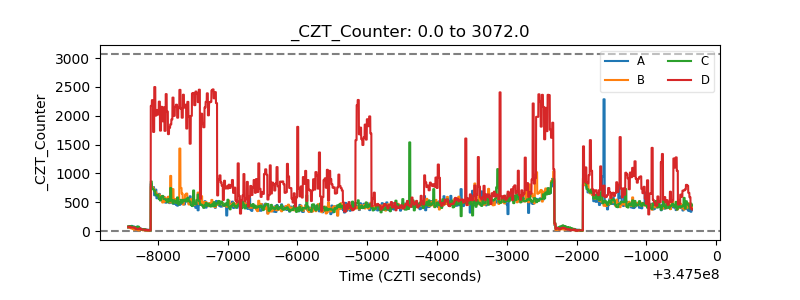 |
| +2.5 Volts monitor | 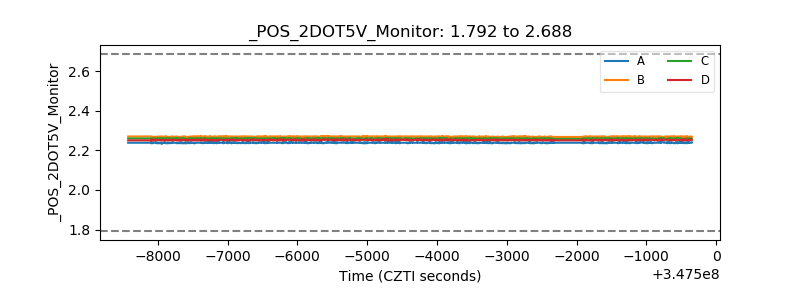 |
| +5 Volts monitor |  |
| _ROLL_ROT | 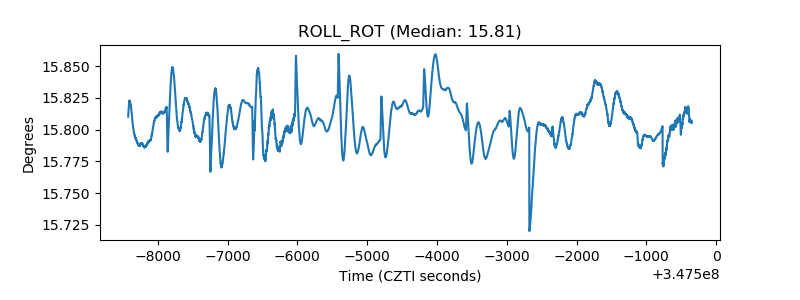 |
| _Roll_DEC | 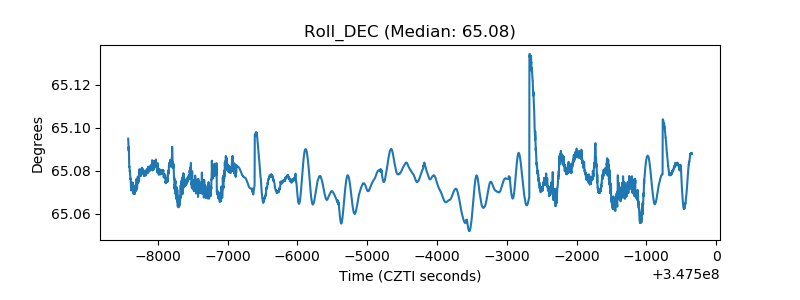 |
| _Roll_RA | 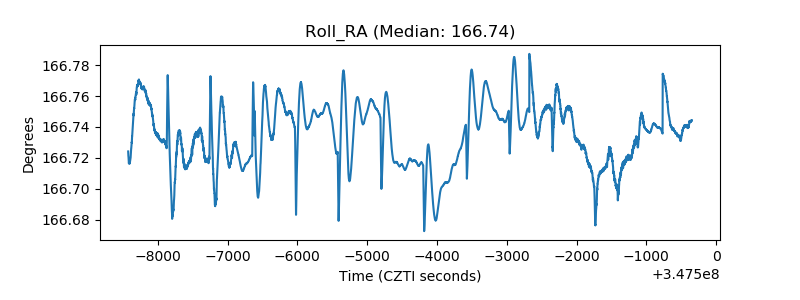 |
| Veto Counter |  |