| Param | Original file | Final file |
|---|---|---|
| Filename | modeM0/AS1A10_110T05_9000004098_28509cztM0_level2.evt | modeM0/AS1A10_110T05_9000004098_28509cztM0_level2_quad_clean.evt |
| Size (bytes) | 1,004,477,760 | 204,511,680 |
| Size | 957.9 MB | 195.0 MB |
| Events in quadrant A | 6,012,100 | 1,345,340 |
| Events in quadrant B | 6,156,045 | 1,372,808 |
| Events in quadrant C | 6,430,644 | 1,319,059 |
| Events in quadrant D | 10,929,868 | 1,245,513 |
| Mode M9 | |||
|---|---|---|---|
| Quadrant | BADHDUFLAG | Total packets | Discarded packets |
| A | 0 | 17 | 0 |
| B | 0 | 17 | 0 |
| C | 0 | 17 | 0 |
| D | 0 | 17 | 0 |
| Mode SS | |||
|---|---|---|---|
| Quadrant | BADHDUFLAG | Total packets | Discarded packets |
| A | 0 | 270 | 0 |
| B | 0 | 270 | 0 |
| C | 0 | 270 | 0 |
| D | 0 | 270 | 0 |
| Mode M0 | |||
|---|---|---|---|
| Quadrant | BADHDUFLAG | Total packets | Discarded packets |
| A | 0 | 26790 | 3 |
| B | 0 | 26980 | 3 |
| C | 0 | 27606 | 3 |
| D | 0 | 41643 | 3 |
| Quadrant | Total seconds | Saturated seconds | Saturation percentage |
|---|---|---|---|
| A | 13190 | 61 | 0.462472% |
| B | 13191 | 93 | 0.705026% |
| C | 13191 | 215 | 1.629899% |
| D | 13191 | 1065 | 8.073687% |
Noise dominated data is calculated using 1-second bins in cleaned event files. If a bin has >2000 counts, and if more than 50% of those come from <1% of pixels, then it is considered to be noise-dominated and hence unusable.
| Quadrant | # 1 sec bins | Bins with >0 counts | Bins with >2000 counts | High rate bins dominated by noise | Noise dominated (total time) | Noise dominated (detector-on time) | Marked lightcurve |
|---|---|---|---|---|---|---|---|
| A | 14930 | 13192 | 0 | 0 | 0.00% | 0.00% | 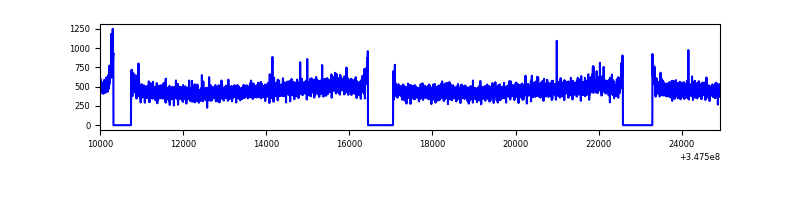 |
| B | 14931 | 13192 | 9 | 9 | 0.06% | 0.07% |  |
| C | 14931 | 13192 | 1 | 1 | 0.01% | 0.01% | 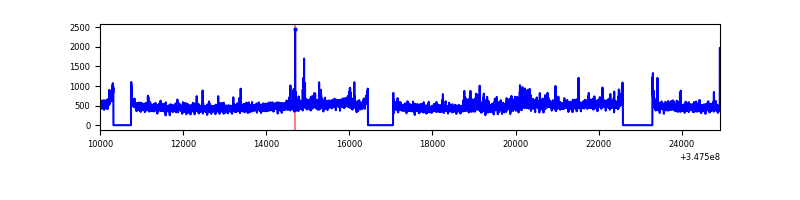 |
| D | 14931 | 13193 | 859 | 859 | 5.75% | 6.51% | 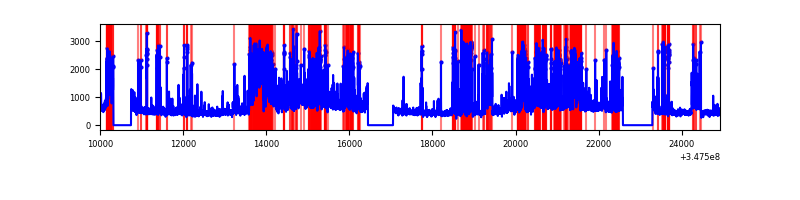 |
Top three noisy pixels from each quadrant. If the there are fewer than three noisy pixels in the level2.evt file, extra rows are filled as -1
| Pixel properties | Quadrant properties | ||||||
|---|---|---|---|---|---|---|---|
| Quadrant | DetID | PixID | Counts | Sigma | Mean | Median | Sigma |
| A | 13 | 254 | 21274 | 63.33 | 1553 | 1516 | 312.0 |
| A | 3 | 137 | 15782 | 45.73 | 1553 | 1516 | 312.0 |
| A | 0 | 226 | 13086 | 37.09 | 1553 | 1516 | 312.0 |
| B | 15 | 33 | 42547 | 139.75 | 1544 | 1503 | 293.7 |
| B | 12 | 111 | 37706 | 123.26 | 1544 | 1503 | 293.7 |
| B | 11 | 111 | 33878 | 110.23 | 1544 | 1503 | 293.7 |
| C | 14 | 238 | 326662 | 935.59 | 1488 | 1496 | 347.6 |
| C | 14 | 254 | 125172 | 355.85 | 1488 | 1496 | 347.6 |
| C | 3 | 233 | 83710 | 236.55 | 1488 | 1496 | 347.6 |
| D | 1 | 52 | 2478402 | 7191.2 | 1454 | 1413 | 344.4 |
| D | 8 | 195 | 1836053 | 5326.33 | 1454 | 1413 | 344.4 |
| D | 12 | 233 | 774993 | 2245.86 | 1454 | 1413 | 344.4 |
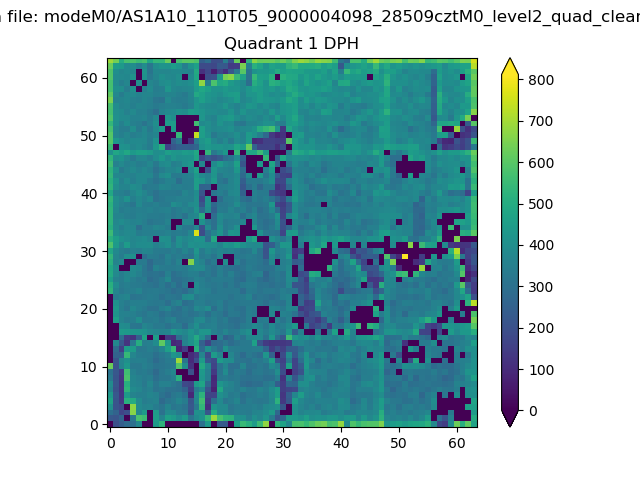
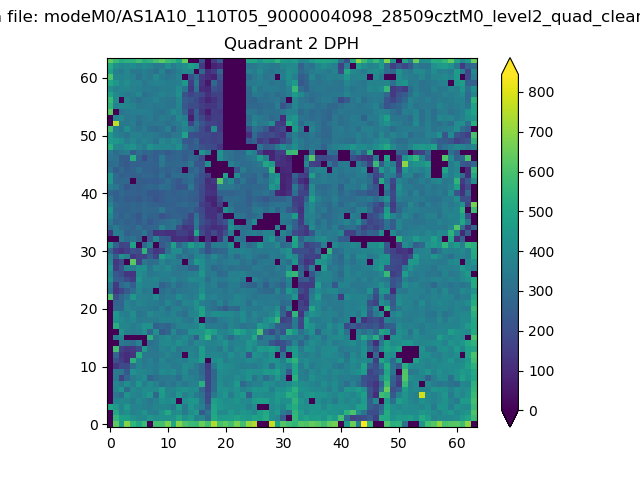
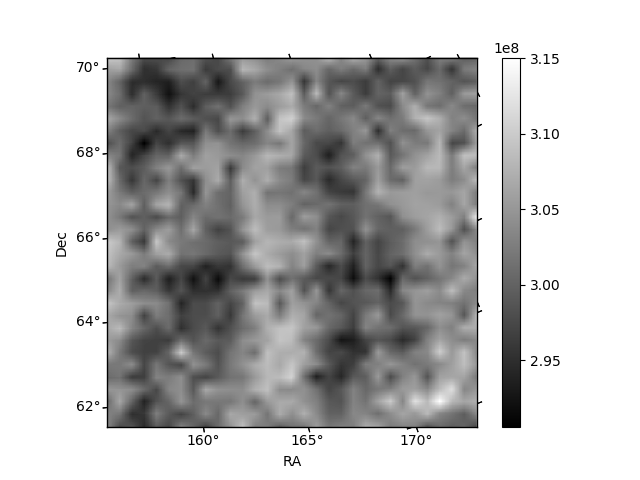
Histogram calculated using DETX and DETY for each event in the final _common_clean file
| Quadrant A | 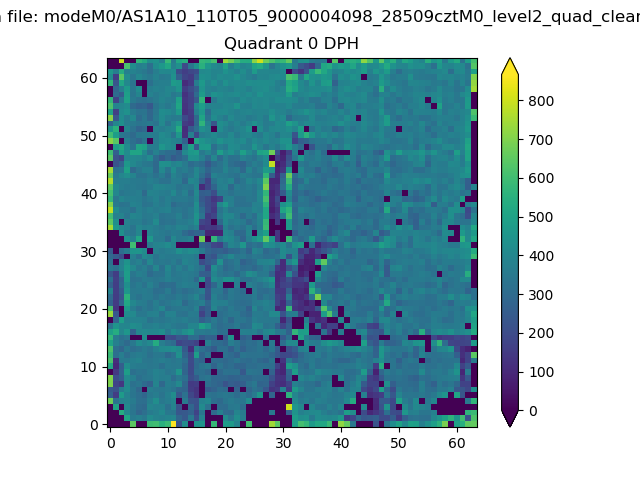 |
 |
Quadrant B |
|---|---|---|---|
| Quadrant D | 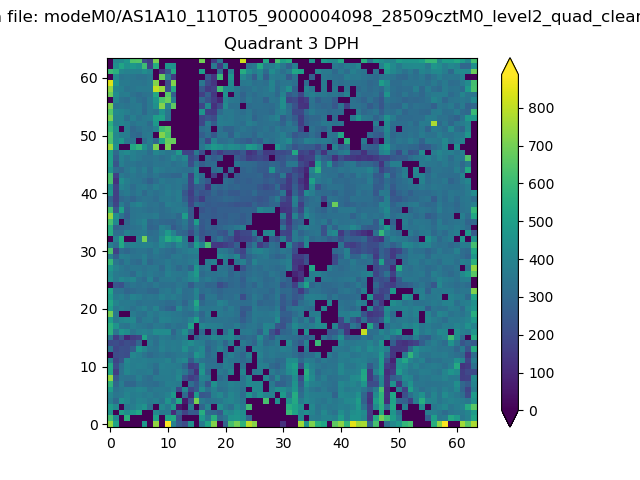 |
 |
Quadrant C |
| Plot type | Count rate plots | Images |
|---|---|---|
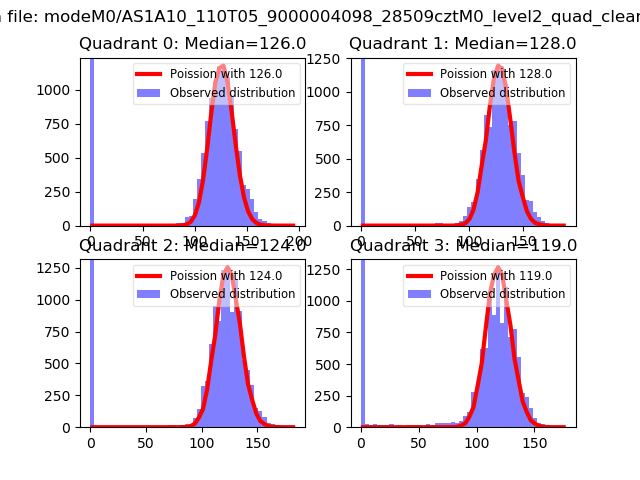
| Comparison with Poisson distribution Blue bars denote a histogram of data divided into 1 sec bins. Red curve is a Poisson curve with rate = median count rate of data. |
 |
 |
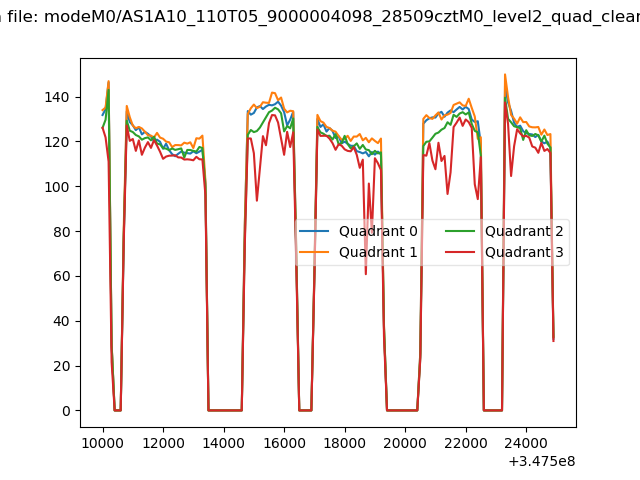
| Quadrant-wise count rates Data is divided into 100 sec bins |
 |
|
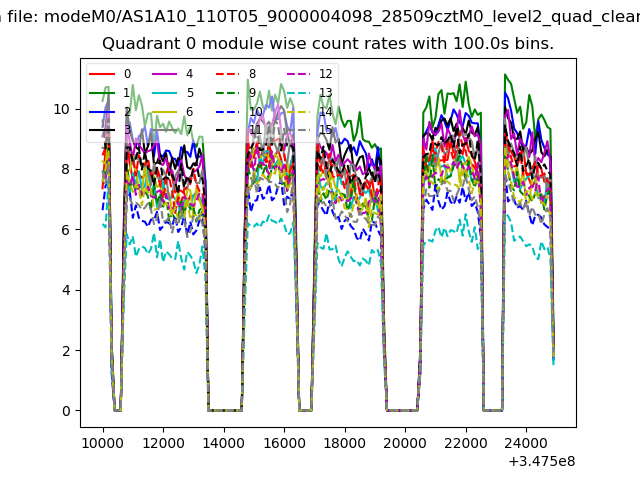
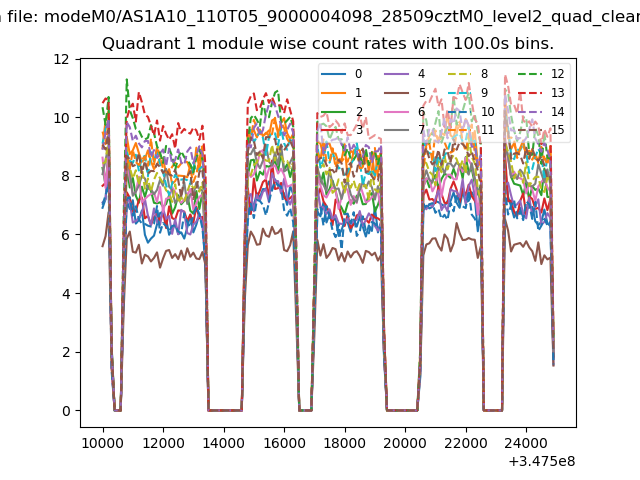
| Module-wise count rates for Quadrant A Data is divided into 100 sec bins |
 |
 |
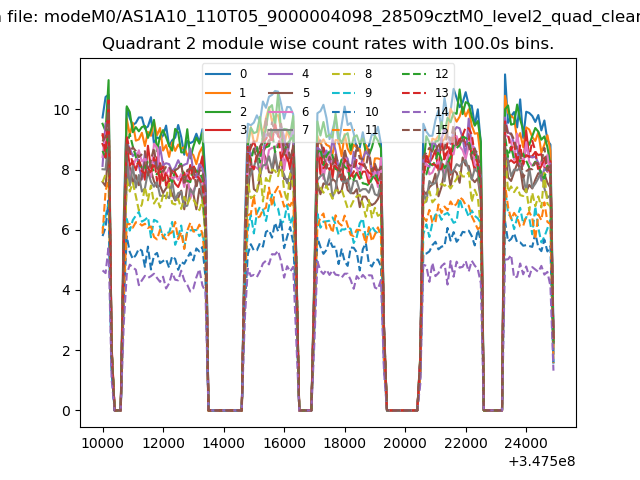
| Module-wise count rates for Quadrant B Data is divided into 100 sec bins |
 |
 |
| Module-wise count rates for Quadrant C Data is divided into 100 sec bins |
 |
 |
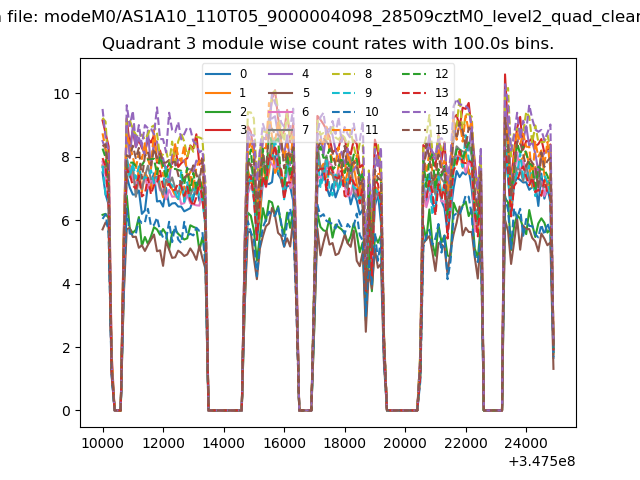
| Module-wise count rates for Quadrant D Data is divided into 100 sec bins |
 |
 |
| Parameter | Plot |
|---|---|
| CZT HV Monitor | 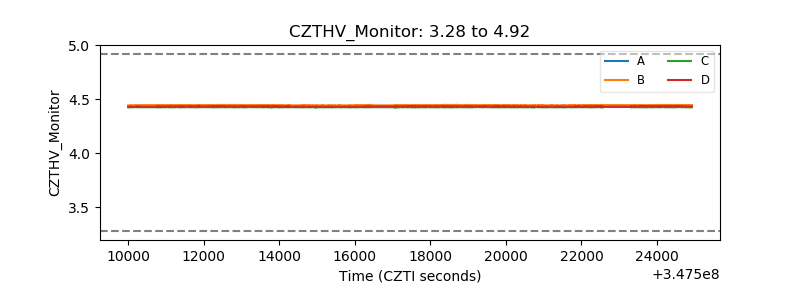 |
| D_VDD |  |
| Temperature 1 | 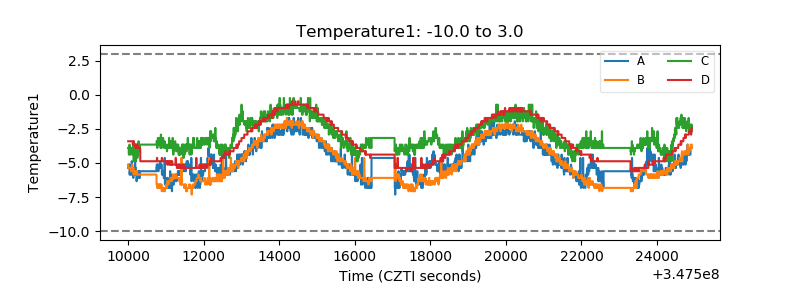 |
| Veto HV Monitor |  |
| Veto LLD | 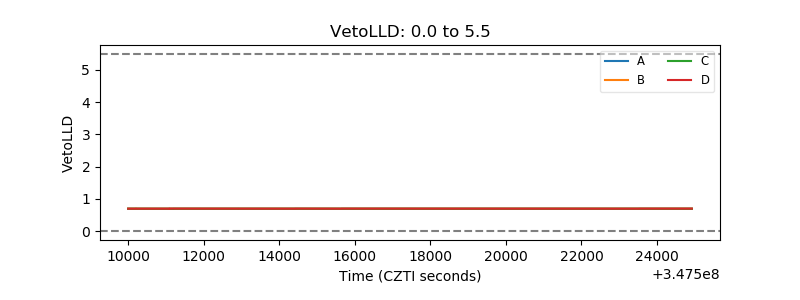 |
| Alpha Counter | 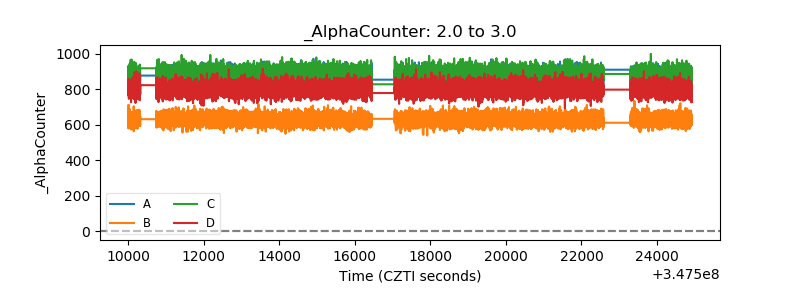 |
| _CPM_Rate | 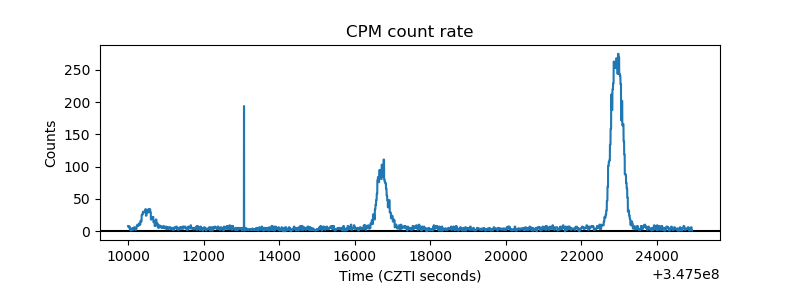 |
| CZT Counter | 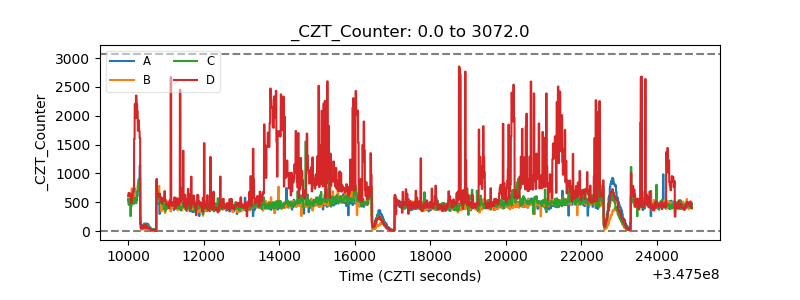 |
| +2.5 Volts monitor |  |
| +5 Volts monitor |  |
| _ROLL_ROT | 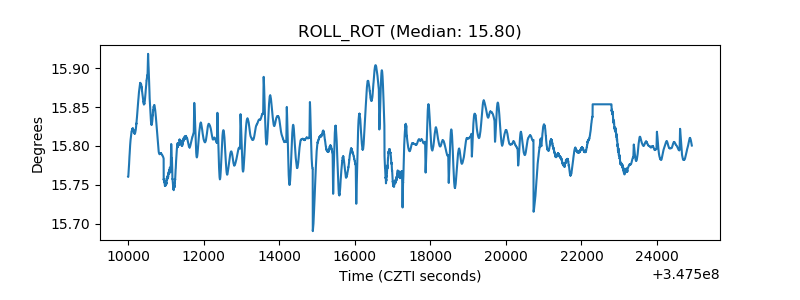 |
| _Roll_DEC | 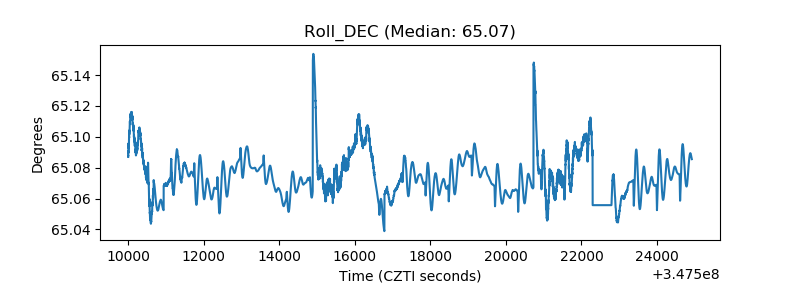 |
| _Roll_RA | 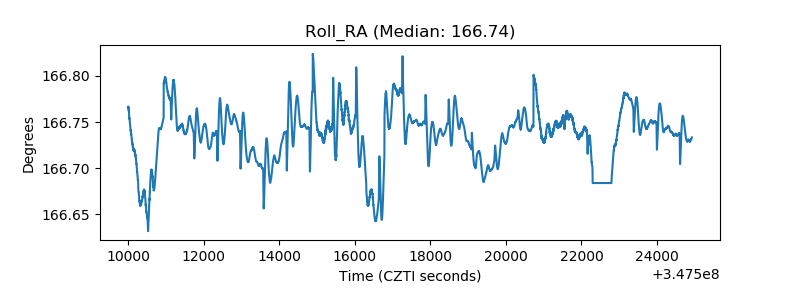 |
| Veto Counter | 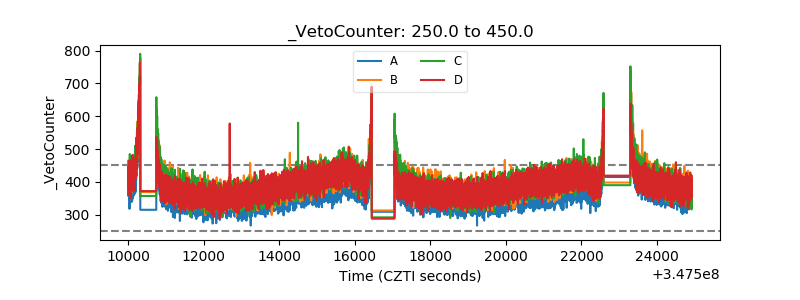 |