| Param | Original file | Final file |
|---|---|---|
| Filename | modeM0/AS1A10_110T05_9000004098_28511cztM0_level2.evt | modeM0/AS1A10_110T05_9000004098_28511cztM0_level2_quad_clean.evt |
| Size (bytes) | 521,107,200 | 91,725,120 |
| Size | 497.0 MB | 87.5 MB |
| Events in quadrant A | 2,977,644 | 610,286 |
| Events in quadrant B | 3,844,394 | 603,947 |
| Events in quadrant C | 2,984,214 | 587,555 |
| Events in quadrant D | 5,557,489 | 545,493 |
| Mode M9 | |||
|---|---|---|---|
| Quadrant | BADHDUFLAG | Total packets | Discarded packets |
| A | 0 | 10 | 0 |
| B | 0 | 10 | 0 |
| C | 0 | 10 | 0 |
| D | 0 | 10 | 0 |
| Mode SS | |||
|---|---|---|---|
| Quadrant | BADHDUFLAG | Total packets | Discarded packets |
| A | 0 | 126 | 0 |
| B | 0 | 126 | 0 |
| C | 0 | 126 | 0 |
| D | 0 | 126 | 0 |
| Mode M0 | |||
|---|---|---|---|
| Quadrant | BADHDUFLAG | Total packets | Discarded packets |
| A | 0 | 12756 | 1 |
| B | 0 | 15241 | 1 |
| C | 0 | 12612 | 1 |
| D | 0 | 20517 | 1 |
| Quadrant | Total seconds | Saturated seconds | Saturation percentage |
|---|---|---|---|
| A | 6159 | 48 | 0.779347% |
| B | 6160 | 243 | 3.944805% |
| C | 6160 | 65 | 1.055195% |
| D | 6160 | 731 | 11.866883% |
Noise dominated data is calculated using 1-second bins in cleaned event files. If a bin has >2000 counts, and if more than 50% of those come from <1% of pixels, then it is considered to be noise-dominated and hence unusable.
| Quadrant | # 1 sec bins | Bins with >0 counts | Bins with >2000 counts | High rate bins dominated by noise | Noise dominated (total time) | Noise dominated (detector-on time) | Marked lightcurve |
|---|---|---|---|---|---|---|---|
| A | 7194 | 6159 | 7 | 7 | 0.10% | 0.11% | 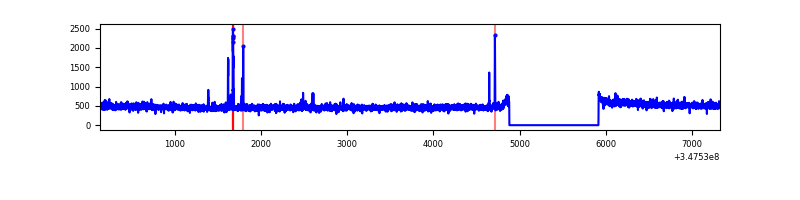 |
| B | 7195 | 6160 | 155 | 155 | 2.15% | 2.52% | 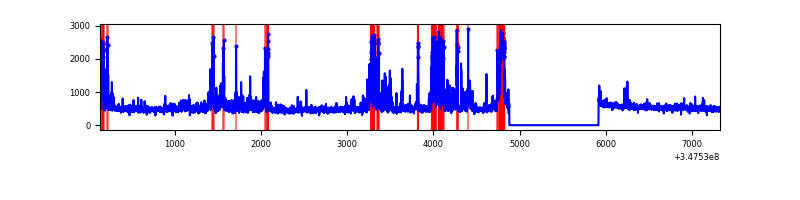 |
| C | 7195 | 6160 | 0 | 0 | 0.00% | 0.00% | 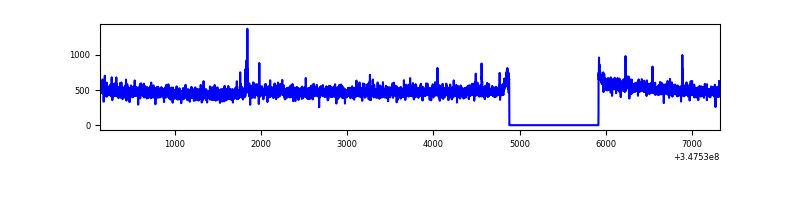 |
| D | 7195 | 6160 | 706 | 706 | 9.81% | 11.46% |  |
Top three noisy pixels from each quadrant. If the there are fewer than three noisy pixels in the level2.evt file, extra rows are filled as -1
| Pixel properties | Quadrant properties | ||||||
|---|---|---|---|---|---|---|---|
| Quadrant | DetID | PixID | Counts | Sigma | Mean | Median | Sigma |
| A | 15 | 174 | 30920 | 197.83 | 758 | 742 | 152.5 |
| A | 12 | 96 | 14118 | 87.68 | 758 | 742 | 152.5 |
| A | 13 | 254 | 10385 | 63.21 | 758 | 742 | 152.5 |
| B | 10 | 245 | 771581 | 5509.59 | 735 | 718 | 139.9 |
| B | 0 | 230 | 99740 | 707.74 | 735 | 718 | 139.9 |
| B | 15 | 33 | 60393 | 426.52 | 735 | 718 | 139.9 |
| C | 14 | 238 | 121256 | 723.48 | 718 | 721 | 166.6 |
| C | 3 | 233 | 53462 | 316.57 | 718 | 721 | 166.6 |
| C | 7 | 247 | 5685 | 29.8 | 718 | 721 | 166.6 |
| D | 1 | 52 | 2068795 | 12519.7 | 690 | 671 | 165.2 |
| D | 8 | 195 | 597135 | 3610.78 | 690 | 671 | 165.2 |
| D | 7 | 238 | 137303 | 827.12 | 690 | 671 | 165.2 |
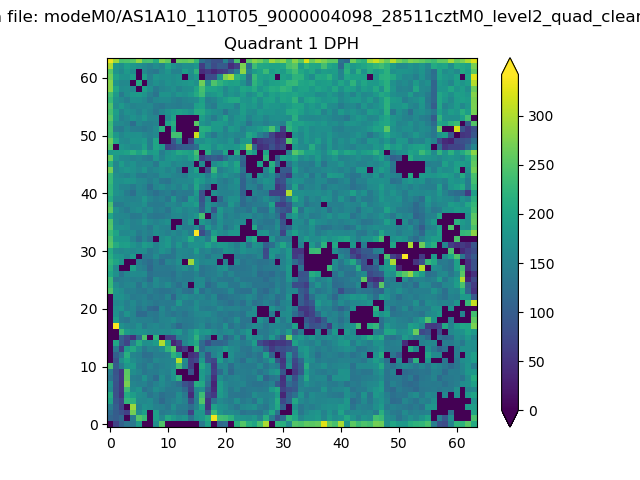
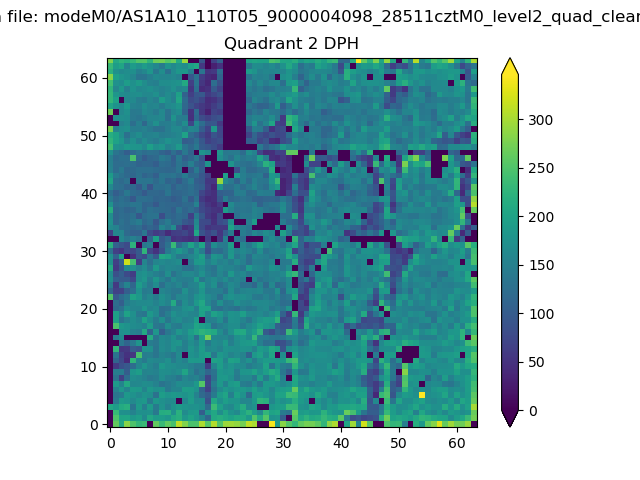
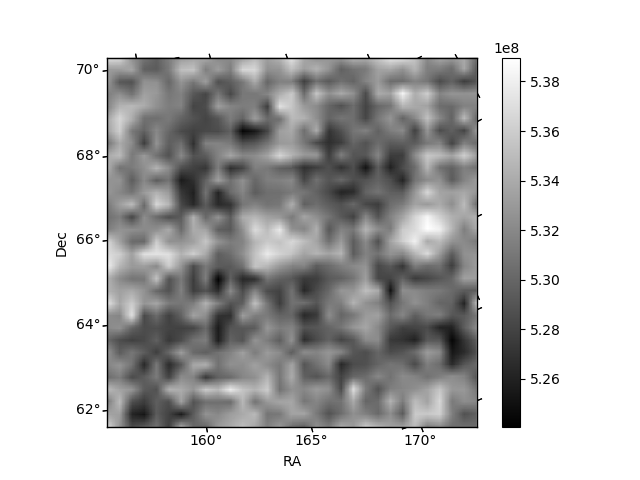
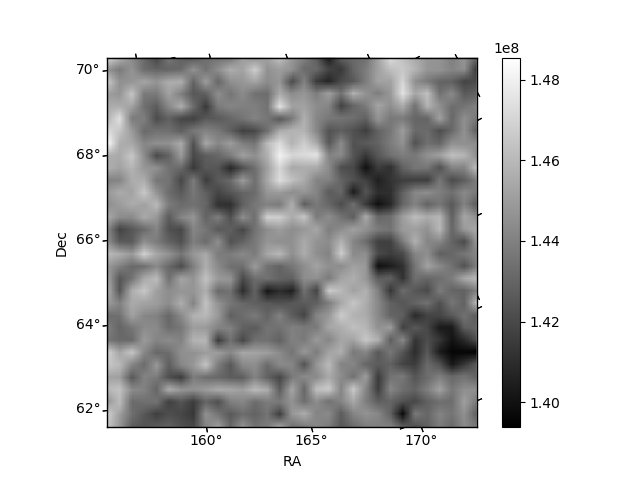
Histogram calculated using DETX and DETY for each event in the final _common_clean file
| Quadrant A | 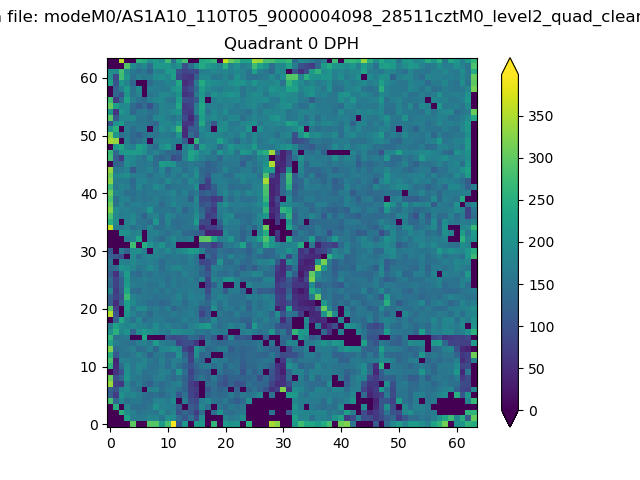 |
 |
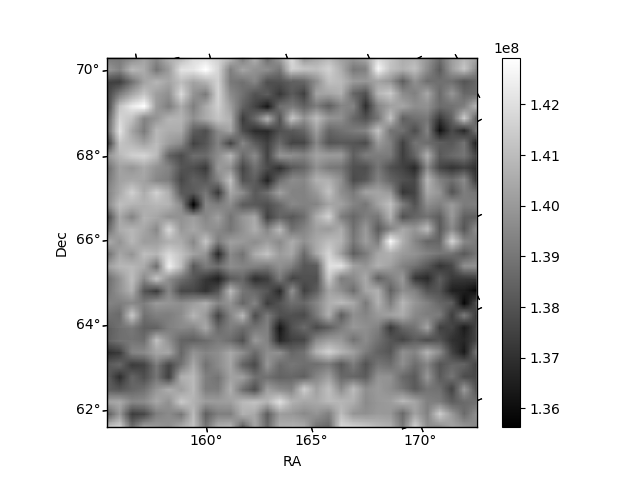
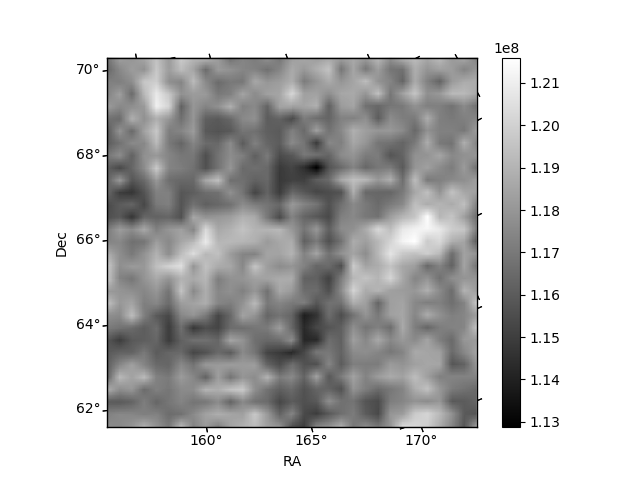
Quadrant B |
|---|---|---|---|
| Quadrant D | 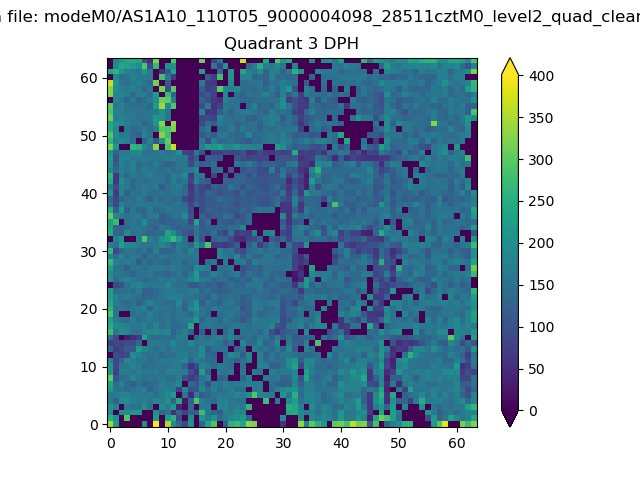 |
 |
Quadrant C |
| Plot type | Count rate plots | Images |
|---|---|---|
| Comparison with Poisson distribution Blue bars denote a histogram of data divided into 1 sec bins. Red curve is a Poisson curve with rate = median count rate of data. |
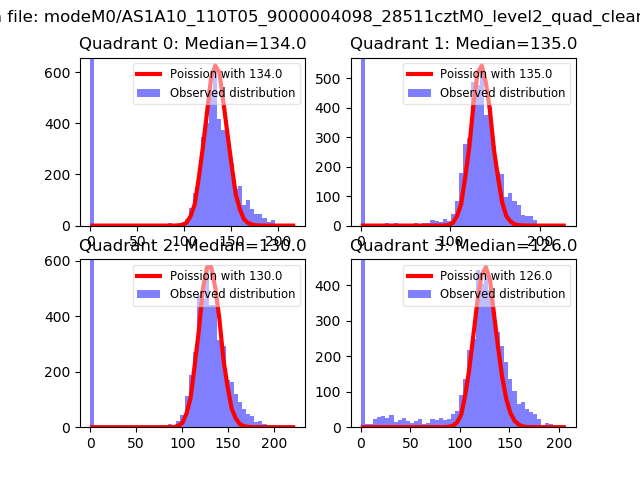 |
 |
| Quadrant-wise count rates Data is divided into 100 sec bins |
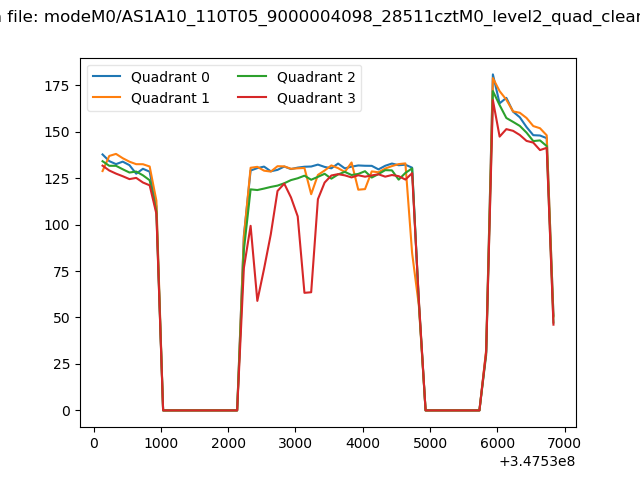 |
|
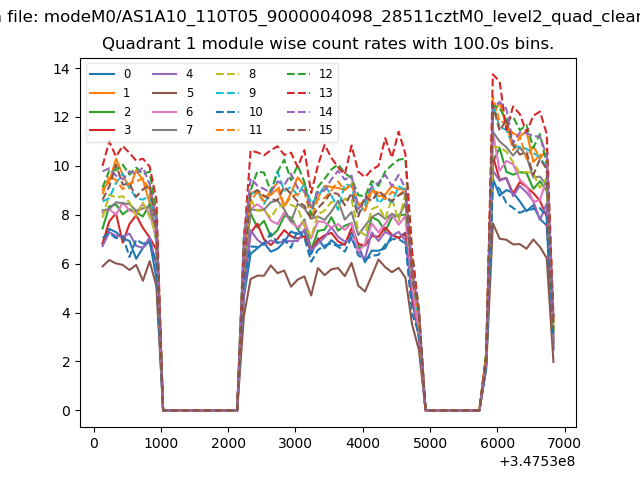
| Module-wise count rates for Quadrant A Data is divided into 100 sec bins |
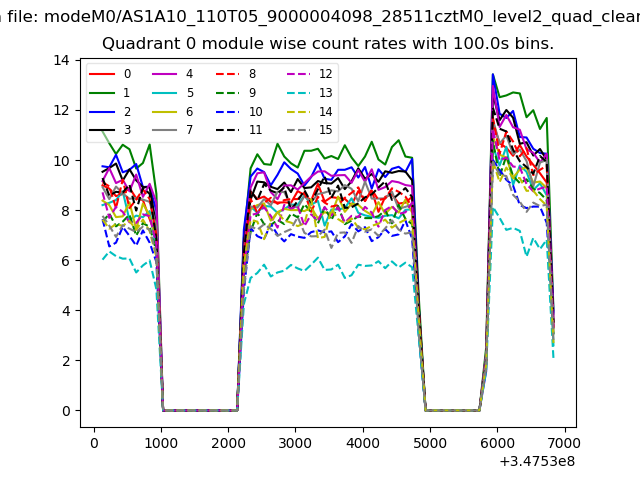 |
 |
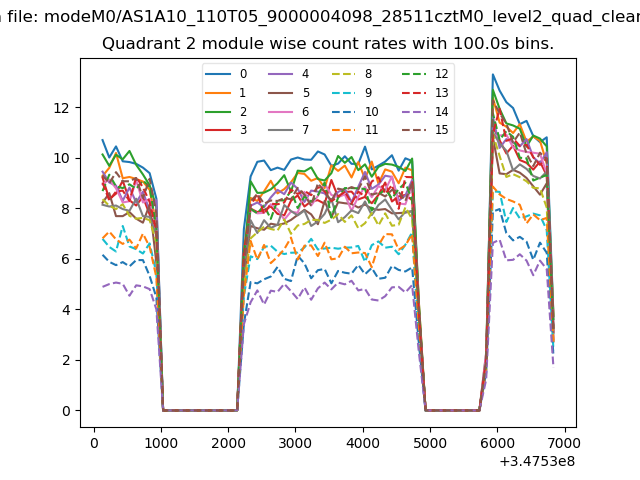
| Module-wise count rates for Quadrant B Data is divided into 100 sec bins |
 |
 |
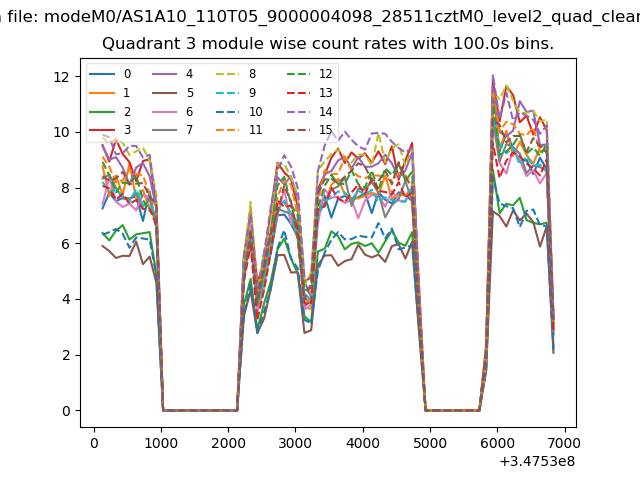
| Module-wise count rates for Quadrant C Data is divided into 100 sec bins |
 |
 |
| Module-wise count rates for Quadrant D Data is divided into 100 sec bins |
 |
 |
| Parameter | Plot |
|---|---|
| CZT HV Monitor | 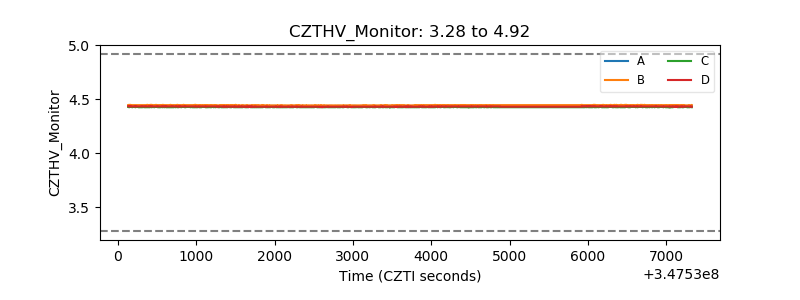 |
| D_VDD | 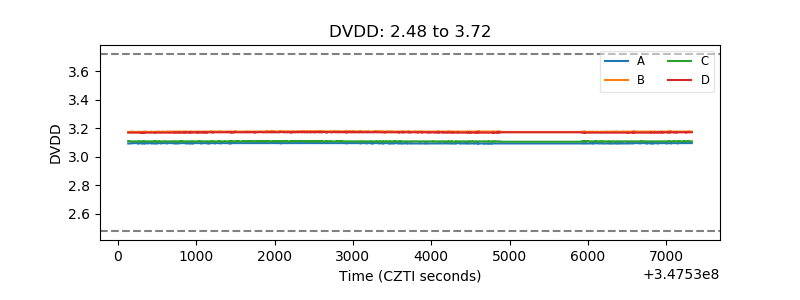 |
| Temperature 1 |  |
| Veto HV Monitor | 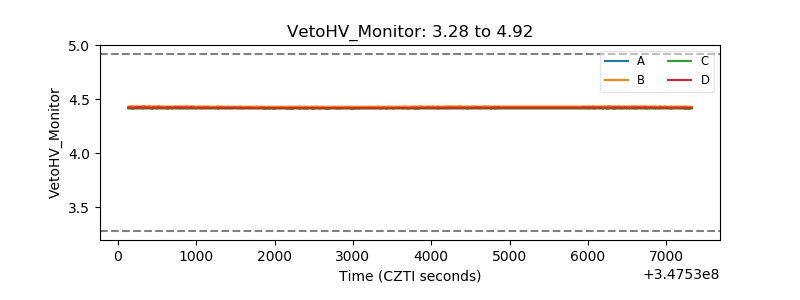 |
| Veto LLD | 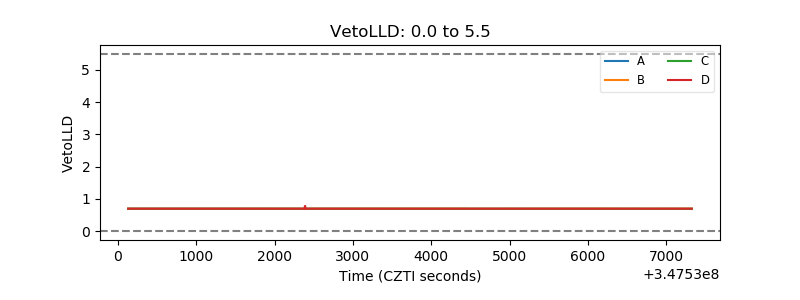 |
| Alpha Counter | 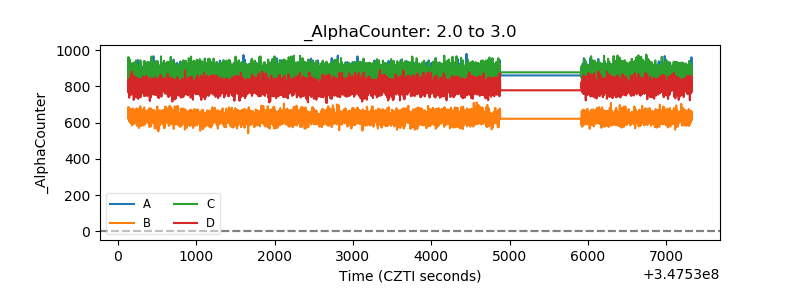 |
| _CPM_Rate | 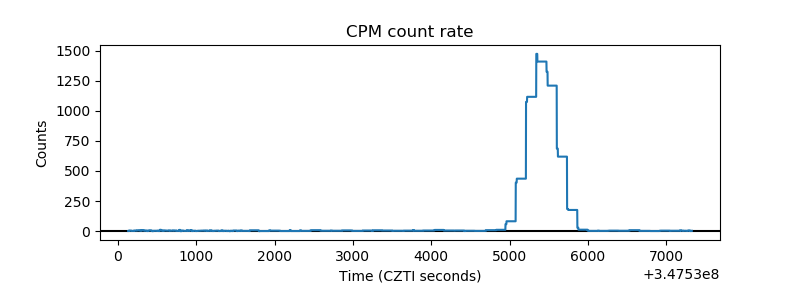 |
| CZT Counter | 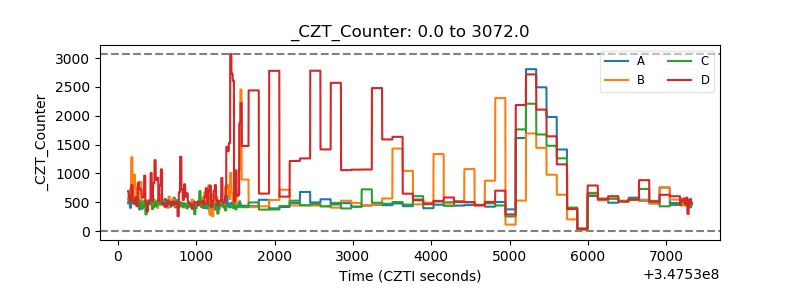 |
| +2.5 Volts monitor |  |
| +5 Volts monitor |  |
| _ROLL_ROT | 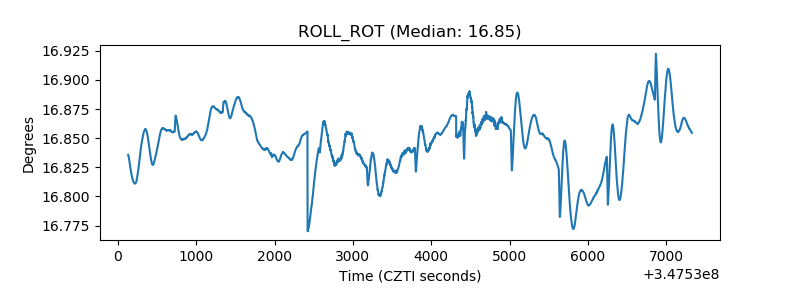 |
| _Roll_DEC | 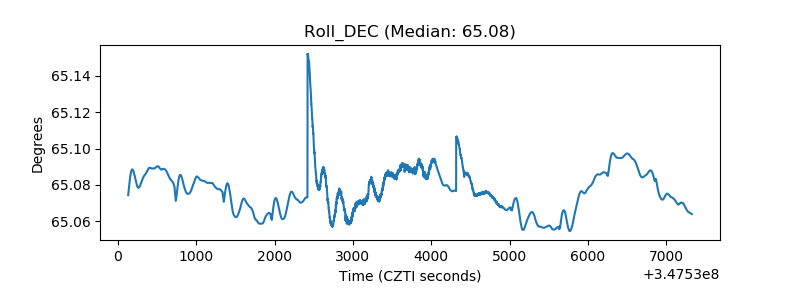 |
| _Roll_RA | 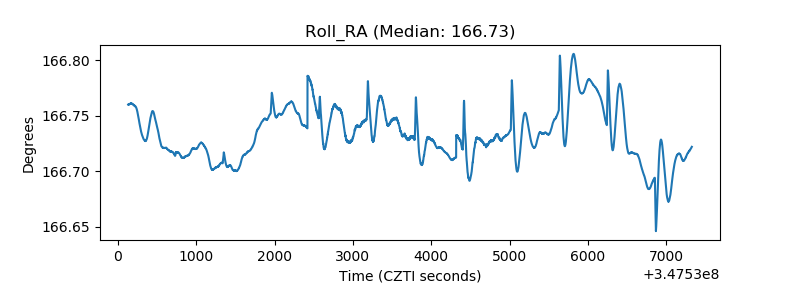 |
| Veto Counter | 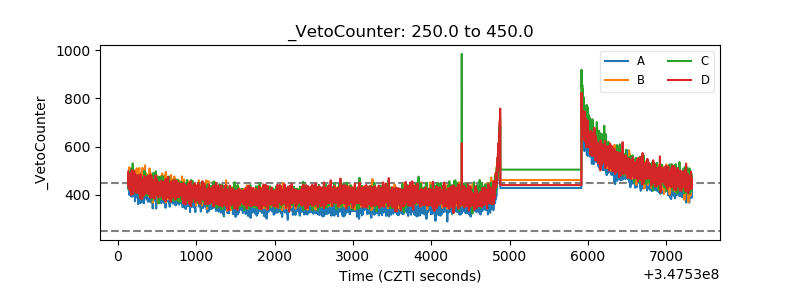 |