| Param | Original file | Final file |
|---|---|---|
| Filename | modeM0/AS1A10_110T05_9000004098_28513cztM0_level2.evt | modeM0/AS1A10_110T05_9000004098_28513cztM0_level2_quad_clean.evt |
| Size (bytes) | 519,868,800 | 90,388,800 |
| Size | 495.8 MB | 86.2 MB |
| Events in quadrant A | 3,224,002 | 587,792 |
| Events in quadrant B | 3,251,283 | 593,529 |
| Events in quadrant C | 3,254,929 | 564,177 |
| Events in quadrant D | 5,580,852 | 546,065 |
| Mode M9 | |||
|---|---|---|---|
| Quadrant | BADHDUFLAG | Total packets | Discarded packets |
| A | 0 | 12 | 0 |
| B | 0 | 12 | 0 |
| C | 0 | 12 | 0 |
| D | 0 | 12 | 0 |
| Mode SS | |||
|---|---|---|---|
| Quadrant | BADHDUFLAG | Total packets | Discarded packets |
| A | 0 | 130 | 0 |
| B | 0 | 130 | 0 |
| C | 0 | 130 | 0 |
| D | 0 | 130 | 0 |
| Mode M0 | |||
|---|---|---|---|
| Quadrant | BADHDUFLAG | Total packets | Discarded packets |
| A | 0 | 13571 | 1 |
| B | 0 | 13674 | 1 |
| C | 0 | 13565 | 1 |
| D | 0 | 20856 | 1 |
| Quadrant | Total seconds | Saturated seconds | Saturation percentage |
|---|---|---|---|
| A | 6386 | 80 | 1.252740% |
| B | 6387 | 94 | 1.471739% |
| C | 6387 | 113 | 1.769219% |
| D | 6387 | 431 | 6.748082% |
Noise dominated data is calculated using 1-second bins in cleaned event files. If a bin has >2000 counts, and if more than 50% of those come from <1% of pixels, then it is considered to be noise-dominated and hence unusable.
| Quadrant | # 1 sec bins | Bins with >0 counts | Bins with >2000 counts | High rate bins dominated by noise | Noise dominated (total time) | Noise dominated (detector-on time) | Marked lightcurve |
|---|---|---|---|---|---|---|---|
| A | 7506 | 6386 | 0 | 0 | 0.00% | 0.00% | 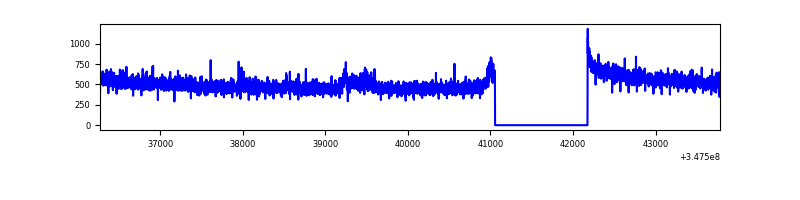 |
| B | 7507 | 6387 | 2 | 2 | 0.03% | 0.03% | 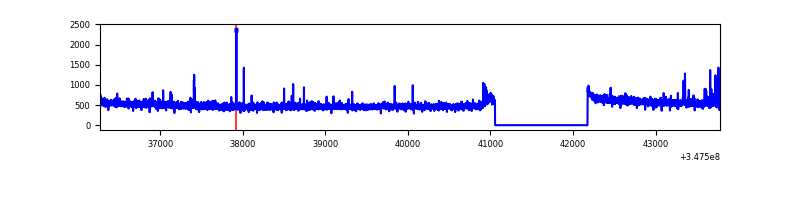 |
| C | 7507 | 6387 | 0 | 0 | 0.00% | 0.00% |  |
| D | 7507 | 6387 | 448 | 448 | 5.97% | 7.01% | 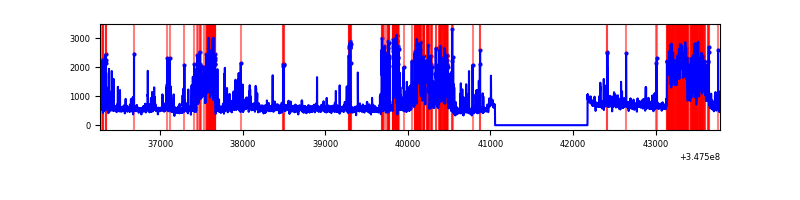 |
Top three noisy pixels from each quadrant. If the there are fewer than three noisy pixels in the level2.evt file, extra rows are filled as -1
| Pixel properties | Quadrant properties | ||||||
|---|---|---|---|---|---|---|---|
| Quadrant | DetID | PixID | Counts | Sigma | Mean | Median | Sigma |
| A | 6 | 16 | 34568 | 205.22 | 826 | 808 | 164.5 |
| A | 13 | 254 | 10001 | 55.88 | 826 | 808 | 164.5 |
| A | 3 | 137 | 7502 | 40.69 | 826 | 808 | 164.5 |
| B | 0 | 230 | 29328 | 188.7 | 811 | 793 | 151.2 |
| B | 10 | 245 | 19229 | 121.92 | 811 | 793 | 151.2 |
| B | 12 | 111 | 18021 | 113.93 | 811 | 793 | 151.2 |
| C | 14 | 238 | 132392 | 729.29 | 783 | 789 | 180.5 |
| C | 7 | 247 | 31950 | 172.68 | 783 | 789 | 180.5 |
| C | 3 | 233 | 21440 | 114.44 | 783 | 789 | 180.5 |
| D | 8 | 195 | 1594089 | 8590.98 | 787 | 768 | 185.5 |
| D | 1 | 52 | 754312 | 4063.01 | 787 | 768 | 185.5 |
| D | 2 | 250 | 124144 | 665.23 | 787 | 768 | 185.5 |
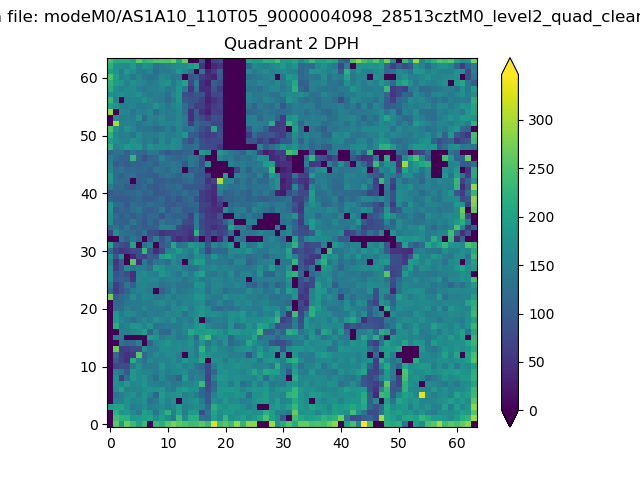
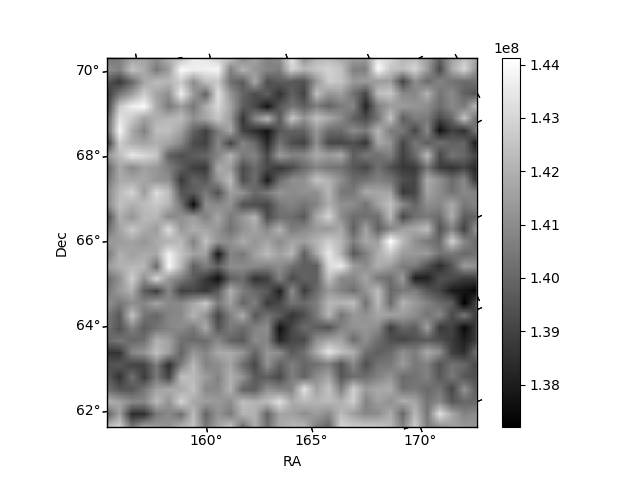
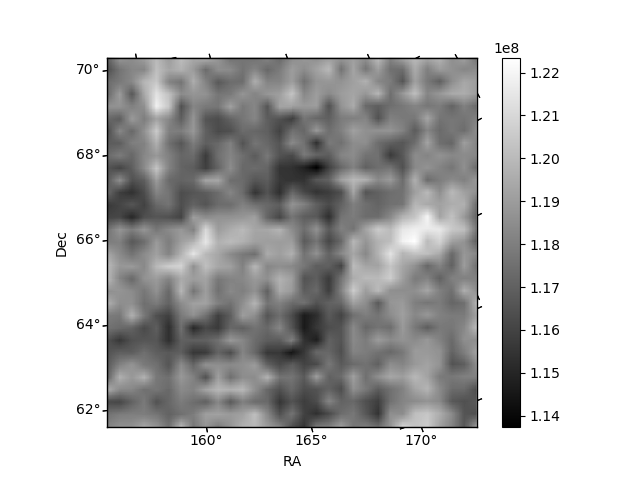
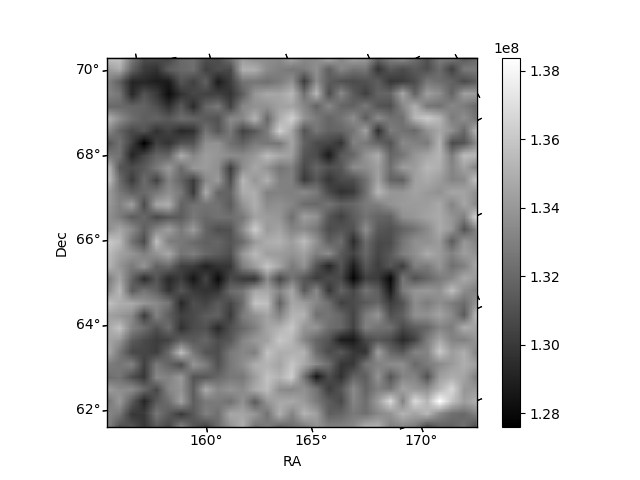
Histogram calculated using DETX and DETY for each event in the final _common_clean file
| Quadrant A |  |
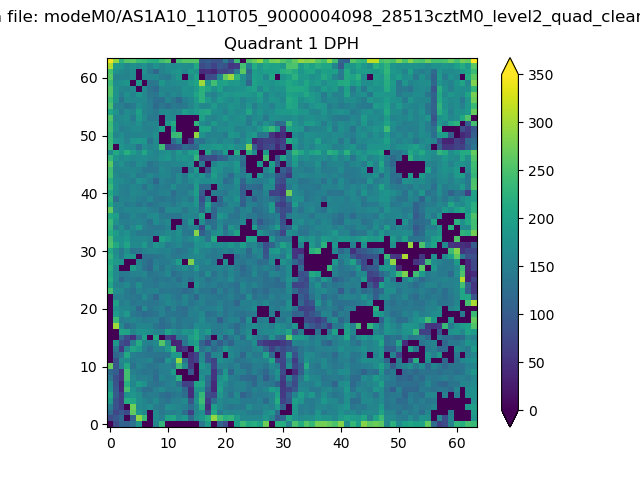 |
Quadrant B |
|---|---|---|---|
| Quadrant D | 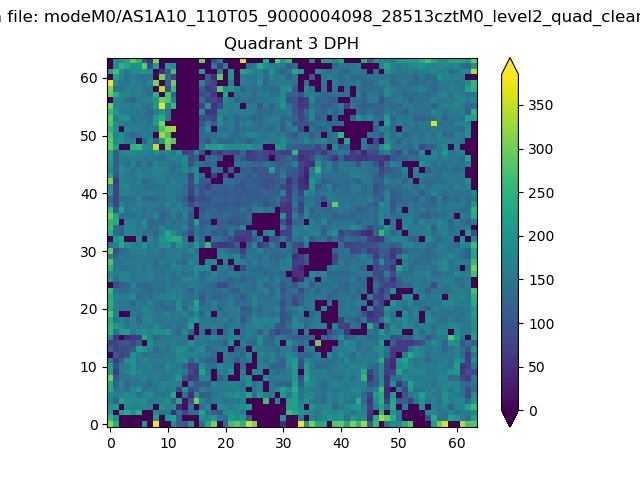 |
 |
Quadrant C |
| Plot type | Count rate plots | Images |
|---|---|---|
| Comparison with Poisson distribution Blue bars denote a histogram of data divided into 1 sec bins. Red curve is a Poisson curve with rate = median count rate of data. |
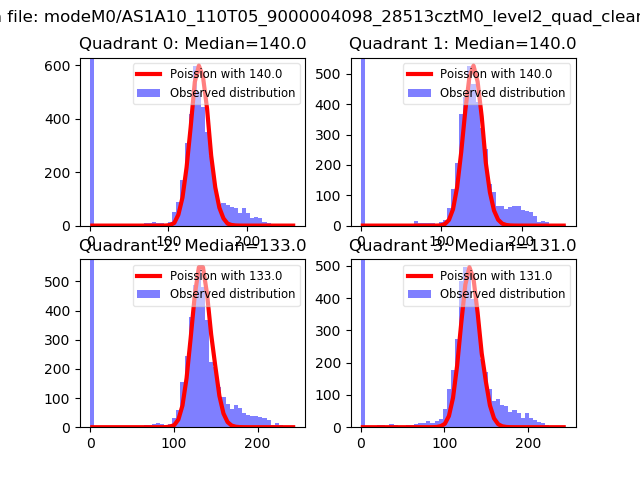 |
 |
| Quadrant-wise count rates Data is divided into 100 sec bins |
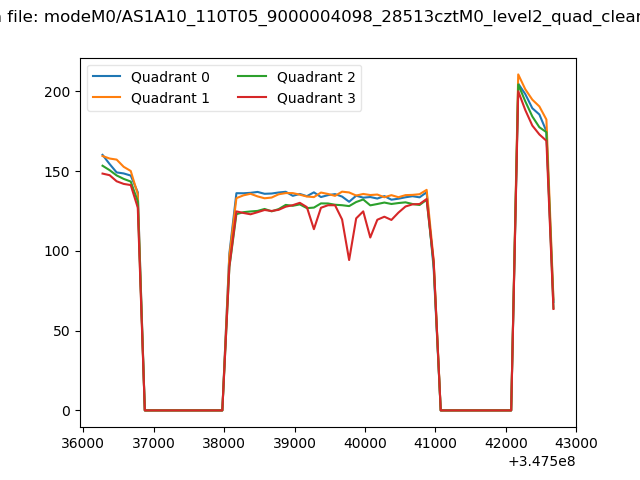 |
|
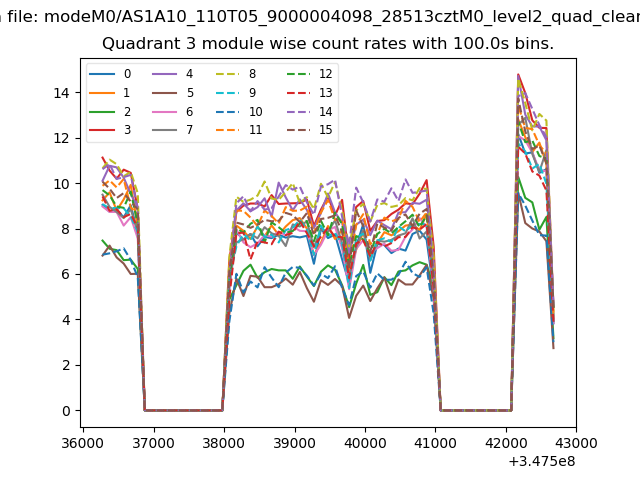
| Module-wise count rates for Quadrant A Data is divided into 100 sec bins |
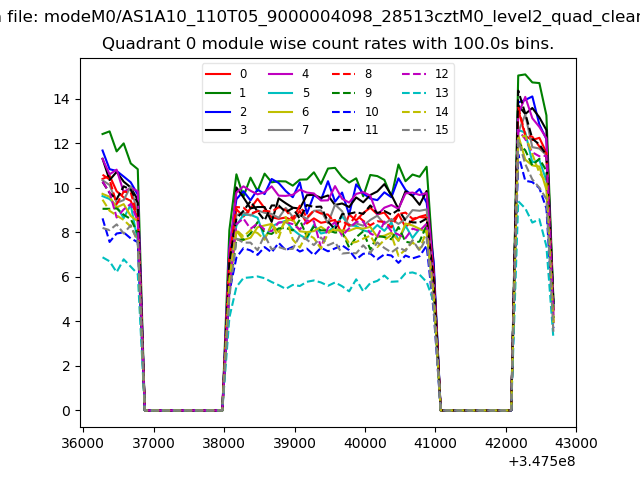 |
 |
| Module-wise count rates for Quadrant B Data is divided into 100 sec bins |
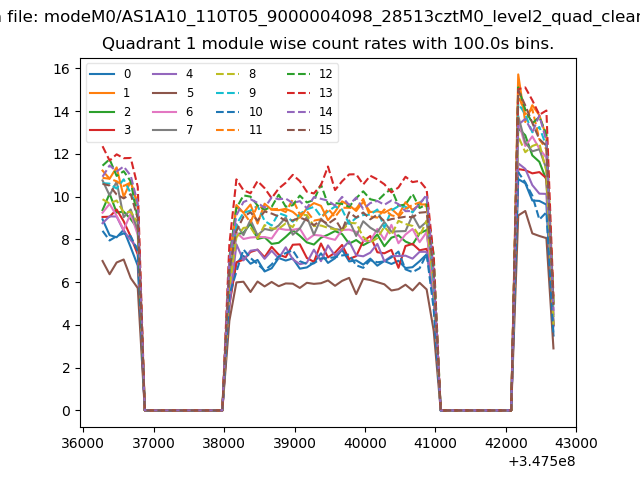 |
 |
| Module-wise count rates for Quadrant C Data is divided into 100 sec bins |
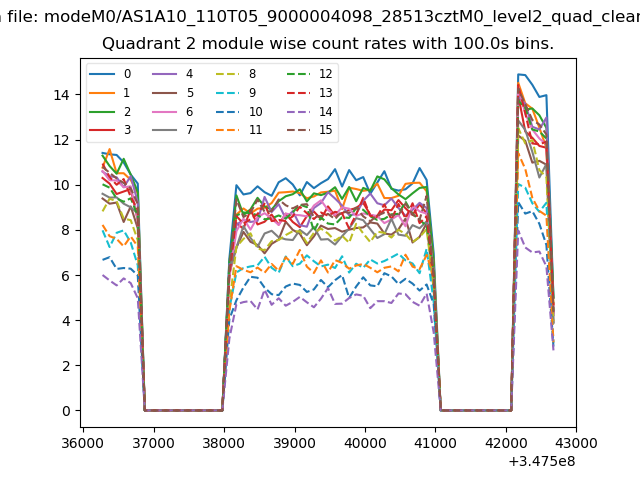 |
 |
| Module-wise count rates for Quadrant D Data is divided into 100 sec bins |
 |
 |
| Parameter | Plot |
|---|---|
| CZT HV Monitor | 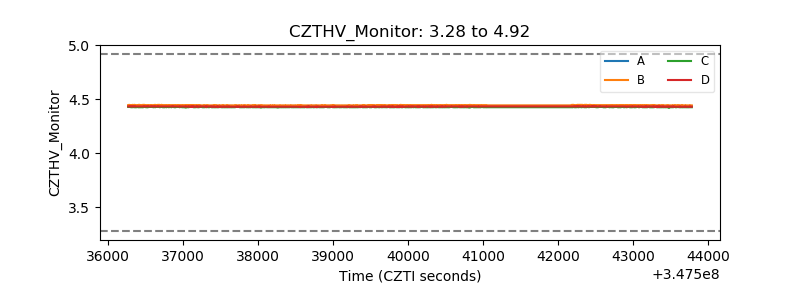 |
| D_VDD | 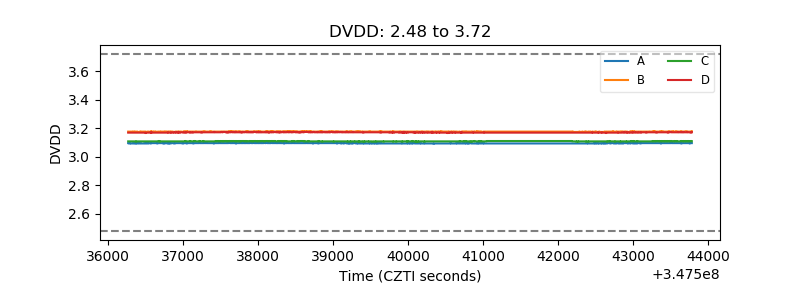 |
| Temperature 1 | 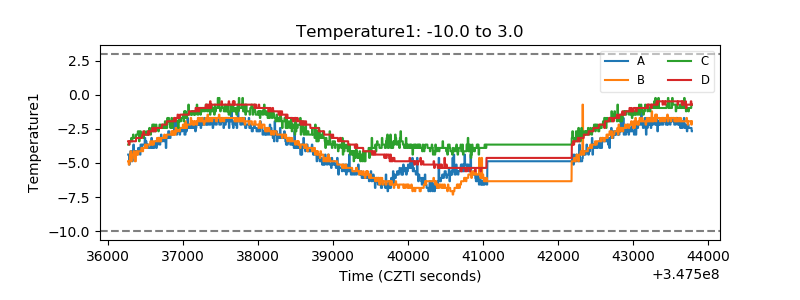 |
| Veto HV Monitor | 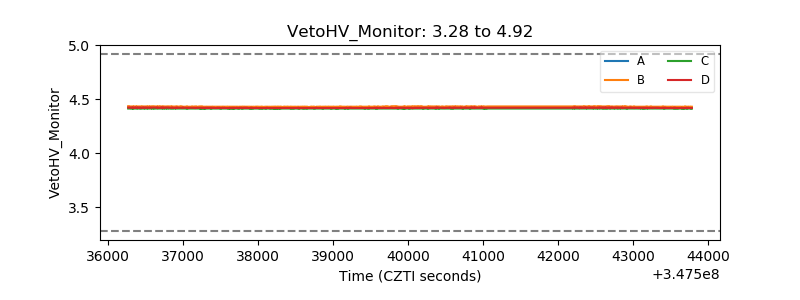 |
| Veto LLD | 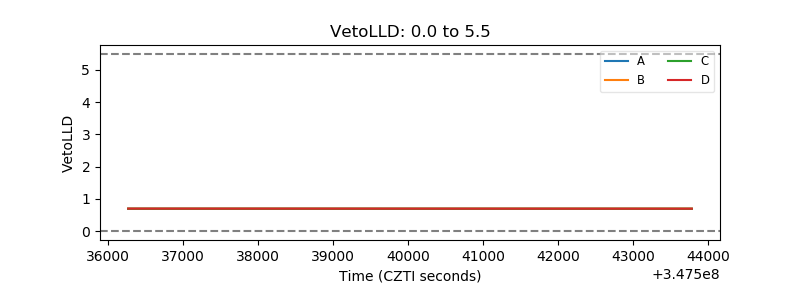 |
| Alpha Counter | 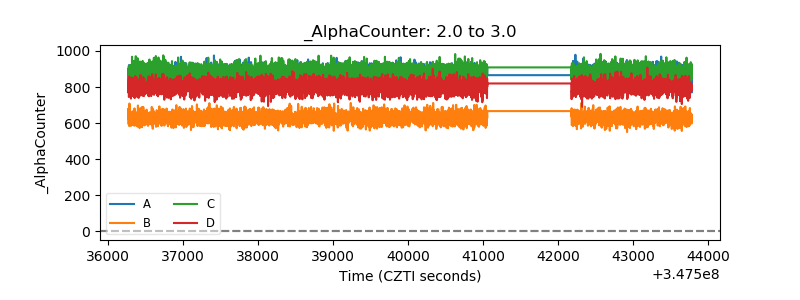 |
| _CPM_Rate | 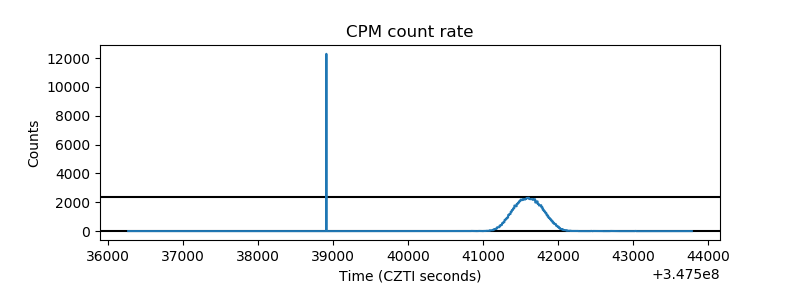 |
| CZT Counter | 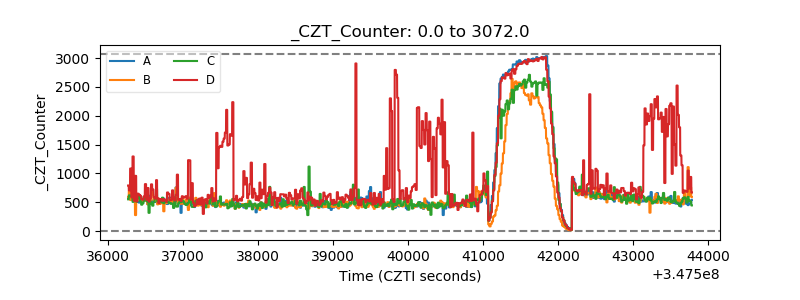 |
| +2.5 Volts monitor |  |
| +5 Volts monitor |  |
| _ROLL_ROT | 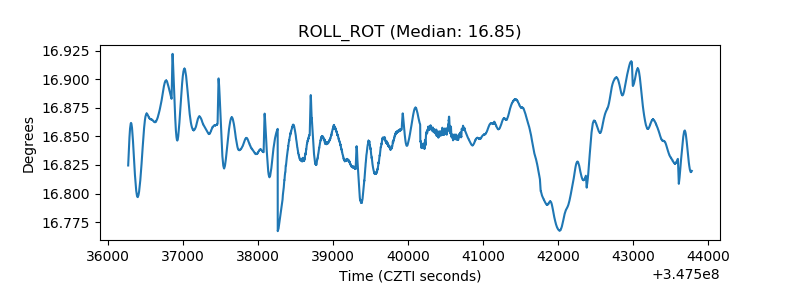 |
| _Roll_DEC | 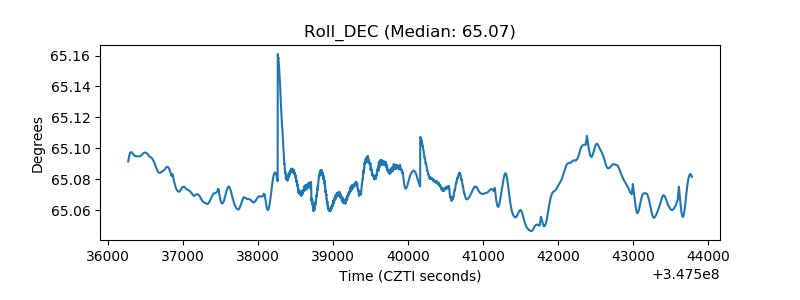 |
| _Roll_RA |  |
| Veto Counter | 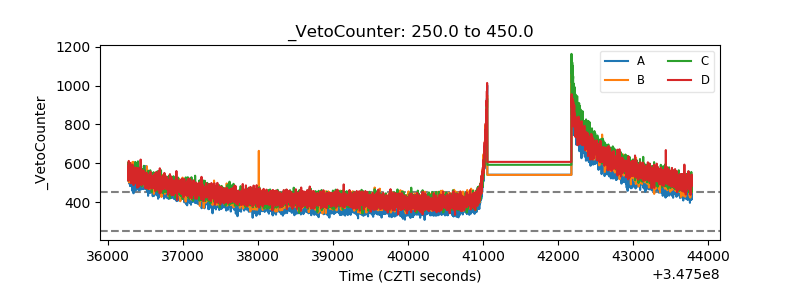 |