| Param | Original file | Final file |
|---|---|---|
| Filename | modeM0/AS1A10_110T05_9000004098_28514cztM0_level2.evt | modeM0/AS1A10_110T05_9000004098_28514cztM0_level2_quad_clean.evt |
| Size (bytes) | 254,802,240 | 41,679,360 |
| Size | 243.0 MB | 39.7 MB |
| Events in quadrant A | 1,561,791 | 269,329 |
| Events in quadrant B | 1,657,773 | 269,142 |
| Events in quadrant C | 1,586,416 | 254,400 |
| Events in quadrant D | 2,702,090 | 251,729 |
| Mode SS | |||
|---|---|---|---|
| Quadrant | BADHDUFLAG | Total packets | Discarded packets |
| A | 0 | 62 | 0 |
| B | 0 | 62 | 0 |
| C | 0 | 62 | 0 |
| D | 0 | 62 | 0 |
| Mode M0 | |||
|---|---|---|---|
| Quadrant | BADHDUFLAG | Total packets | Discarded packets |
| A | 0 | 6481 | 0 |
| B | 0 | 6769 | 0 |
| C | 0 | 6454 | 0 |
| D | 0 | 10330 | 0 |
| Quadrant | Total seconds | Saturated seconds | Saturation percentage |
|---|---|---|---|
| A | 3044 | 1 | 0.032852% |
| B | 3045 | 8 | 0.262726% |
| C | 3045 | 12 | 0.394089% |
| D | 3045 | 190 | 6.239737% |
Noise dominated data is calculated using 1-second bins in cleaned event files. If a bin has >2000 counts, and if more than 50% of those come from <1% of pixels, then it is considered to be noise-dominated and hence unusable.
| Quadrant | # 1 sec bins | Bins with >0 counts | Bins with >2000 counts | High rate bins dominated by noise | Noise dominated (total time) | Noise dominated (detector-on time) | Marked lightcurve |
|---|---|---|---|---|---|---|---|
| A | 3044 | 3044 | 0 | 0 | 0.00% | 0.00% | 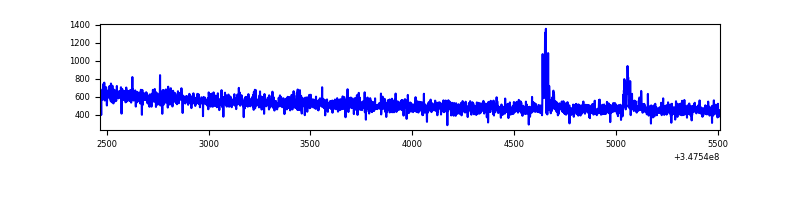 |
| B | 3045 | 3045 | 0 | 0 | 0.00% | 0.00% | 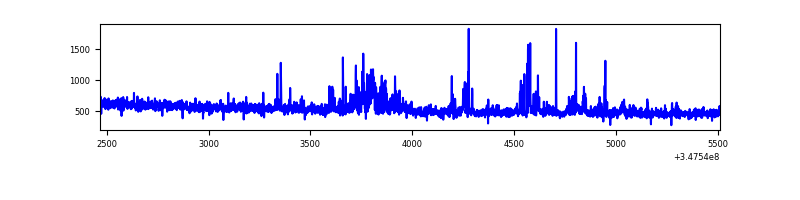 |
| C | 3045 | 3045 | 0 | 0 | 0.00% | 0.00% | 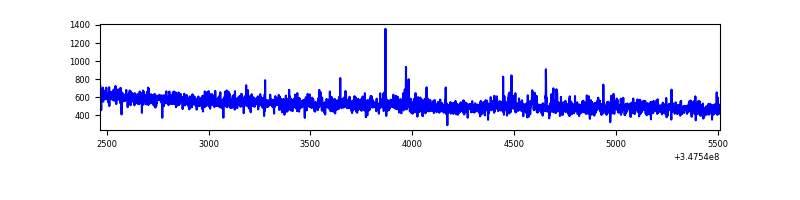 |
| D | 3045 | 3045 | 223 | 223 | 7.32% | 7.32% | 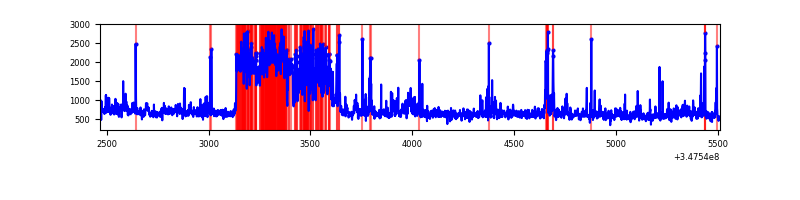 |
Top three noisy pixels from each quadrant. If the there are fewer than three noisy pixels in the level2.evt file, extra rows are filled as -1
| Pixel properties | Quadrant properties | ||||||
|---|---|---|---|---|---|---|---|
| Quadrant | DetID | PixID | Counts | Sigma | Mean | Median | Sigma |
| A | 12 | 96 | 22622 | 278.73 | 397 | 391 | 79.8 |
| A | 13 | 254 | 5135 | 59.48 | 397 | 391 | 79.8 |
| A | 13 | 170 | 4023 | 45.54 | 397 | 391 | 79.8 |
| B | 0 | 230 | 121728 | 1661.74 | 390 | 381 | 73.0 |
| B | 12 | 111 | 8152 | 106.42 | 390 | 381 | 73.0 |
| B | 11 | 111 | 7562 | 98.34 | 390 | 381 | 73.0 |
| C | 14 | 238 | 63826 | 718.4 | 379 | 382 | 88.3 |
| C | 3 | 233 | 26735 | 298.41 | 379 | 382 | 88.3 |
| C | 7 | 247 | 12633 | 138.72 | 379 | 382 | 88.3 |
| D | 8 | 195 | 825441 | 8940.31 | 384 | 375 | 92.3 |
| D | 1 | 52 | 247325 | 2675.92 | 384 | 375 | 92.3 |
| D | 12 | 233 | 71764 | 773.56 | 384 | 375 | 92.3 |
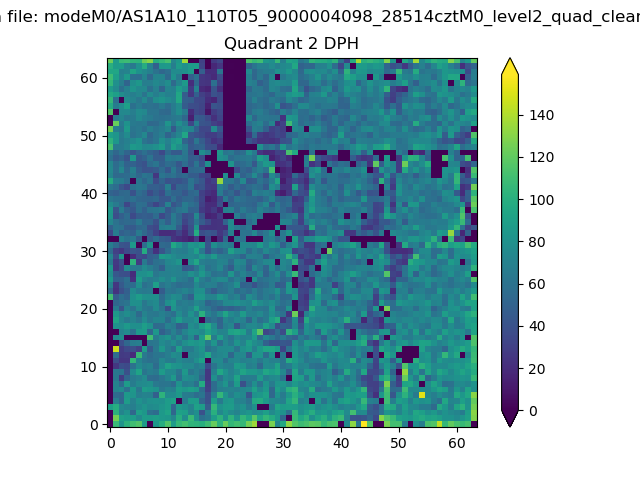
Histogram calculated using DETX and DETY for each event in the final _common_clean file
| Quadrant A |  |
 |
Quadrant B |
|---|---|---|---|
| Quadrant D |  |
 |
Quadrant C |
| Plot type | Count rate plots | Images |
|---|---|---|
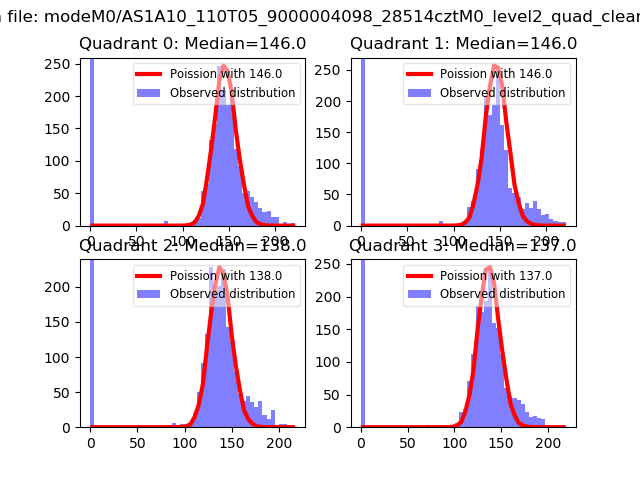
| Comparison with Poisson distribution Blue bars denote a histogram of data divided into 1 sec bins. Red curve is a Poisson curve with rate = median count rate of data. |
 |
 |
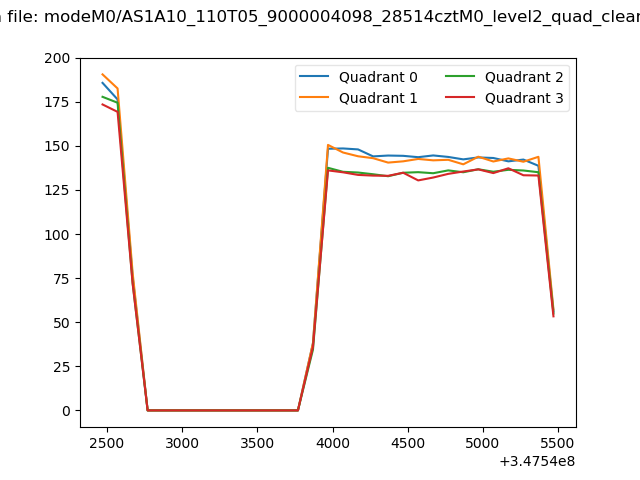
| Quadrant-wise count rates Data is divided into 100 sec bins |
 |
|
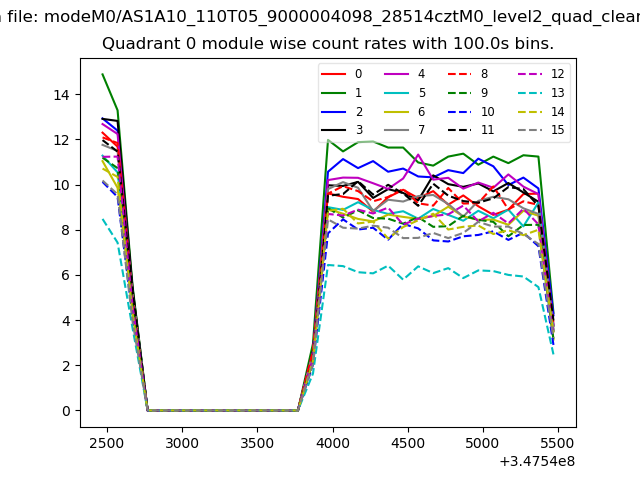
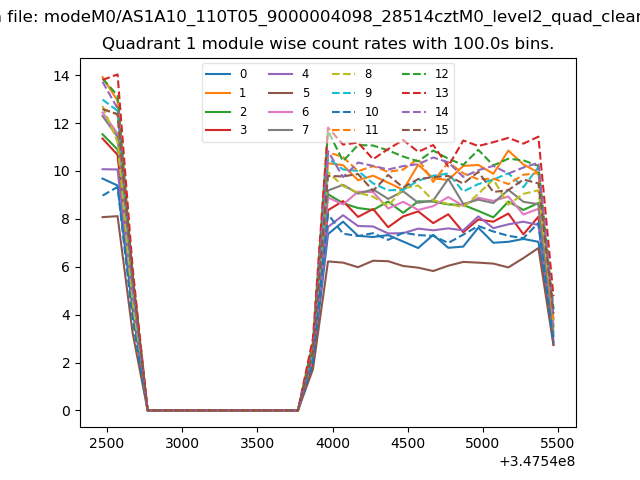
| Module-wise count rates for Quadrant A Data is divided into 100 sec bins |
 |
 |
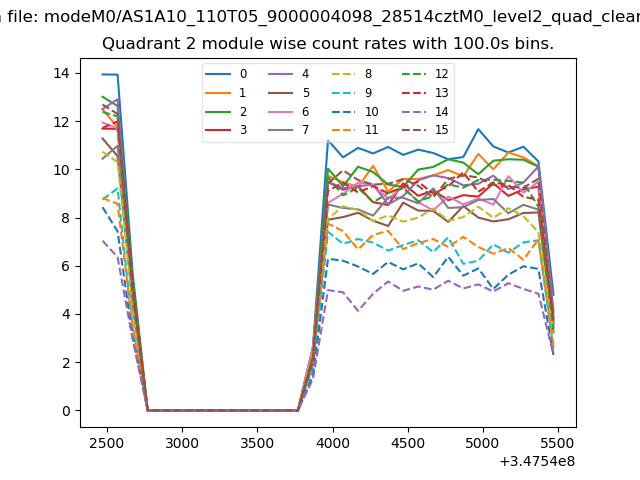
| Module-wise count rates for Quadrant B Data is divided into 100 sec bins |
 |
 |
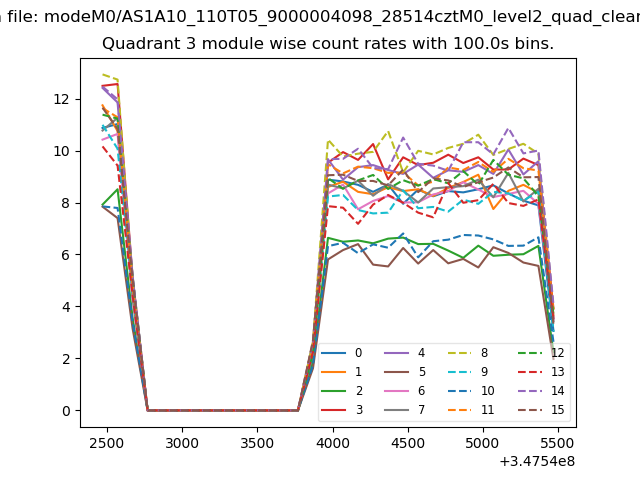
| Module-wise count rates for Quadrant C Data is divided into 100 sec bins |
 |
 |
| Module-wise count rates for Quadrant D Data is divided into 100 sec bins |
 |
 |
| Parameter | Plot |
|---|---|
| CZT HV Monitor |  |
| D_VDD | 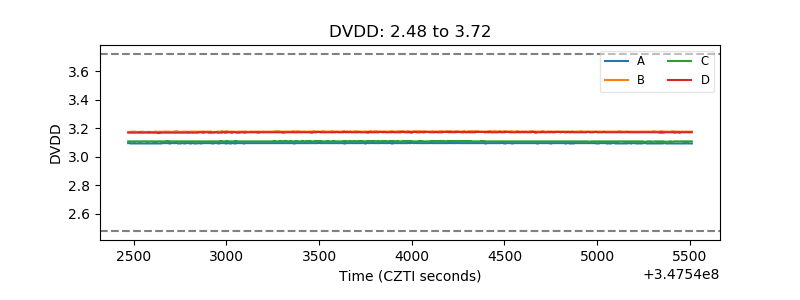 |
| Temperature 1 | 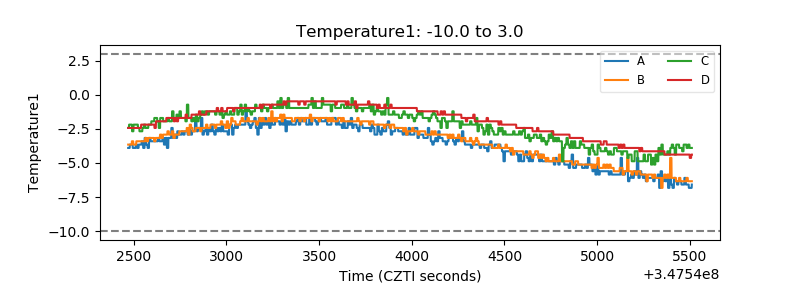 |
| Veto HV Monitor | 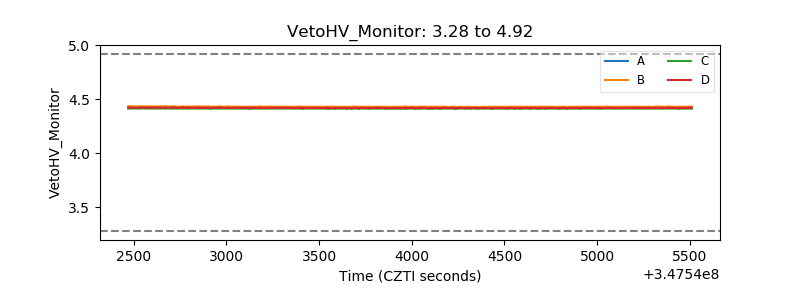 |
| Veto LLD | 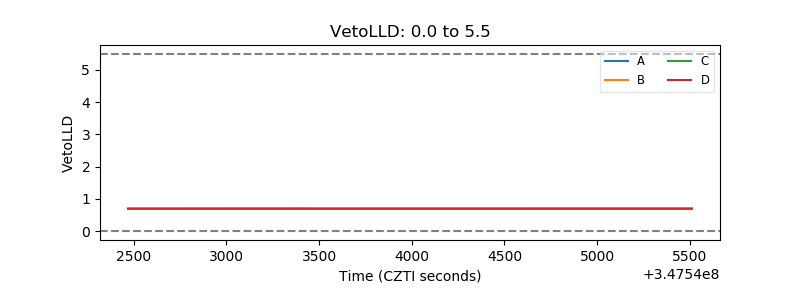 |
| Alpha Counter | 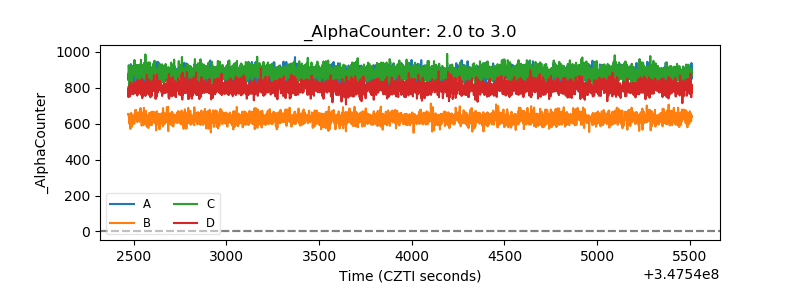 |
| _CPM_Rate | 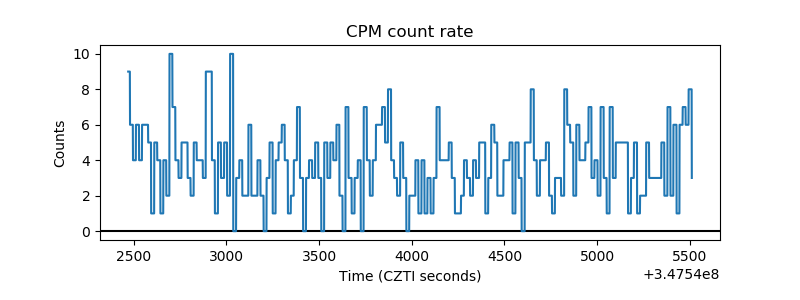 |
| CZT Counter | 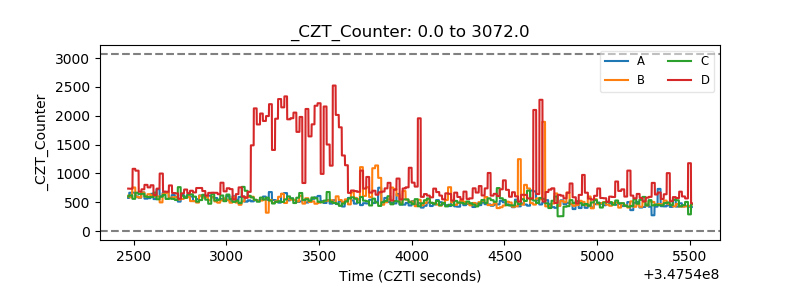 |
| +2.5 Volts monitor |  |
| +5 Volts monitor |  |
| _ROLL_ROT | 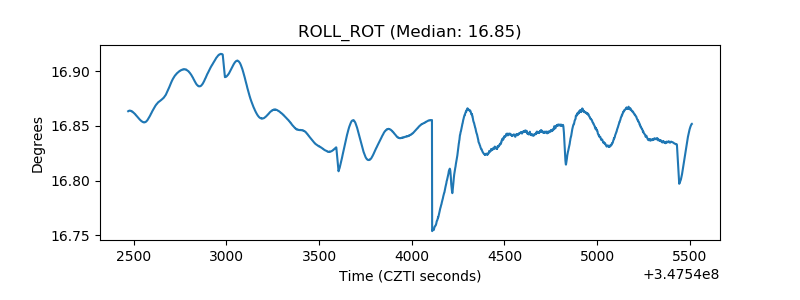 |
| _Roll_DEC | 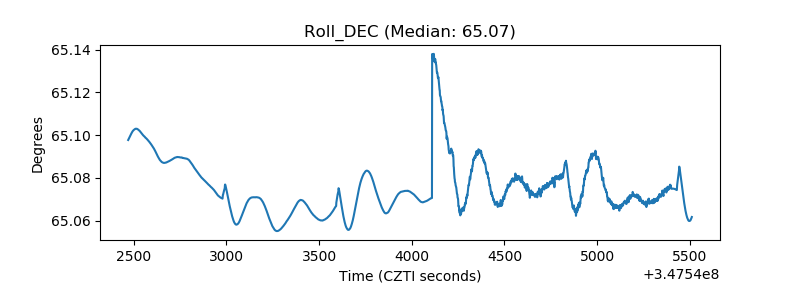 |
| _Roll_RA |  |
| Veto Counter | 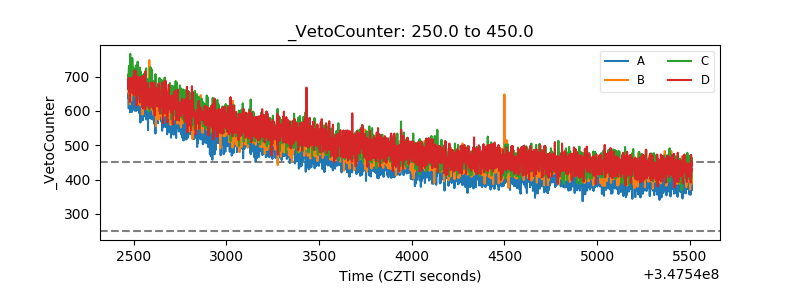 |