| Param | Original file | Final file |
|---|---|---|
| Filename | modeM0/AS1A10_123T03_9000004096cztM0_level2.fits | modeM0/AS1A10_123T03_9000004096cztM0_level2_quad_clean.evt |
| Size (bytes) | 453,124,800 | 314,179,200 |
| Size | 432.1 MB | 299.6 MB |
| Events in quadrant A | 2,865,522 | 1,724,227 |
| Events in quadrant B | 2,741,646 | 1,727,195 |
| Events in quadrant C | 2,829,260 | 1,652,386 |
| Events in quadrant D | 2,228,446 | 1,354,385 |
| Mode M0 | |||
|---|---|---|---|
| Quadrant | BADHDUFLAG | Total packets | Discarded packets |
| A | 0 | 94694 | 0 |
| B | 0 | 96735 | 0 |
| C | 0 | 95585 | 0 |
| D | 0 | 181330 | 0 |
| Mode M9 | |||
|---|---|---|---|
| Quadrant | BADHDUFLAG | Total packets | Discarded packets |
| A | 0 | 77 | 0 |
| B | 0 | 77 | 0 |
| C | 0 | 77 | 0 |
| D | 0 | 77 | 0 |
| Mode SS | |||
|---|---|---|---|
| Quadrant | BADHDUFLAG | Total packets | Discarded packets |
| A | 0 | 904 | 0 |
| B | 0 | 906 | 0 |
| C | 0 | 906 | 0 |
| D | 0 | 906 | 0 |
| Quadrant | Total seconds | Saturated seconds | Saturation percentage |
|---|---|---|---|
| A | 44503 | 581 | 1.305530% |
| B | 44496 | 643 | 1.445074% |
| C | 44504 | 829 | 1.862754% |
| D | 44487 | 8849 | 19.891204% |
Noise dominated data is calculated using 1-second bins in cleaned event files. If a bin has >2000 counts, and if more than 50% of those come from <1% of pixels, then it is considered to be noise-dominated and hence unusable.
| Quadrant | # 1 sec bins | Bins with >0 counts | Bins with >2000 counts | High rate bins dominated by noise | Noise dominated (total time) | Noise dominated (detector-on time) | Marked lightcurve |
|---|---|---|---|---|---|---|---|
| A | 52114 | 44518 | 0 | 0 | 0.00% | 0.00% |  |
| B | 52114 | 44513 | 0 | 0 | 0.00% | 0.00% |  |
| C | 52114 | 44515 | 0 | 0 | 0.00% | 0.00% |  |
| D | 52114 | 44034 | 0 | 0 | 0.00% | 0.00% |  |
Top three noisy pixels from each quadrant. If the there are fewer than three noisy pixels in the level2.evt file, extra rows are filled as -1
| Pixel properties | Quadrant properties | ||||||
|---|---|---|---|---|---|---|---|
| Quadrant | DetID | PixID | Counts | Sigma | Mean | Median | Sigma |
| A | 0 | 29 | 2678 | 10.98 | 745 | 700 | 180.1 |
| A | 9 | 19 | 2231 | 8.5 | 745 | 700 | 180.1 |
| A | 0 | 30 | 2178 | 8.21 | 745 | 700 | 180.1 |
| B | 2 | 9 | 2198 | 10.55 | 724 | 692 | 142.7 |
| B | 5 | 128 | 1857 | 8.16 | 724 | 692 | 142.7 |
| B | 2 | 8 | 1844 | 8.07 | 724 | 692 | 142.7 |
| C | 1 | 81 | 2221 | 8.11 | 747 | 703 | 187.1 |
| C | 1 | 80 | 2159 | 7.78 | 747 | 703 | 187.1 |
| C | 12 | 241 | 1967 | 6.75 | 747 | 703 | 187.1 |
| D | 6 | 67 | 1596 | 6.02 | 637 | 584 | 168.0 |
| D | 6 | 231 | 1561 | 5.81 | 637 | 584 | 168.0 |
| D | 15 | 47 | 1555 | 5.78 | 637 | 584 | 168.0 |
Histogram calculated using DETX and DETY for each event in the final _common_clean file
| Quadrant A |  |
 |
Quadrant B |
|---|---|---|---|
| Quadrant D |  |
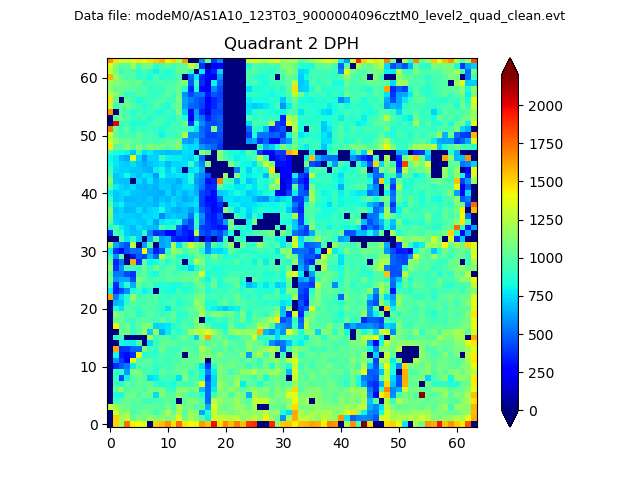 |
Quadrant C |
| Plot type | Count rate plots | Images |
|---|---|---|
| Comparison with Poisson distribution Blue bars denote a histogram of data divided into 1 sec bins. Red curve is a Poisson curve with rate = median count rate of data. |
 |
 |
| Quadrant-wise count rates Data is divided into 100 sec bins |
 |
|
| Module-wise count rates for Quadrant A Data is divided into 100 sec bins |
 |
 |
| Module-wise count rates for Quadrant B Data is divided into 100 sec bins |
 |
 |
| Module-wise count rates for Quadrant C Data is divided into 100 sec bins |
 |
 |
| Module-wise count rates for Quadrant D Data is divided into 100 sec bins |
 |
 |
| Parameter | Plot |
|---|---|
| CZT HV Monitor |  |
| D_VDD |  |
| Temperature 1 |  |
| Veto HV Monitor |  |
| Veto LLD |  |
| Alpha Counter |  |
| _CPM_Rate |  |
| CZT Counter |  |
| +2.5 Volts monitor |  |
| +5 Volts monitor |  |
| _ROLL_ROT |  |
| _Roll_DEC |  |
| _Roll_RA |  |
| Veto Counter |  |