| Param | Original file | Final file |
|---|---|---|
| Filename | modeM0/AS1A10_123T03_9000004096_28495cztM0_level2.evt | modeM0/AS1A10_123T03_9000004096_28495cztM0_level2_quad_clean.evt |
| Size (bytes) | 1,460,027,520 | 213,068,160 |
| Size | 1.4 GB | 203.2 MB |
| Events in quadrant A | 8,207,476 | 1,351,621 |
| Events in quadrant B | 8,440,072 | 1,380,515 |
| Events in quadrant C | 8,503,935 | 1,329,330 |
| Events in quadrant D | 17,881,497 | 1,182,060 |
| Mode M0 | |||
|---|---|---|---|
| Quadrant | BADHDUFLAG | Total packets | Discarded packets |
| A | 0 | 35707 | 3 |
| B | 0 | 36095 | 3 |
| C | 0 | 36330 | 3 |
| D | 0 | 65018 | 3 |
| Mode M9 | |||
|---|---|---|---|
| Quadrant | BADHDUFLAG | Total packets | Discarded packets |
| A | 0 | 18 | 0 |
| B | 0 | 18 | 0 |
| C | 0 | 18 | 0 |
| D | 0 | 18 | 0 |
| Mode SS | |||
|---|---|---|---|
| Quadrant | BADHDUFLAG | Total packets | Discarded packets |
| A | 0 | 358 | 0 |
| B | 0 | 358 | 0 |
| C | 0 | 358 | 0 |
| D | 0 | 358 | 0 |
| Quadrant | Total seconds | Saturated seconds | Saturation percentage |
|---|---|---|---|
| A | 17534 | 200 | 1.140641% |
| B | 17534 | 227 | 1.294628% |
| C | 17533 | 284 | 1.619803% |
| D | 17533 | 3068 | 17.498432% |
Noise dominated data is calculated using 1-second bins in cleaned event files. If a bin has >2000 counts, and if more than 50% of those come from <1% of pixels, then it is considered to be noise-dominated and hence unusable.
| Quadrant | # 1 sec bins | Bins with >0 counts | Bins with >2000 counts | High rate bins dominated by noise | Noise dominated (total time) | Noise dominated (detector-on time) | Marked lightcurve |
|---|---|---|---|---|---|---|---|
| A | 19314 | 17534 | 0 | 0 | 0.00% | 0.00% | 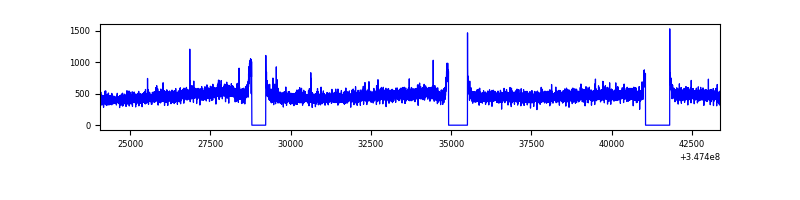 |
| B | 19314 | 17534 | 11 | 11 | 0.06% | 0.06% | 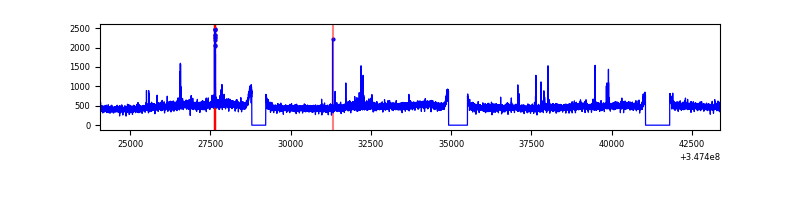 |
| C | 19313 | 17533 | 4 | 4 | 0.02% | 0.02% | 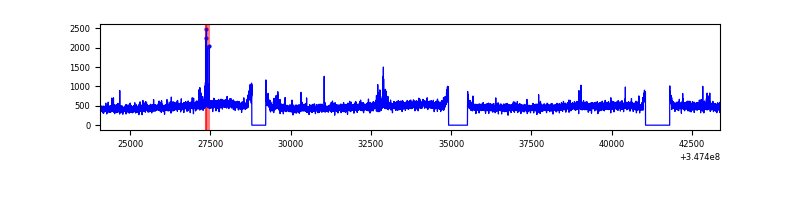 |
| D | 19313 | 17533 | 2185 | 2185 | 11.31% | 12.46% | 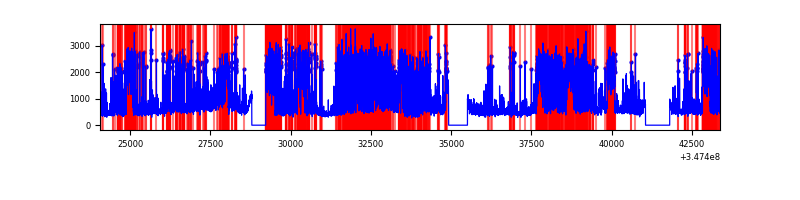 |
Top three noisy pixels from each quadrant. If the there are fewer than three noisy pixels in the level2.evt file, extra rows are filled as -1
| Pixel properties | Quadrant properties | ||||||
|---|---|---|---|---|---|---|---|
| Quadrant | DetID | PixID | Counts | Sigma | Mean | Median | Sigma |
| A | 13 | 254 | 25232 | 54.34 | 2121 | 2070 | 426.2 |
| A | 3 | 137 | 21629 | 45.89 | 2121 | 2070 | 426.2 |
| A | 0 | 226 | 17983 | 37.34 | 2121 | 2070 | 426.2 |
| B | 0 | 230 | 81830 | 195.98 | 2100 | 2039 | 407.1 |
| B | 14 | 207 | 78591 | 188.02 | 2100 | 2039 | 407.1 |
| B | 12 | 111 | 51746 | 122.09 | 2100 | 2039 | 407.1 |
| C | 14 | 238 | 325538 | 679.12 | 2036 | 2046 | 476.3 |
| C | 7 | 247 | 132643 | 274.17 | 2036 | 2046 | 476.3 |
| C | 3 | 233 | 89988 | 184.62 | 2036 | 2046 | 476.3 |
| D | 1 | 52 | 7055160 | 15634.58 | 1885 | 1834 | 451.1 |
| D | 8 | 195 | 3083909 | 6831.81 | 1885 | 1834 | 451.1 |
| D | 12 | 233 | 208997 | 459.2 | 1885 | 1834 | 451.1 |
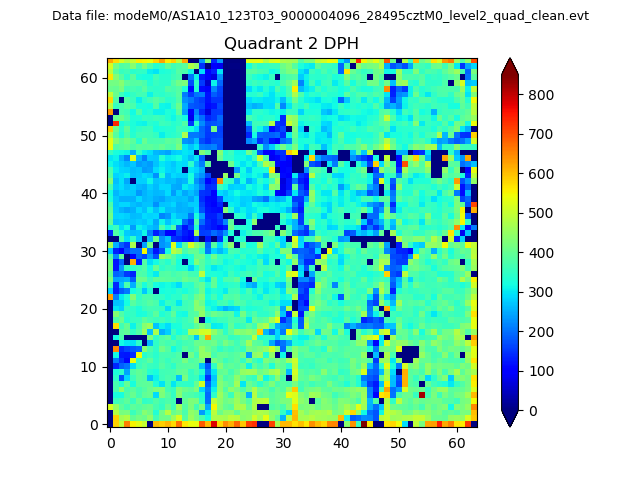
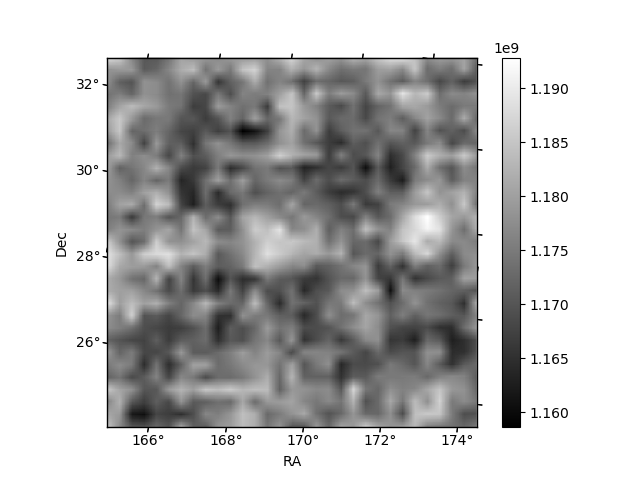
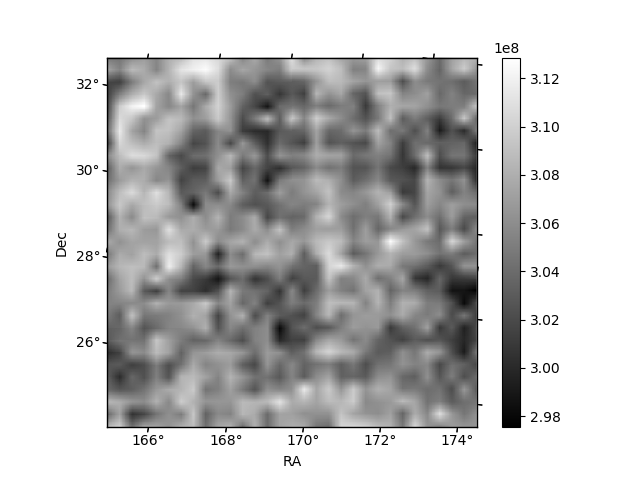
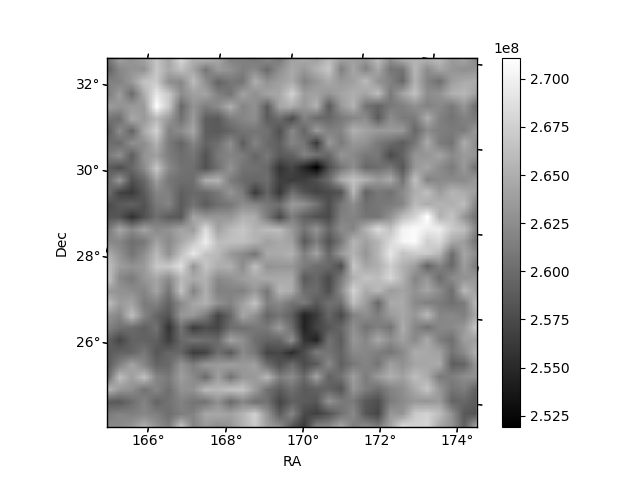
Histogram calculated using DETX and DETY for each event in the final _common_clean file
| Quadrant A | 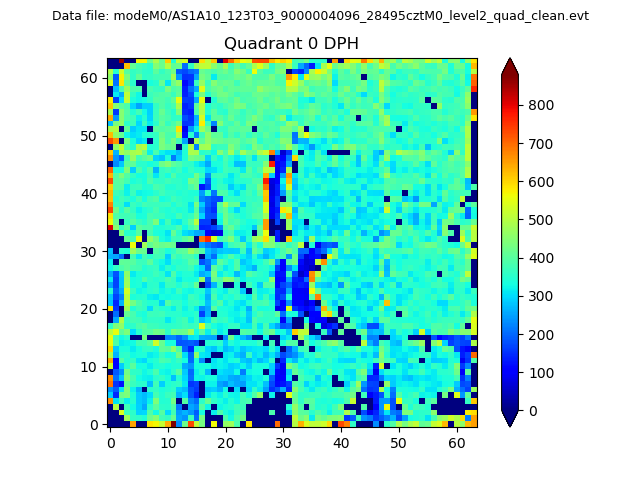 |
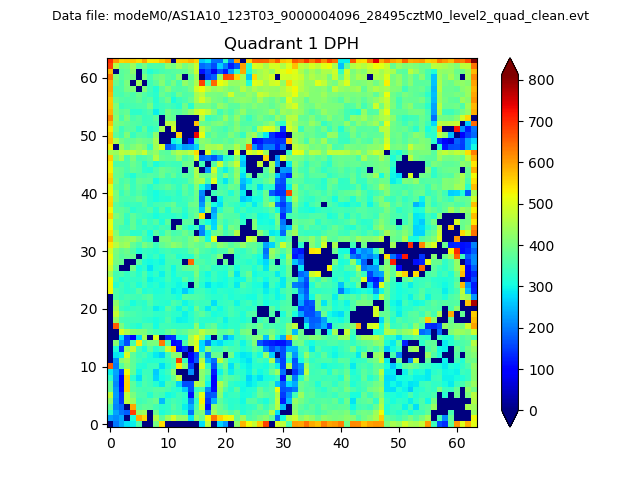 |
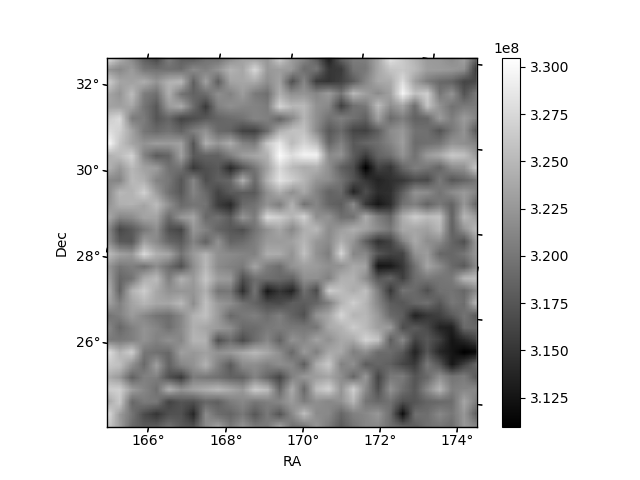
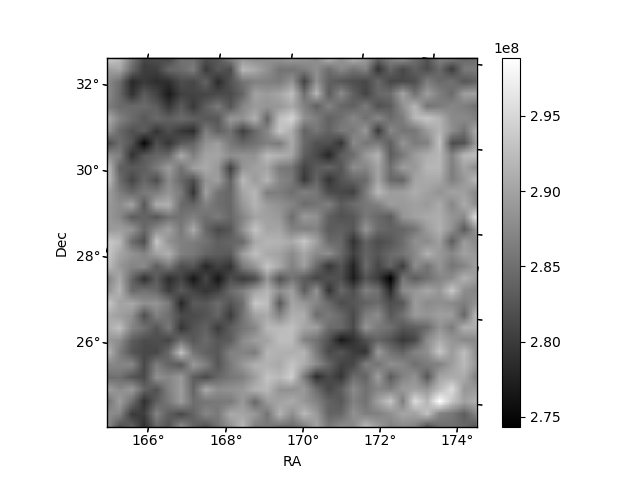
Quadrant B |
|---|---|---|---|
| Quadrant D | 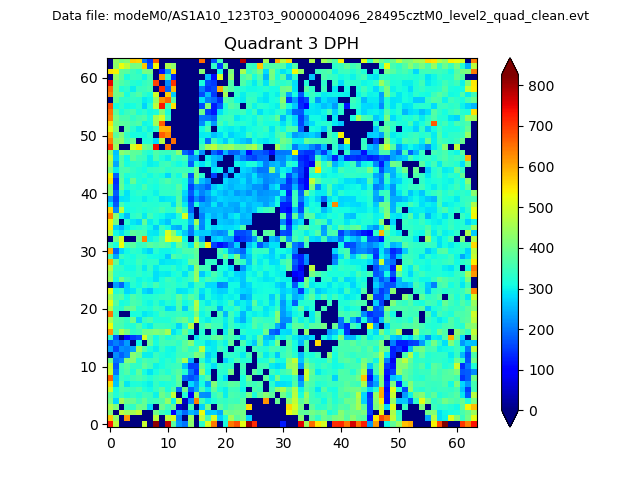 |
 |
Quadrant C |
| Plot type | Count rate plots | Images |
|---|---|---|
| Comparison with Poisson distribution Blue bars denote a histogram of data divided into 1 sec bins. Red curve is a Poisson curve with rate = median count rate of data. |
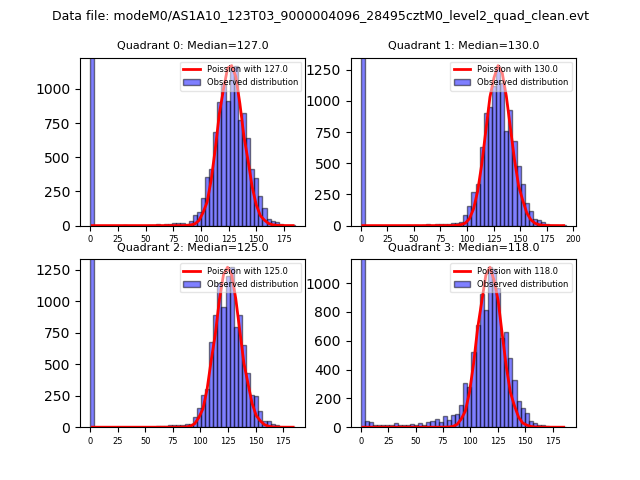 |
 |
| Quadrant-wise count rates Data is divided into 100 sec bins |
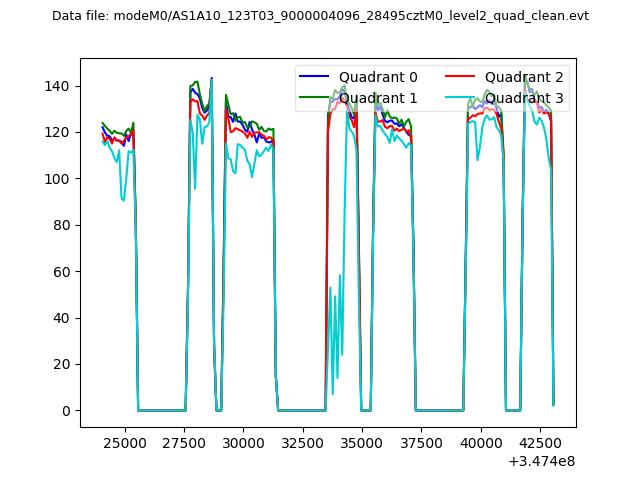 |
|
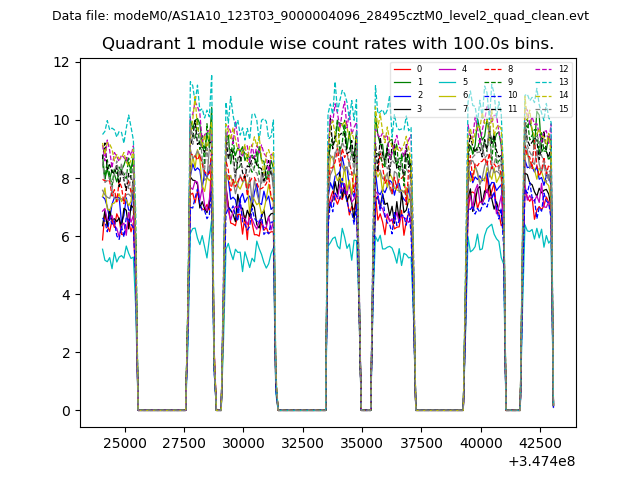
| Module-wise count rates for Quadrant A Data is divided into 100 sec bins |
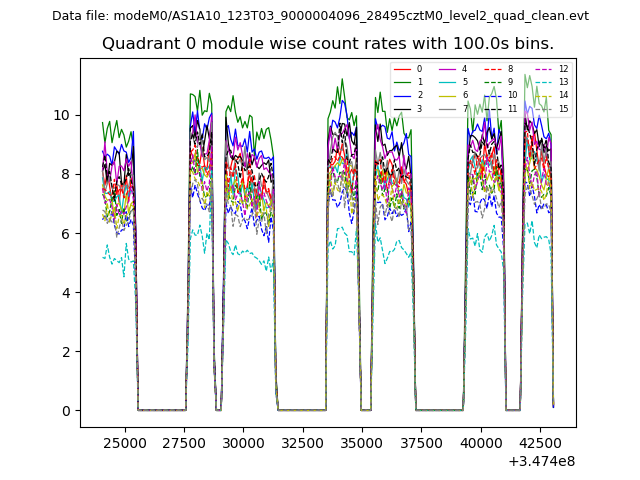 |
 |
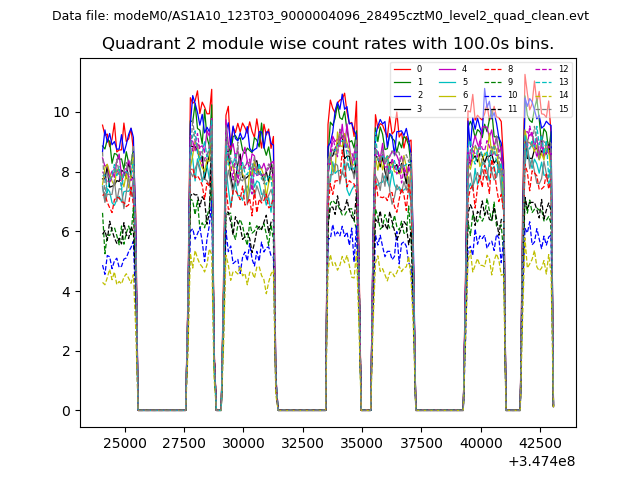
| Module-wise count rates for Quadrant B Data is divided into 100 sec bins |
 |
 |
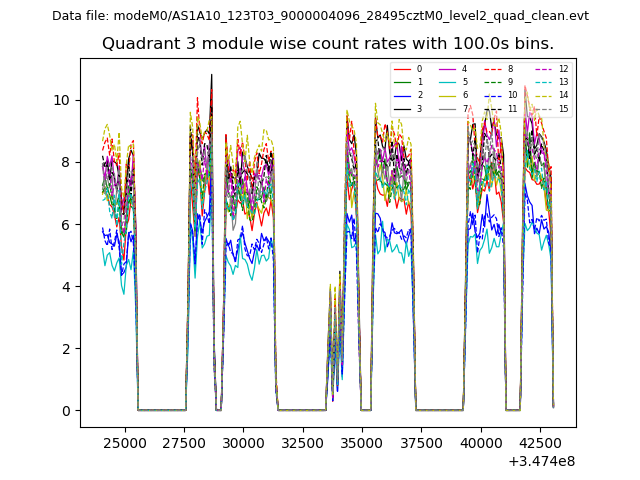
| Module-wise count rates for Quadrant C Data is divided into 100 sec bins |
 |
 |
| Module-wise count rates for Quadrant D Data is divided into 100 sec bins |
 |
 |
| Parameter | Plot |
|---|---|
| CZT HV Monitor | 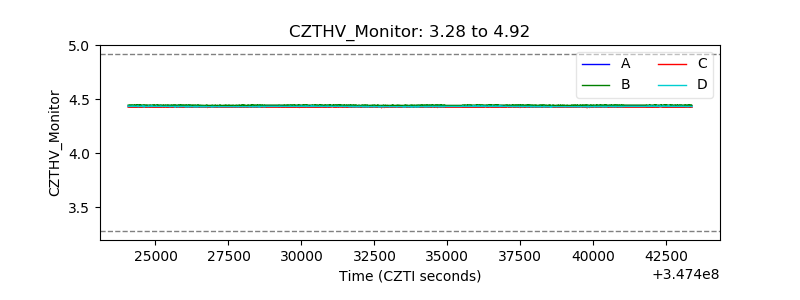 |
| D_VDD | 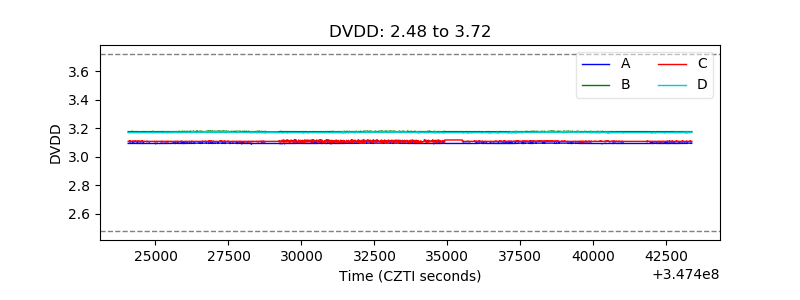 |
| Temperature 1 | 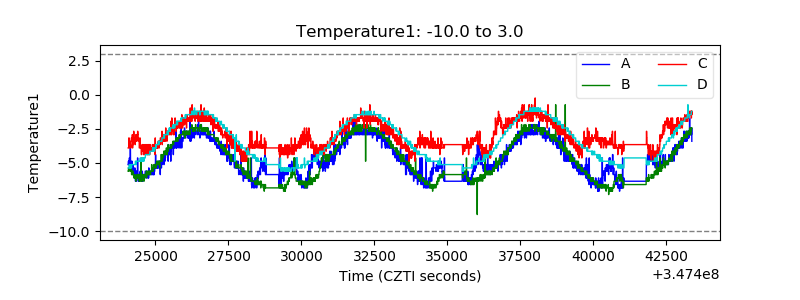 |
| Veto HV Monitor | 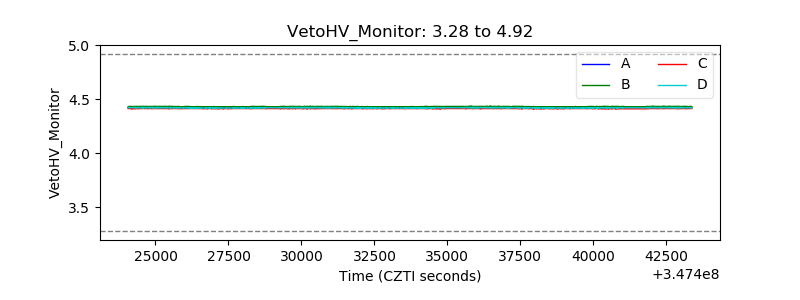 |
| Veto LLD |  |
| Alpha Counter | 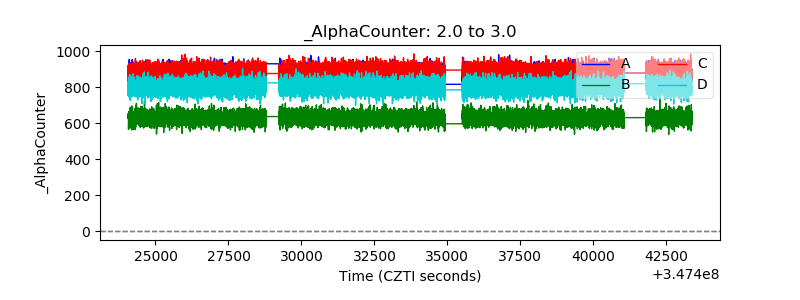 |
| _CPM_Rate | 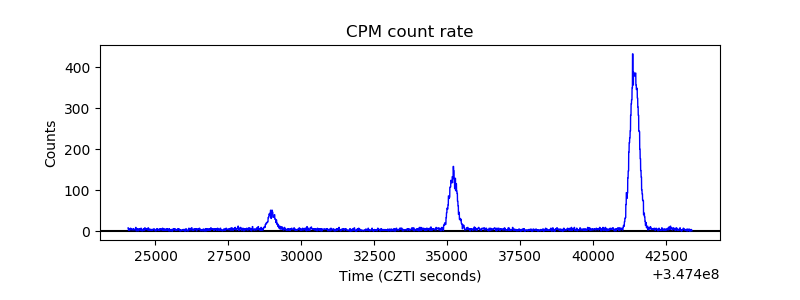 |
| CZT Counter | 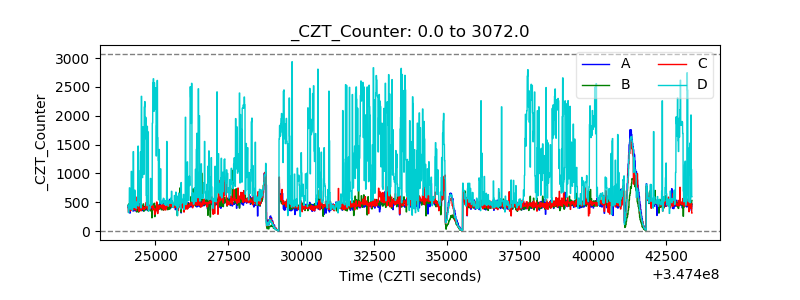 |
| +2.5 Volts monitor |  |
| +5 Volts monitor | 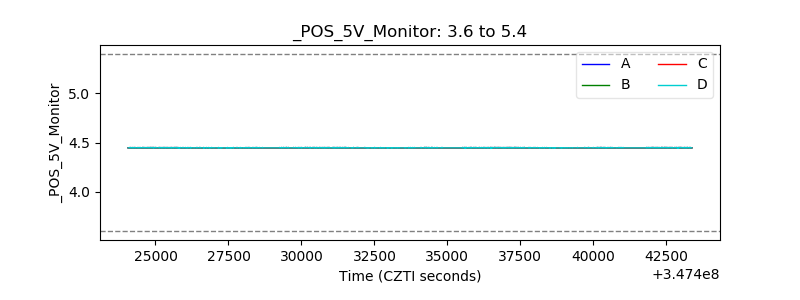 |
| _ROLL_ROT | 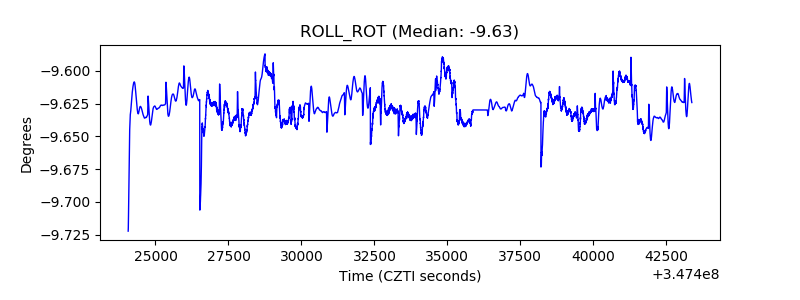 |
| _Roll_DEC | 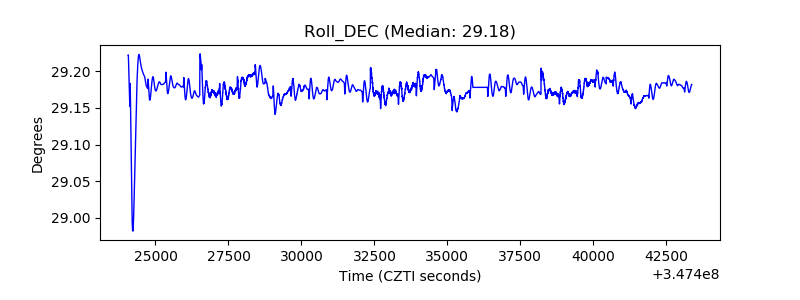 |
| _Roll_RA | 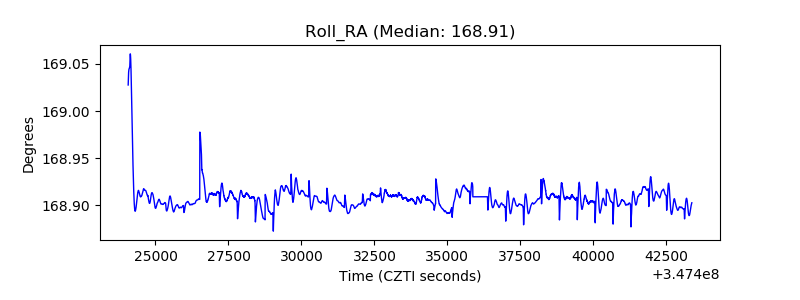 |
| Veto Counter | 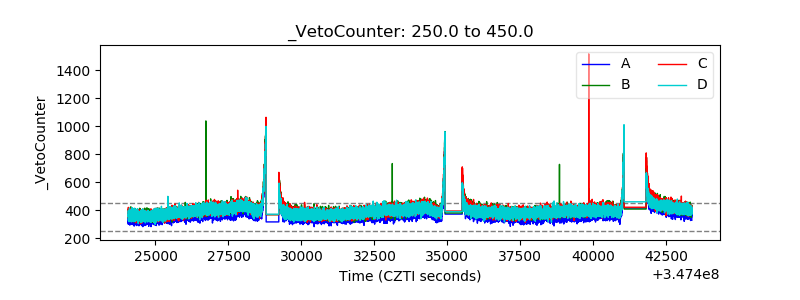 |