| Param | Original file | Final file |
|---|---|---|
| Filename | modeM0/AS1A10_123T03_9000004096_28496cztM0_level2.evt | modeM0/AS1A10_123T03_9000004096_28496cztM0_level2_quad_clean.evt |
| Size (bytes) | 547,470,720 | 76,953,600 |
| Size | 522.1 MB | 73.4 MB |
| Events in quadrant A | 3,079,637 | 484,178 |
| Events in quadrant B | 3,194,290 | 493,409 |
| Events in quadrant C | 3,106,194 | 475,129 |
| Events in quadrant D | 6,769,561 | 434,363 |
| Mode M0 | |||
|---|---|---|---|
| Quadrant | BADHDUFLAG | Total packets | Discarded packets |
| A | 0 | 13103 | 1 |
| B | 0 | 13343 | 1 |
| C | 0 | 13011 | 1 |
| D | 0 | 24272 | 1 |
| Mode M9 | |||
|---|---|---|---|
| Quadrant | BADHDUFLAG | Total packets | Discarded packets |
| A | 0 | 9 | 0 |
| B | 0 | 9 | 0 |
| C | 0 | 9 | 0 |
| D | 0 | 9 | 0 |
| Mode SS | |||
|---|---|---|---|
| Quadrant | BADHDUFLAG | Total packets | Discarded packets |
| A | 0 | 130 | 0 |
| B | 0 | 130 | 0 |
| C | 0 | 130 | 0 |
| D | 0 | 130 | 0 |
| Quadrant | Total seconds | Saturated seconds | Saturation percentage |
|---|---|---|---|
| A | 6344 | 60 | 0.945776% |
| B | 6343 | 88 | 1.387356% |
| C | 6343 | 79 | 1.245467% |
| D | 6344 | 1145 | 18.048550% |
Noise dominated data is calculated using 1-second bins in cleaned event files. If a bin has >2000 counts, and if more than 50% of those come from <1% of pixels, then it is considered to be noise-dominated and hence unusable.
| Quadrant | # 1 sec bins | Bins with >0 counts | Bins with >2000 counts | High rate bins dominated by noise | Noise dominated (total time) | Noise dominated (detector-on time) | Marked lightcurve |
|---|---|---|---|---|---|---|---|
| A | 7269 | 6344 | 2 | 2 | 0.03% | 0.03% | 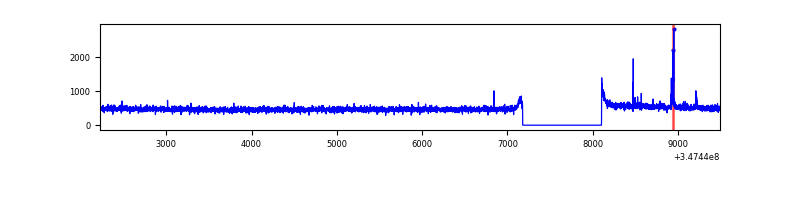 |
| B | 7268 | 6343 | 21 | 21 | 0.29% | 0.33% | 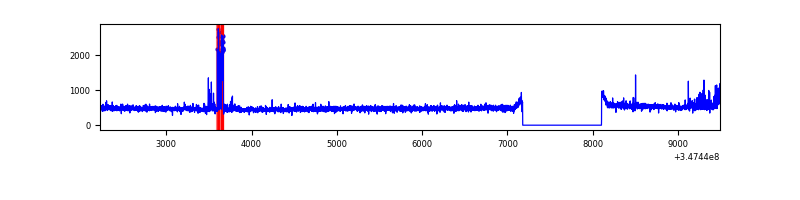 |
| C | 7268 | 6343 | 0 | 0 | 0.00% | 0.00% | 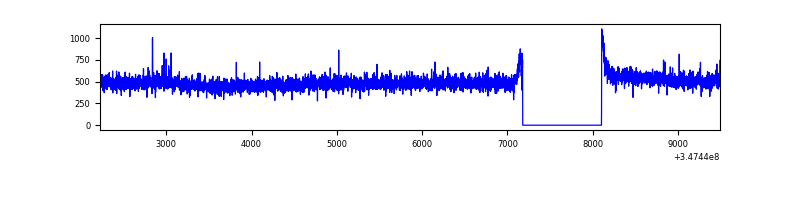 |
| D | 7269 | 6344 | 1127 | 1127 | 15.50% | 17.76% | 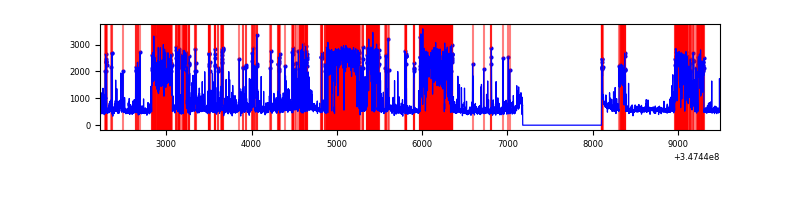 |
Top three noisy pixels from each quadrant. If the there are fewer than three noisy pixels in the level2.evt file, extra rows are filled as -1
| Pixel properties | Quadrant properties | ||||||
|---|---|---|---|---|---|---|---|
| Quadrant | DetID | PixID | Counts | Sigma | Mean | Median | Sigma |
| A | 12 | 96 | 31747 | 194.79 | 789 | 773 | 159.0 |
| A | 13 | 254 | 10662 | 62.19 | 789 | 773 | 159.0 |
| A | 3 | 137 | 7652 | 43.26 | 789 | 773 | 159.0 |
| B | 14 | 207 | 94546 | 625.97 | 778 | 758 | 149.8 |
| B | 0 | 230 | 38636 | 252.81 | 778 | 758 | 149.8 |
| B | 12 | 111 | 18711 | 119.82 | 778 | 758 | 149.8 |
| C | 14 | 238 | 122349 | 682.47 | 758 | 762 | 178.2 |
| C | 3 | 233 | 23486 | 127.55 | 758 | 762 | 178.2 |
| C | 7 | 247 | 6520 | 32.32 | 758 | 762 | 178.2 |
| D | 1 | 52 | 2348694 | 13788.94 | 710 | 692 | 170.3 |
| D | 8 | 195 | 1015358 | 5958.75 | 710 | 692 | 170.3 |
| D | 12 | 233 | 576736 | 3382.89 | 710 | 692 | 170.3 |
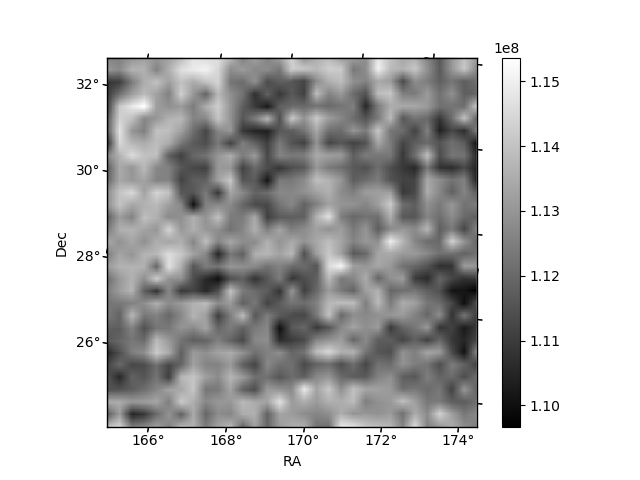
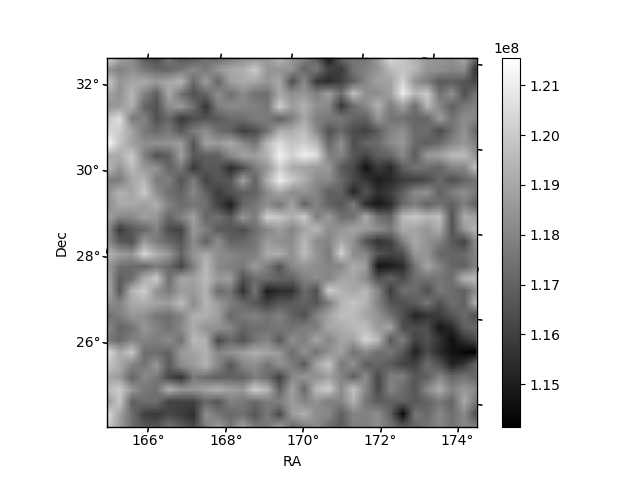
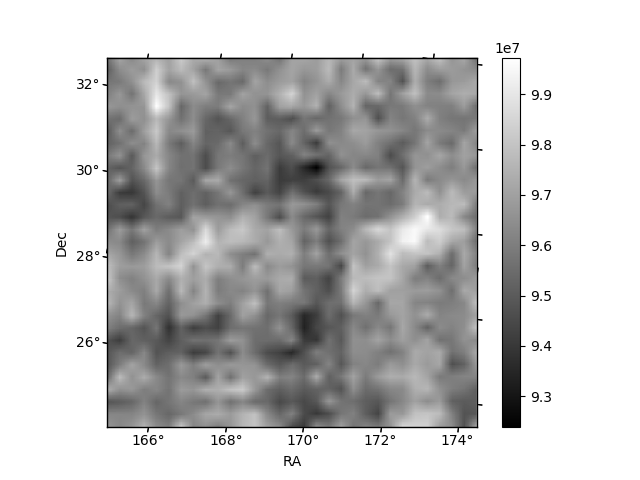
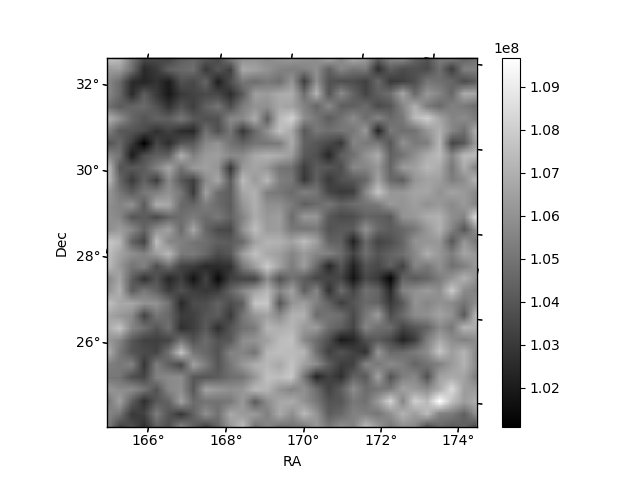
Histogram calculated using DETX and DETY for each event in the final _common_clean file
| Quadrant A | 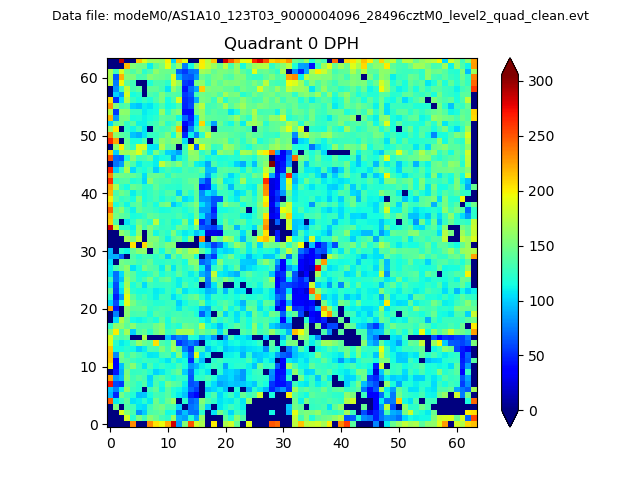 |
 |
Quadrant B |
|---|---|---|---|
| Quadrant D |  |
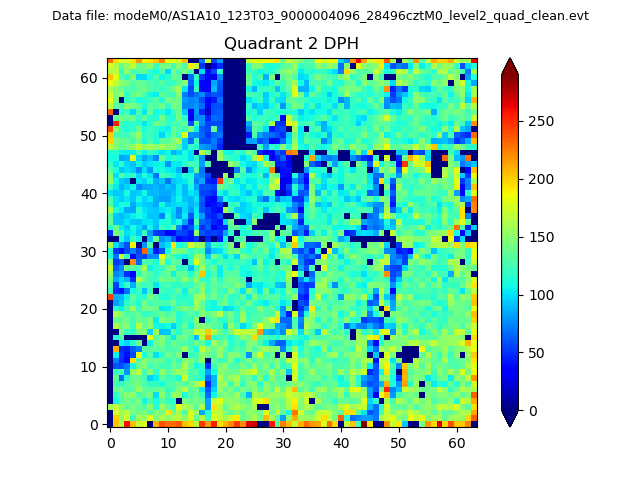 |
Quadrant C |
| Plot type | Count rate plots | Images |
|---|---|---|
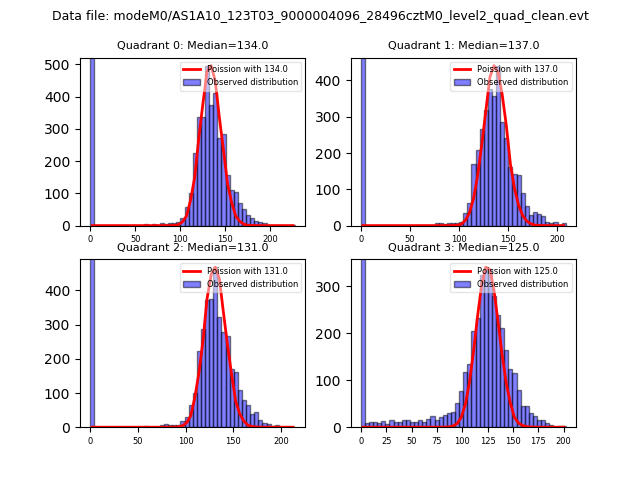
| Comparison with Poisson distribution Blue bars denote a histogram of data divided into 1 sec bins. Red curve is a Poisson curve with rate = median count rate of data. |
 |
 |
| Quadrant-wise count rates Data is divided into 100 sec bins |
 |
|
| Module-wise count rates for Quadrant A Data is divided into 100 sec bins |
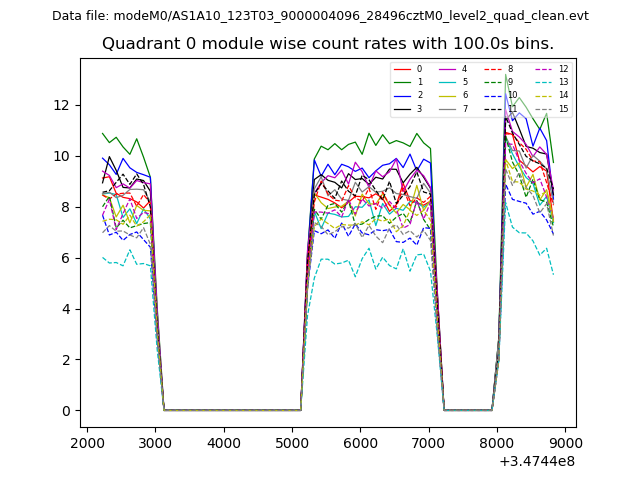 |
 |
| Module-wise count rates for Quadrant B Data is divided into 100 sec bins |
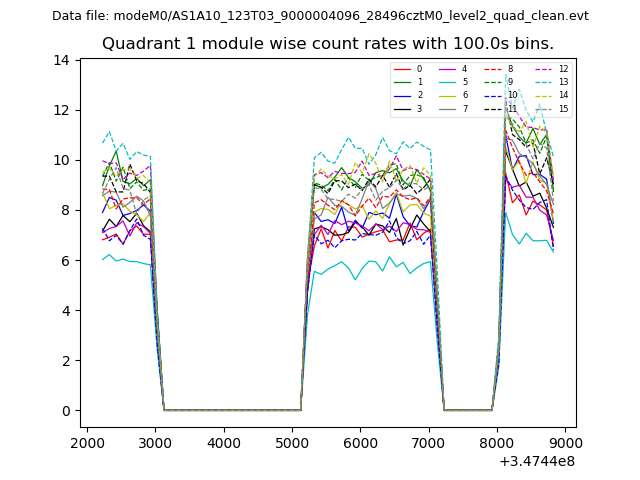 |
 |
| Module-wise count rates for Quadrant C Data is divided into 100 sec bins |
 |
 |
| Module-wise count rates for Quadrant D Data is divided into 100 sec bins |
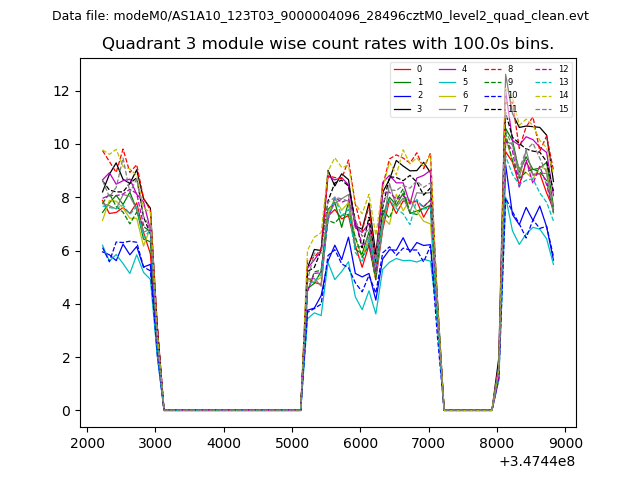 |
 |
| Parameter | Plot |
|---|---|
| CZT HV Monitor | 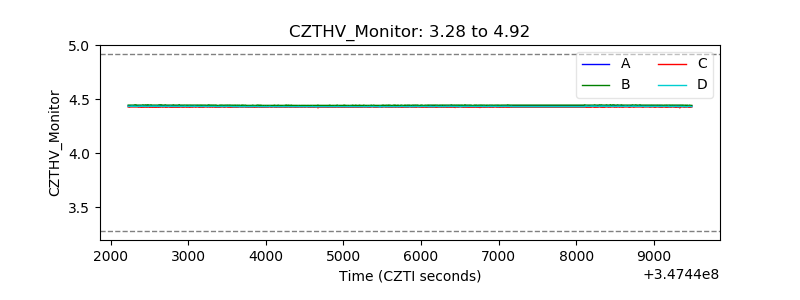 |
| D_VDD | 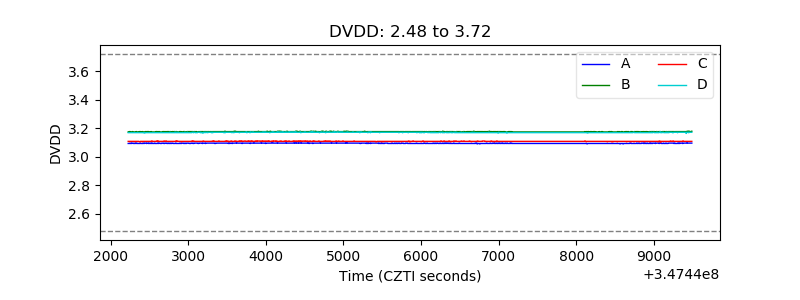 |
| Temperature 1 | 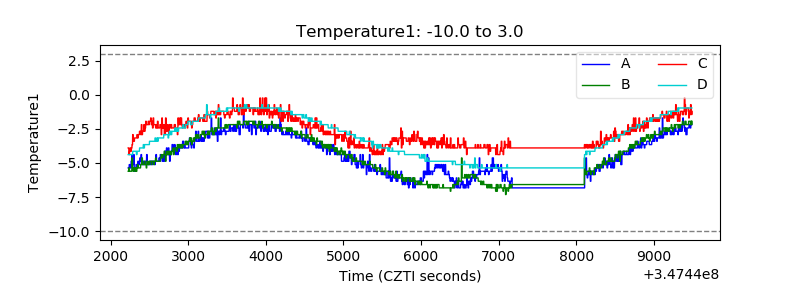 |
| Veto HV Monitor | 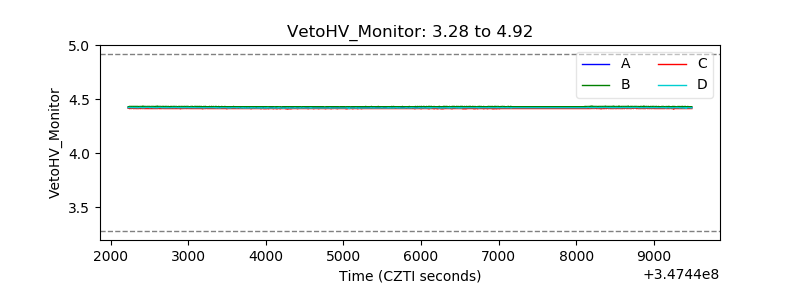 |
| Veto LLD | 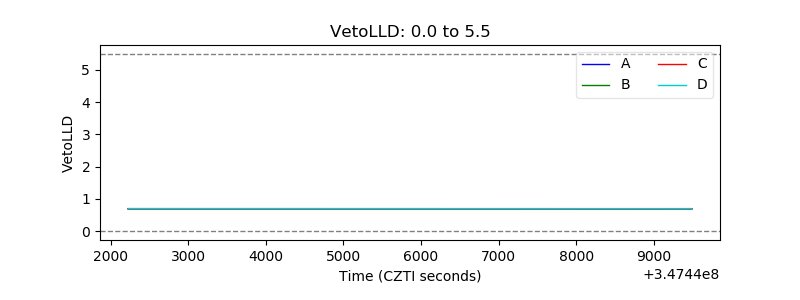 |
| Alpha Counter | 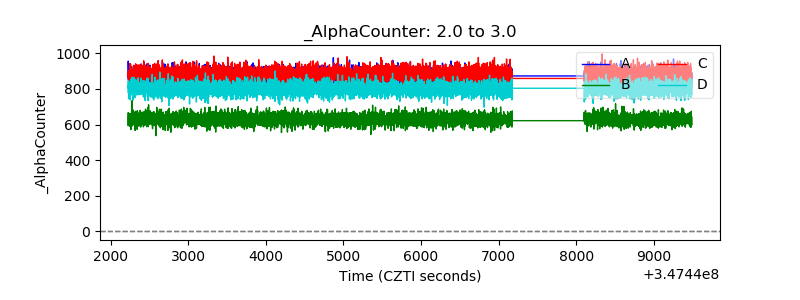 |
| _CPM_Rate | 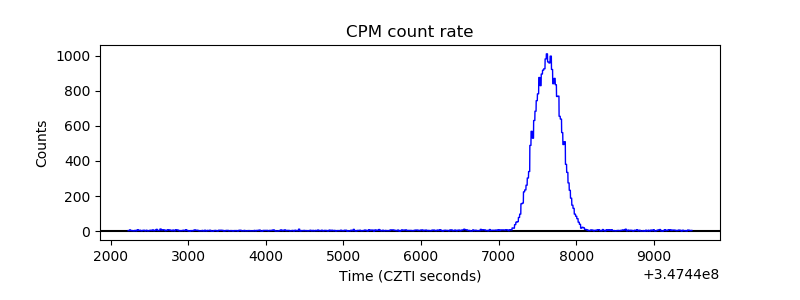 |
| CZT Counter | 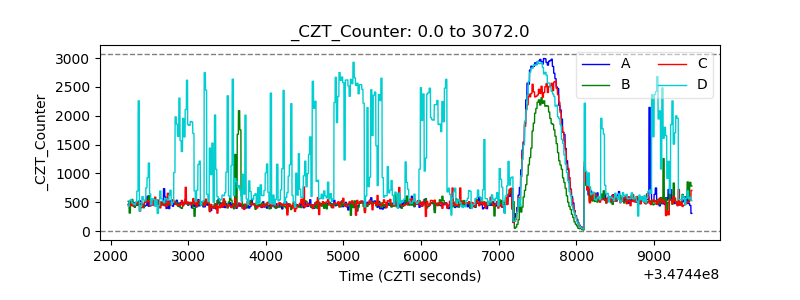 |
| +2.5 Volts monitor |  |
| +5 Volts monitor |  |
| _ROLL_ROT | 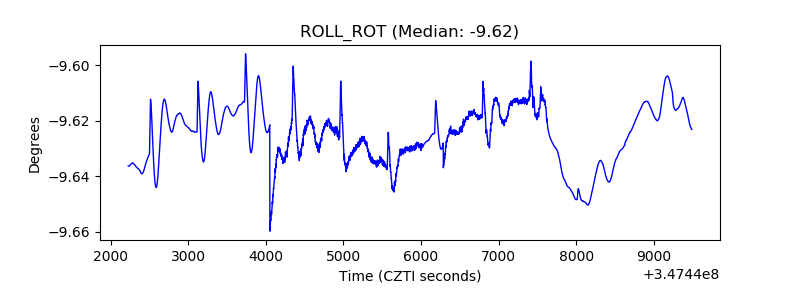 |
| _Roll_DEC | 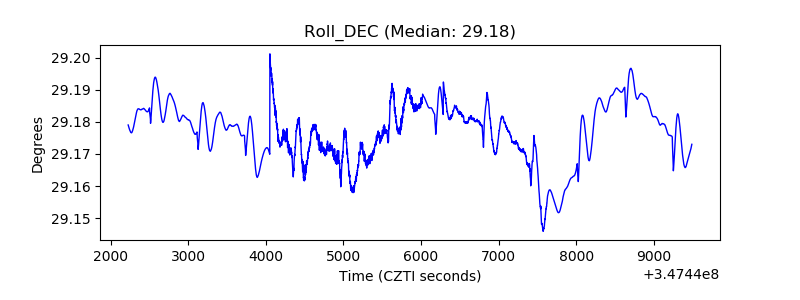 |
| _Roll_RA | 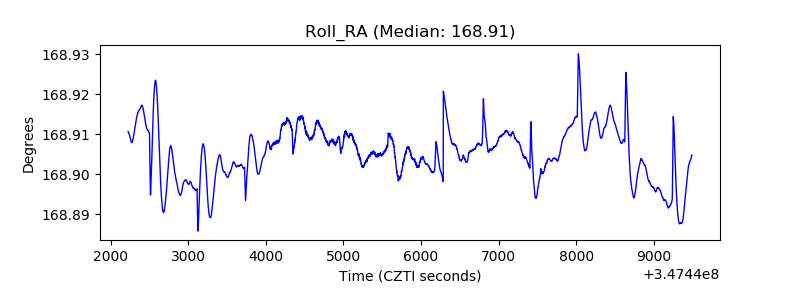 |
| Veto Counter |  |