| Param | Original file | Final file |
|---|---|---|
| Filename | modeM0/AS1A10_123T03_9000004096_28498cztM0_level2.evt | modeM0/AS1A10_123T03_9000004096_28498cztM0_level2_quad_clean.evt |
| Size (bytes) | 548,196,480 | 65,816,640 |
| Size | 522.8 MB | 62.8 MB |
| Events in quadrant A | 3,176,533 | 394,783 |
| Events in quadrant B | 3,403,470 | 400,436 |
| Events in quadrant C | 3,213,136 | 385,877 |
| Events in quadrant D | 6,383,423 | 373,536 |
| Mode M0 | |||
|---|---|---|---|
| Quadrant | BADHDUFLAG | Total packets | Discarded packets |
| A | 0 | 13354 | 1 |
| B | 0 | 14123 | 1 |
| C | 0 | 13321 | 1 |
| D | 0 | 23110 | 1 |
| Mode M9 | |||
|---|---|---|---|
| Quadrant | BADHDUFLAG | Total packets | Discarded packets |
| A | 0 | 11 | 0 |
| B | 0 | 11 | 0 |
| C | 0 | 11 | 0 |
| D | 0 | 11 | 0 |
| Mode SS | |||
|---|---|---|---|
| Quadrant | BADHDUFLAG | Total packets | Discarded packets |
| A | 0 | 128 | 0 |
| B | 0 | 128 | 0 |
| C | 0 | 128 | 0 |
| D | 0 | 128 | 0 |
| Quadrant | Total seconds | Saturated seconds | Saturation percentage |
|---|---|---|---|
| A | 6274 | 48 | 0.765062% |
| B | 6274 | 56 | 0.892573% |
| C | 6274 | 86 | 1.370736% |
| D | 6275 | 1053 | 16.780876% |
Noise dominated data is calculated using 1-second bins in cleaned event files. If a bin has >2000 counts, and if more than 50% of those come from <1% of pixels, then it is considered to be noise-dominated and hence unusable.
| Quadrant | # 1 sec bins | Bins with >0 counts | Bins with >2000 counts | High rate bins dominated by noise | Noise dominated (total time) | Noise dominated (detector-on time) | Marked lightcurve |
|---|---|---|---|---|---|---|---|
| A | 7369 | 6274 | 2 | 2 | 0.03% | 0.03% | 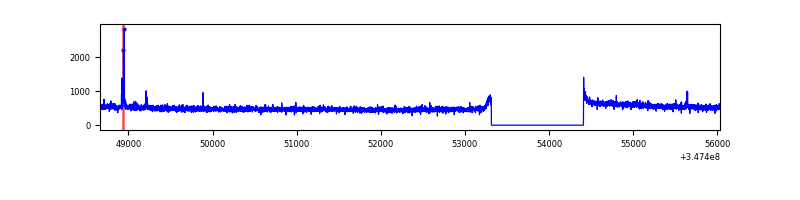 |
| B | 7369 | 6274 | 10 | 10 | 0.14% | 0.16% | 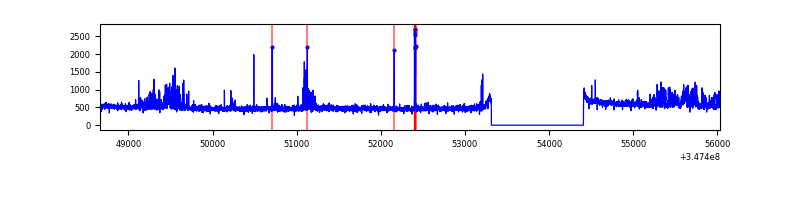 |
| C | 7369 | 6274 | 0 | 0 | 0.00% | 0.00% | 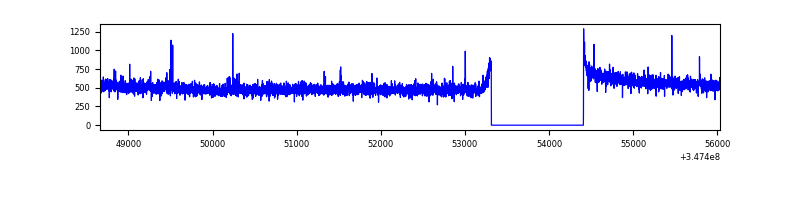 |
| D | 7370 | 6275 | 996 | 996 | 13.51% | 15.87% | 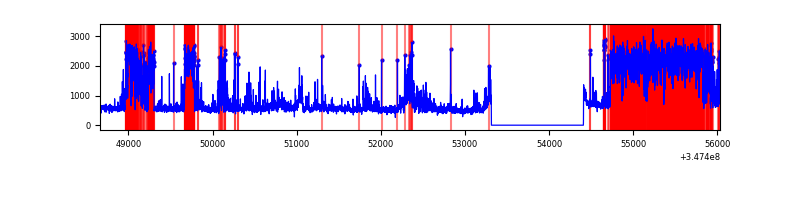 |
Top three noisy pixels from each quadrant. If the there are fewer than three noisy pixels in the level2.evt file, extra rows are filled as -1
| Pixel properties | Quadrant properties | ||||||
|---|---|---|---|---|---|---|---|
| Quadrant | DetID | PixID | Counts | Sigma | Mean | Median | Sigma |
| A | 12 | 96 | 29078 | 173.21 | 815 | 800 | 163.3 |
| A | 13 | 254 | 11878 | 67.85 | 815 | 800 | 163.3 |
| A | 3 | 137 | 7615 | 41.74 | 815 | 800 | 163.3 |
| B | 0 | 230 | 189360 | 1246.41 | 801 | 782 | 151.3 |
| B | 5 | 255 | 35436 | 229.04 | 801 | 782 | 151.3 |
| B | 15 | 33 | 28890 | 185.78 | 801 | 782 | 151.3 |
| C | 14 | 238 | 128600 | 702.37 | 781 | 785 | 182.0 |
| C | 3 | 233 | 28148 | 150.37 | 781 | 785 | 182.0 |
| C | 7 | 247 | 13368 | 69.15 | 781 | 785 | 182.0 |
| D | 8 | 195 | 1991008 | 10930.98 | 755 | 735 | 182.1 |
| D | 1 | 52 | 869129 | 4769.39 | 755 | 735 | 182.1 |
| D | 12 | 233 | 367991 | 2017.04 | 755 | 735 | 182.1 |
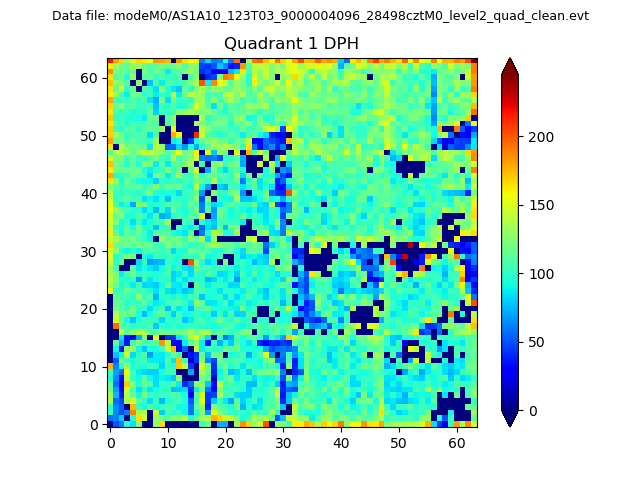
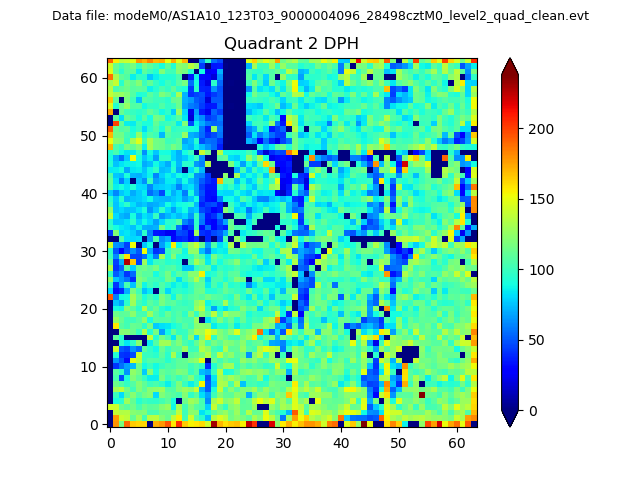
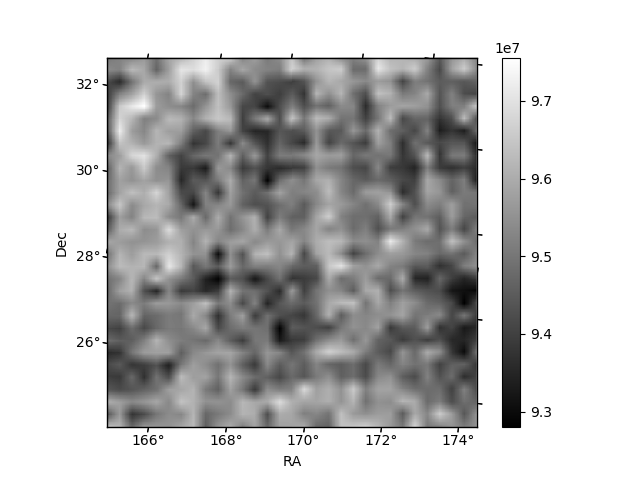
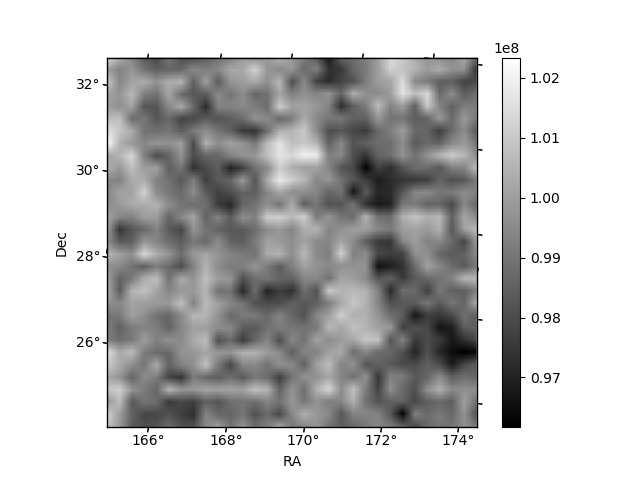
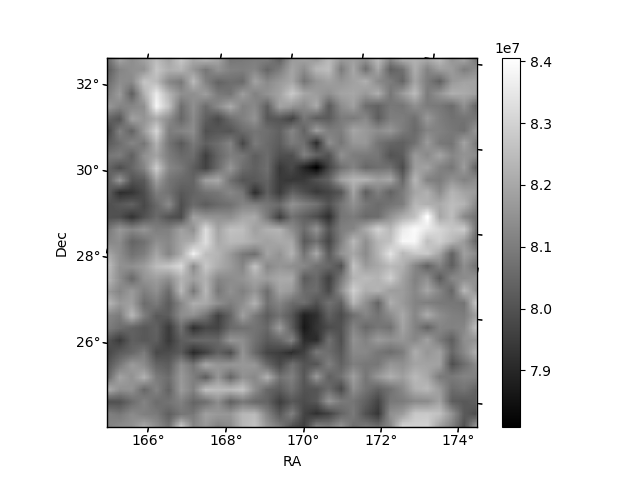
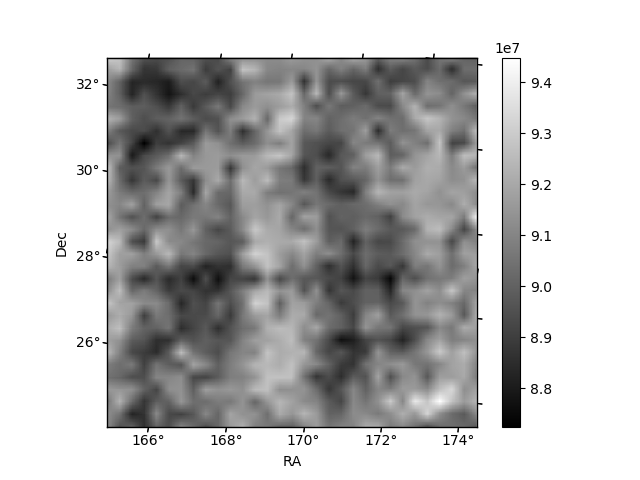
Histogram calculated using DETX and DETY for each event in the final _common_clean file
| Quadrant A |  |
 |
Quadrant B |
|---|---|---|---|
| Quadrant D |  |
 |
Quadrant C |
| Plot type | Count rate plots | Images |
|---|---|---|
| Comparison with Poisson distribution Blue bars denote a histogram of data divided into 1 sec bins. Red curve is a Poisson curve with rate = median count rate of data. |
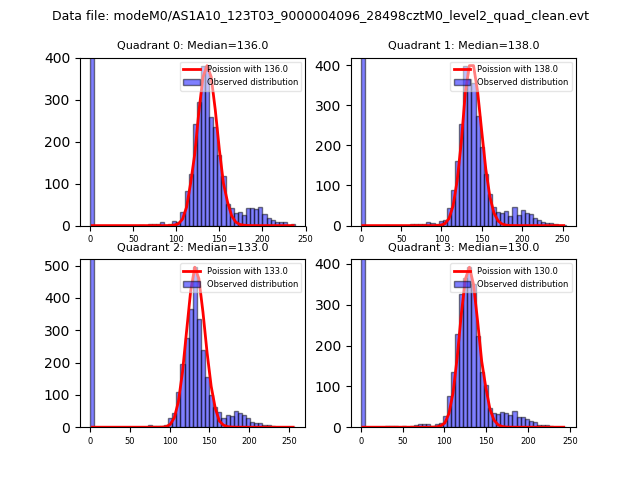 |
 |
| Quadrant-wise count rates Data is divided into 100 sec bins |
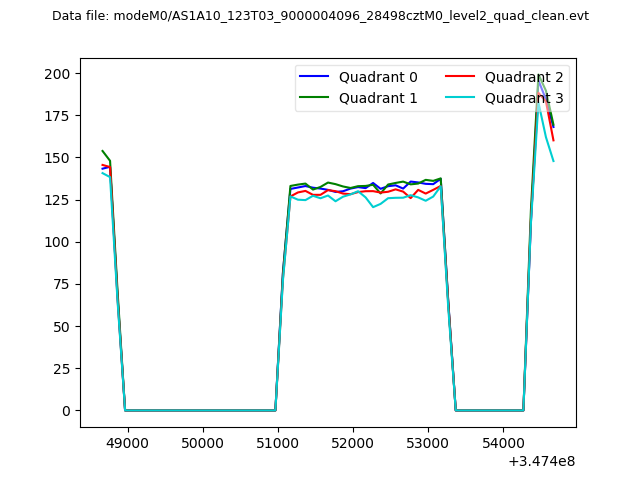 |
|
| Module-wise count rates for Quadrant A Data is divided into 100 sec bins |
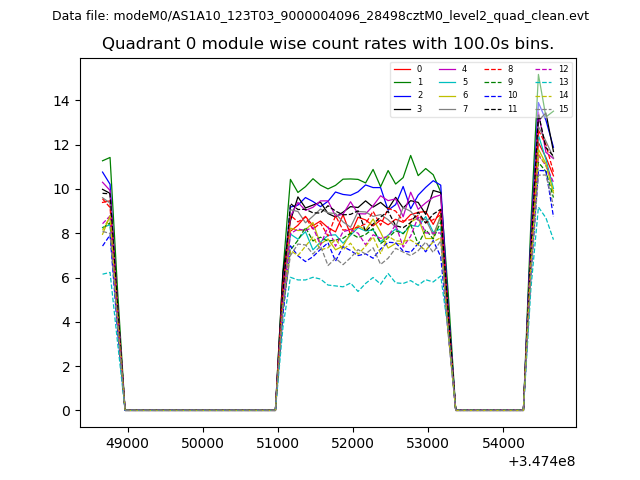 |
 |
| Module-wise count rates for Quadrant B Data is divided into 100 sec bins |
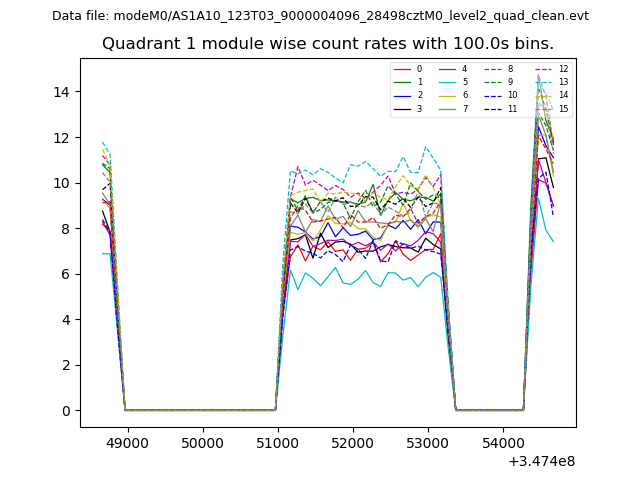 |
 |
| Module-wise count rates for Quadrant C Data is divided into 100 sec bins |
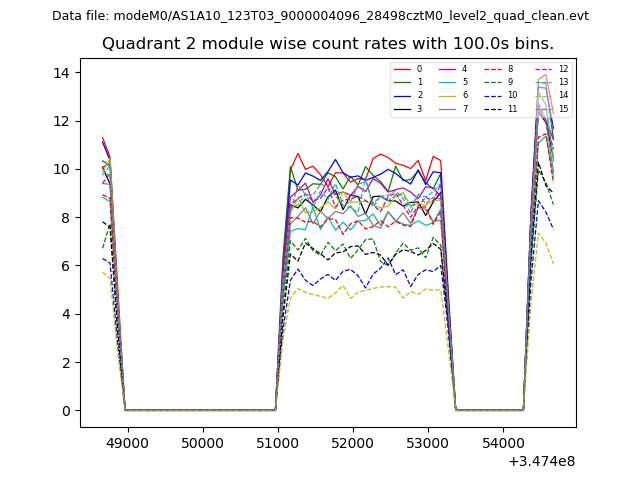 |
 |
| Module-wise count rates for Quadrant D Data is divided into 100 sec bins |
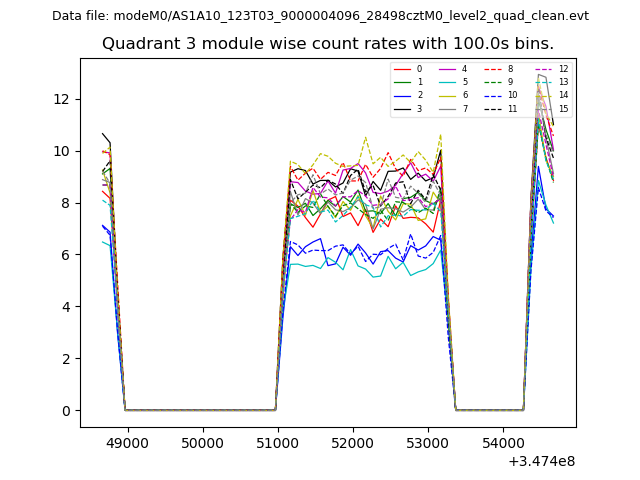 |
 |
| Parameter | Plot |
|---|---|
| CZT HV Monitor | 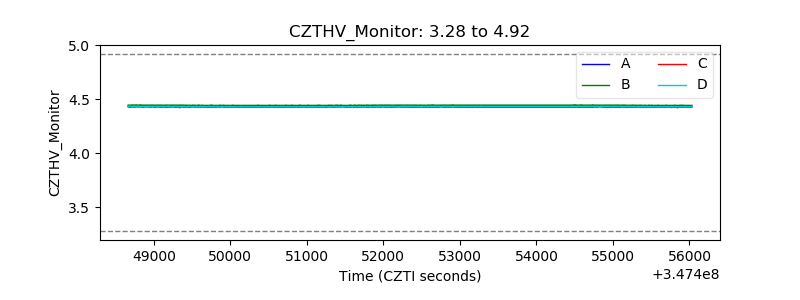 |
| D_VDD | 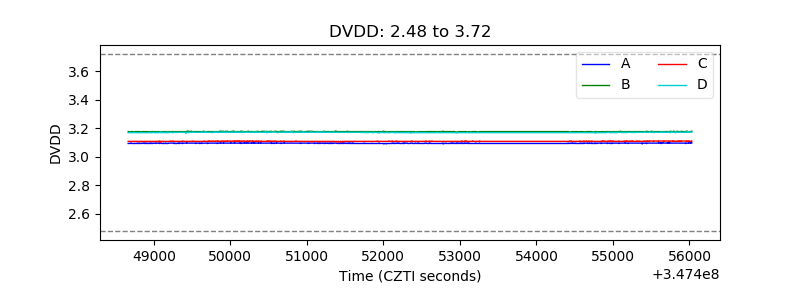 |
| Temperature 1 | 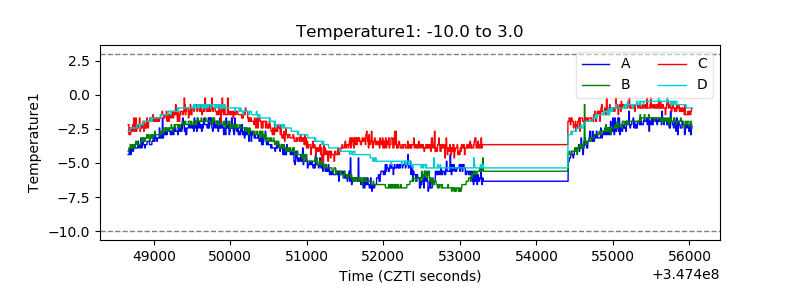 |
| Veto HV Monitor | 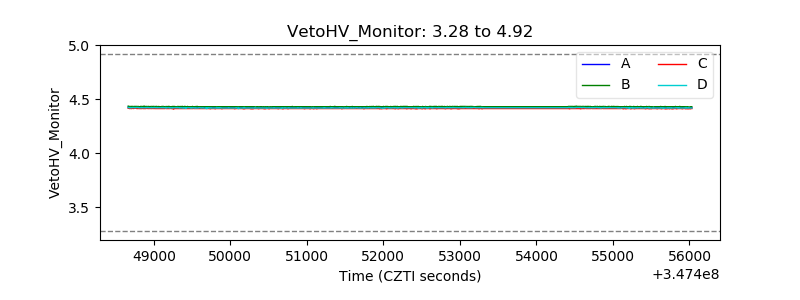 |
| Veto LLD | 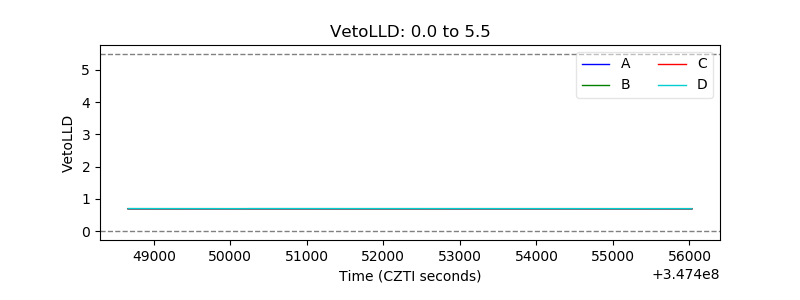 |
| Alpha Counter | 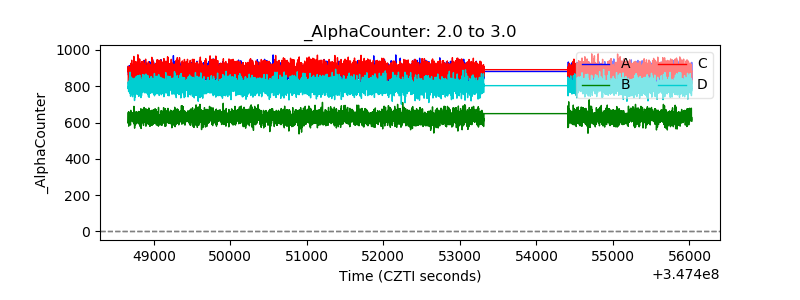 |
| _CPM_Rate | 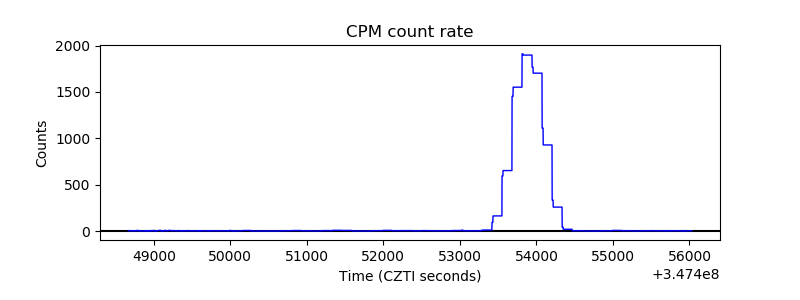 |
| CZT Counter | 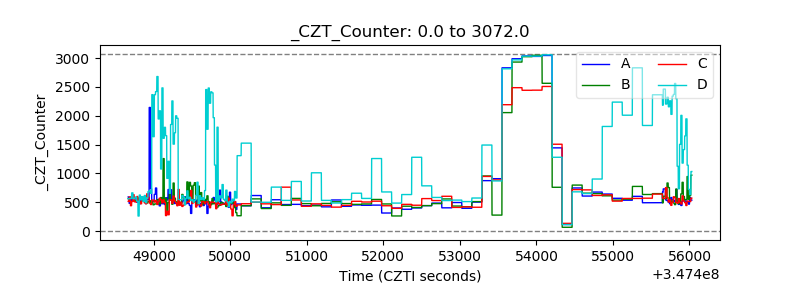 |
| +2.5 Volts monitor |  |
| +5 Volts monitor |  |
| _ROLL_ROT | 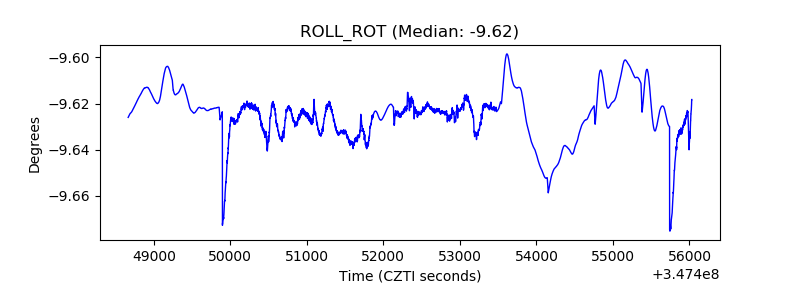 |
| _Roll_DEC | 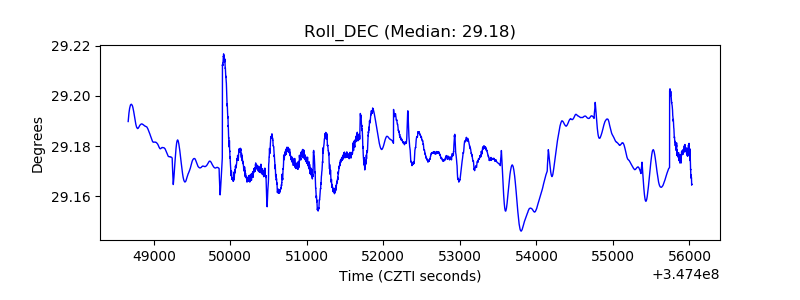 |
| _Roll_RA | 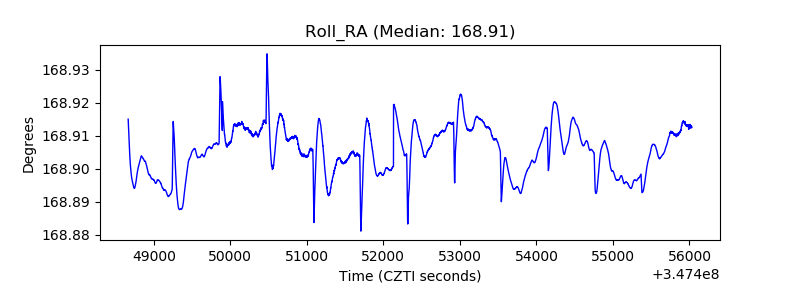 |
| Veto Counter | 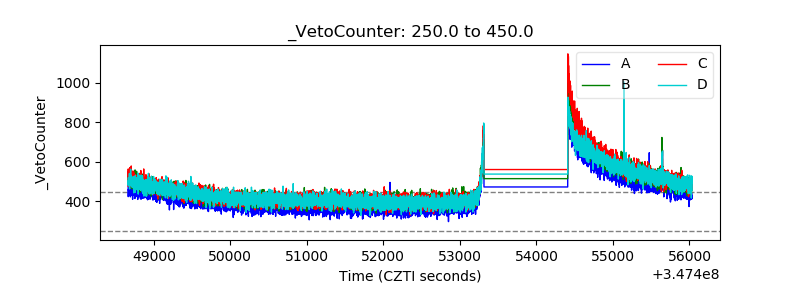 |