| Param | Original file | Final file |
|---|---|---|
| Filename | modeM0/AS1A10_123T03_9000004096_28502cztM0_level2.evt | modeM0/AS1A10_123T03_9000004096_28502cztM0_level2_quad_clean.evt |
| Size (bytes) | 308,390,400 | 40,178,880 |
| Size | 294.1 MB | 38.3 MB |
| Events in quadrant A | 1,641,323 | 253,470 |
| Events in quadrant B | 1,860,696 | 258,424 |
| Events in quadrant C | 1,711,736 | 254,896 |
| Events in quadrant D | 3,920,977 | 235,377 |
| Mode M0 | |||
|---|---|---|---|
| Quadrant | BADHDUFLAG | Total packets | Discarded packets |
| A | 0 | 6854 | 0 |
| B | 0 | 7580 | 0 |
| C | 0 | 7125 | 0 |
| D | 0 | 13719 | 0 |
| Mode M9 | |||
|---|---|---|---|
| Quadrant | BADHDUFLAG | Total packets | Discarded packets |
| A | 0 | 10 | 0 |
| B | 0 | 11 | 0 |
| C | 0 | 11 | 0 |
| D | 0 | 11 | 0 |
| Mode SS | |||
|---|---|---|---|
| Quadrant | BADHDUFLAG | Total packets | Discarded packets |
| A | 0 | 60 | 0 |
| B | 0 | 60 | 0 |
| C | 0 | 60 | 0 |
| D | 0 | 60 | 0 |
| Quadrant | Total seconds | Saturated seconds | Saturation percentage |
|---|---|---|---|
| A | 3002 | 12 | 0.399734% |
| B | 3002 | 41 | 1.365756% |
| C | 3002 | 58 | 1.932045% |
| D | 3002 | 821 | 27.348434% |
Noise dominated data is calculated using 1-second bins in cleaned event files. If a bin has >2000 counts, and if more than 50% of those come from <1% of pixels, then it is considered to be noise-dominated and hence unusable.
| Quadrant | # 1 sec bins | Bins with >0 counts | Bins with >2000 counts | High rate bins dominated by noise | Noise dominated (total time) | Noise dominated (detector-on time) | Marked lightcurve |
|---|---|---|---|---|---|---|---|
| A | 3002 | 3002 | 1 | 1 | 0.03% | 0.03% | 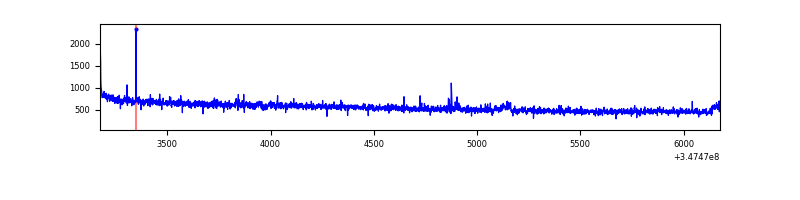 |
| B | 3002 | 3002 | 27 | 27 | 0.90% | 0.90% | 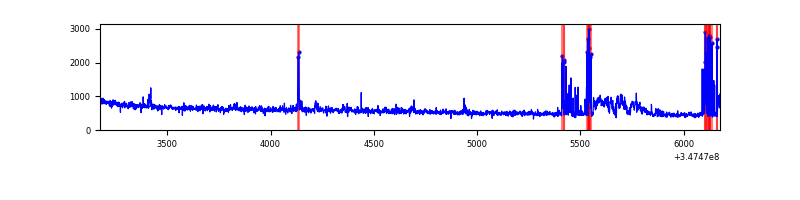 |
| C | 3002 | 3002 | 0 | 0 | 0.00% | 0.00% | 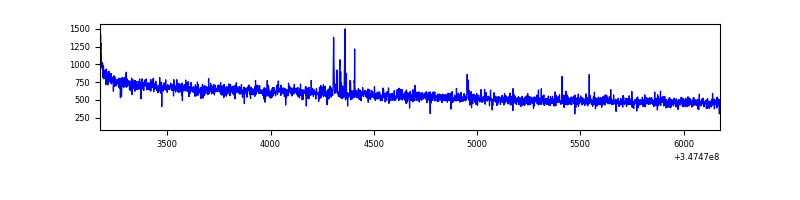 |
| D | 3002 | 3002 | 774 | 774 | 25.78% | 25.78% | 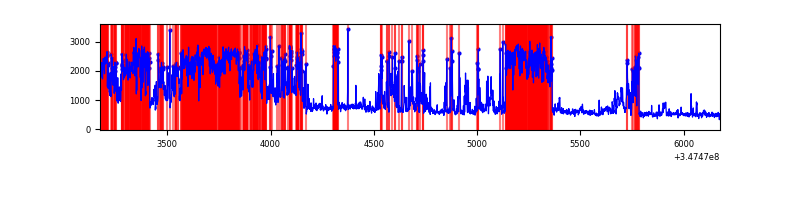 |
Top three noisy pixels from each quadrant. If the there are fewer than three noisy pixels in the level2.evt file, extra rows are filled as -1
| Pixel properties | Quadrant properties | ||||||
|---|---|---|---|---|---|---|---|
| Quadrant | DetID | PixID | Counts | Sigma | Mean | Median | Sigma |
| A | 15 | 174 | 18467 | 216.37 | 417 | 410 | 83.5 |
| A | 12 | 96 | 6896 | 77.72 | 417 | 410 | 83.5 |
| A | 13 | 254 | 5360 | 59.31 | 417 | 410 | 83.5 |
| B | 5 | 255 | 177619 | 2287.17 | 417 | 409 | 77.5 |
| B | 0 | 230 | 34505 | 440.06 | 417 | 409 | 77.5 |
| B | 0 | 182 | 8823 | 108.6 | 417 | 409 | 77.5 |
| C | 14 | 238 | 68516 | 717.0 | 414 | 419 | 95.0 |
| C | 7 | 247 | 15622 | 160.07 | 414 | 419 | 95.0 |
| C | 3 | 233 | 8013 | 79.96 | 414 | 419 | 95.0 |
| D | 1 | 52 | 1648223 | 18698.11 | 365 | 356 | 88.1 |
| D | 8 | 195 | 539783 | 6120.8 | 365 | 356 | 88.1 |
| D | 12 | 233 | 129413 | 1464.39 | 365 | 356 | 88.1 |
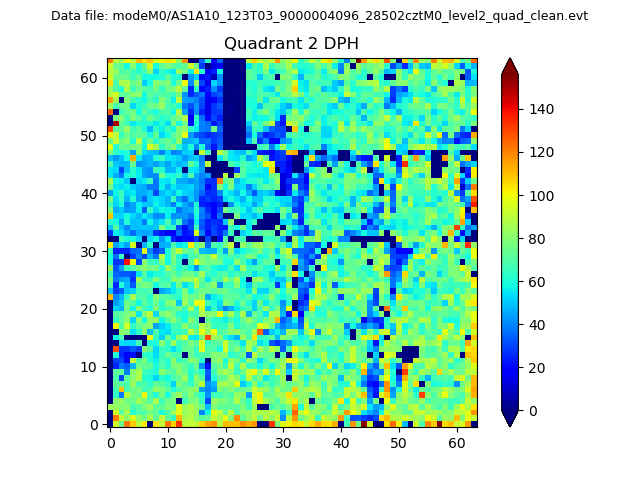
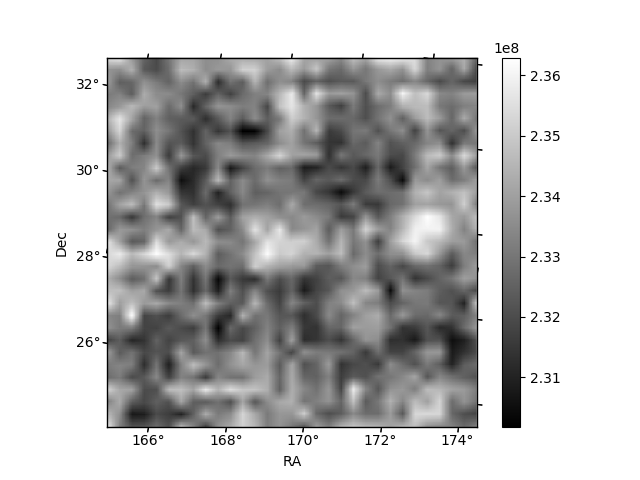
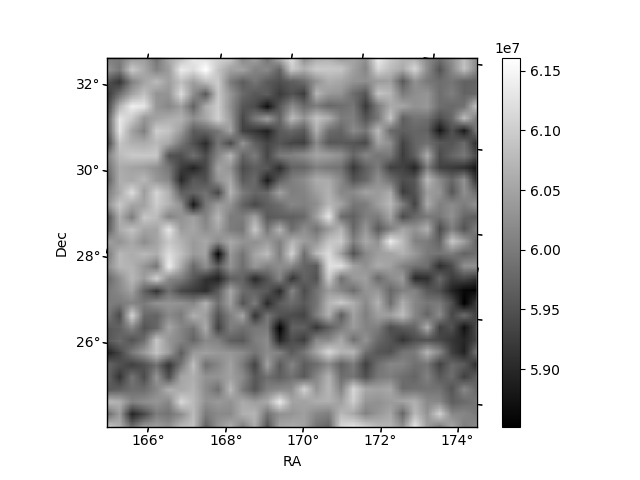
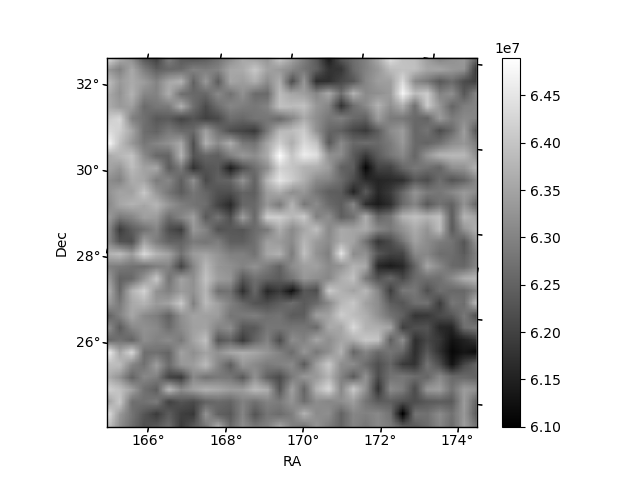
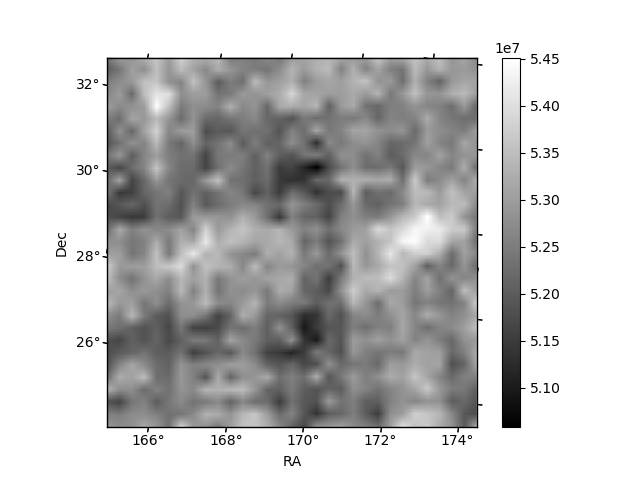
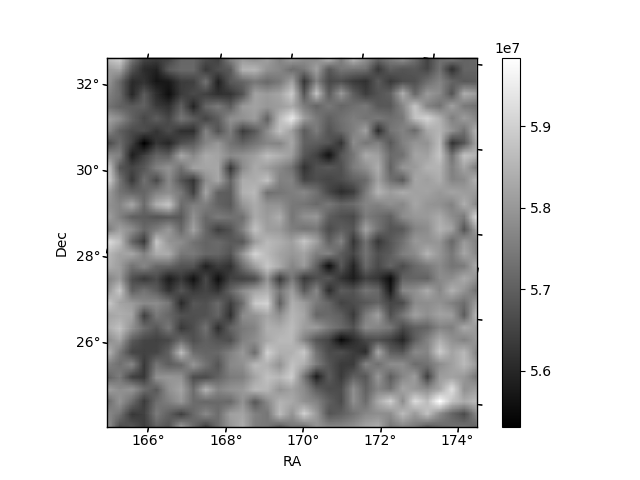
Histogram calculated using DETX and DETY for each event in the final _common_clean file
| Quadrant A | 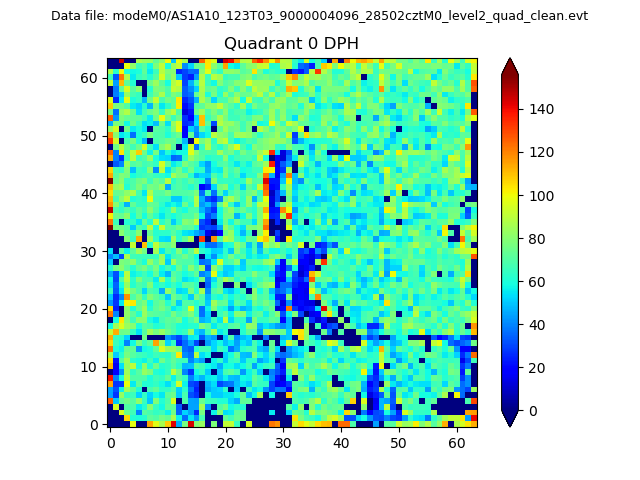 |
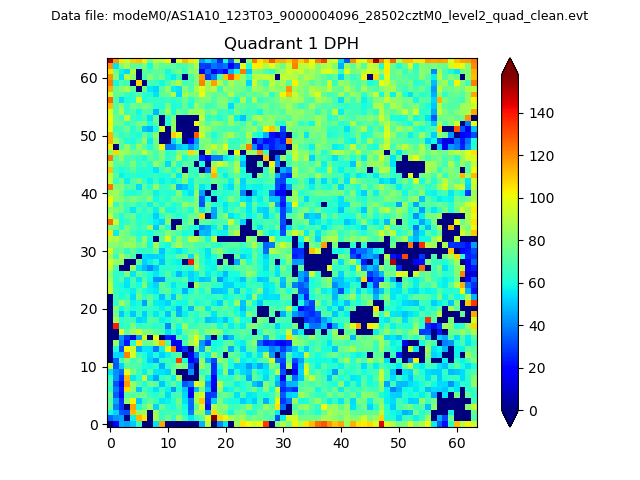 |
Quadrant B |
|---|---|---|---|
| Quadrant D | 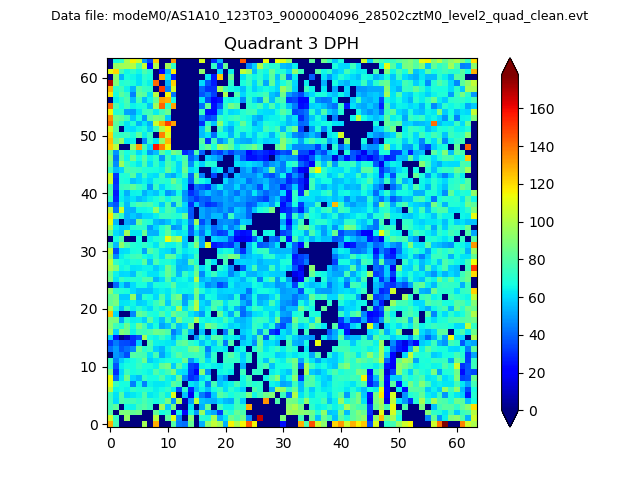 |
 |
Quadrant C |
| Plot type | Count rate plots | Images |
|---|---|---|
| Comparison with Poisson distribution Blue bars denote a histogram of data divided into 1 sec bins. Red curve is a Poisson curve with rate = median count rate of data. |
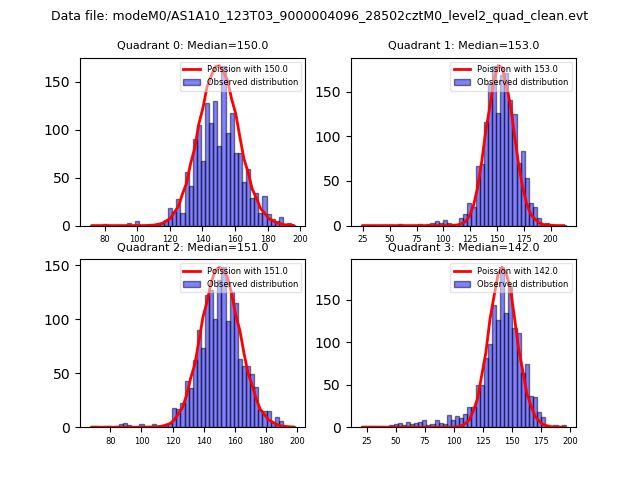 |
 |
| Quadrant-wise count rates Data is divided into 100 sec bins |
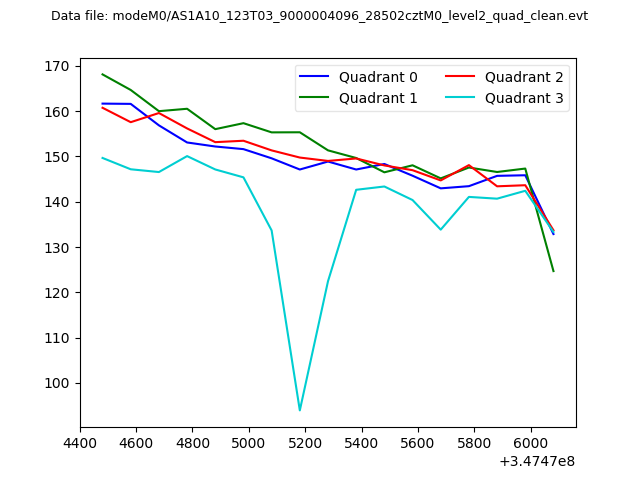 |
|
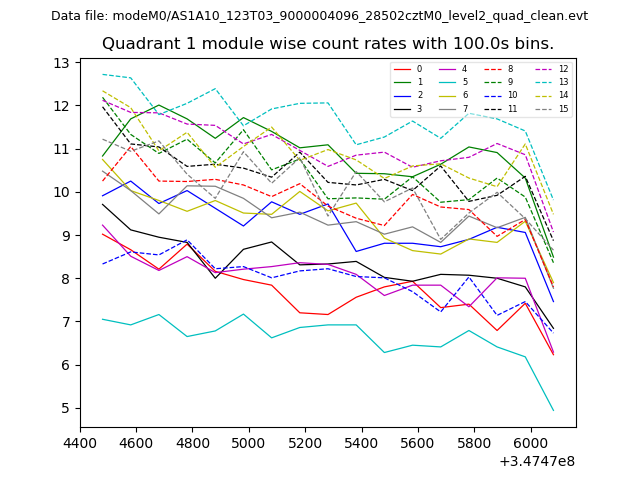
| Module-wise count rates for Quadrant A Data is divided into 100 sec bins |
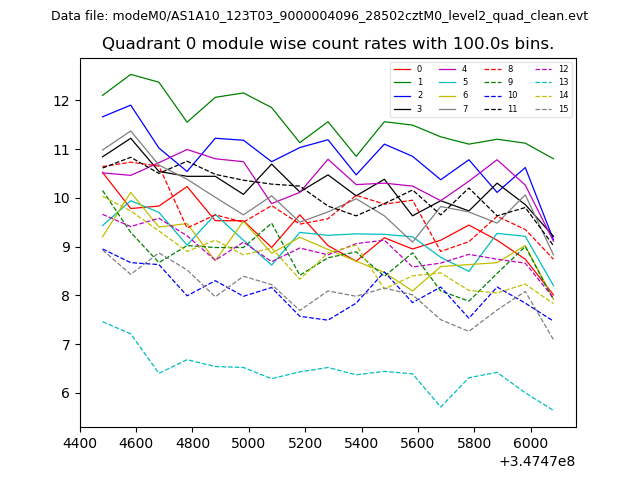 |
 |
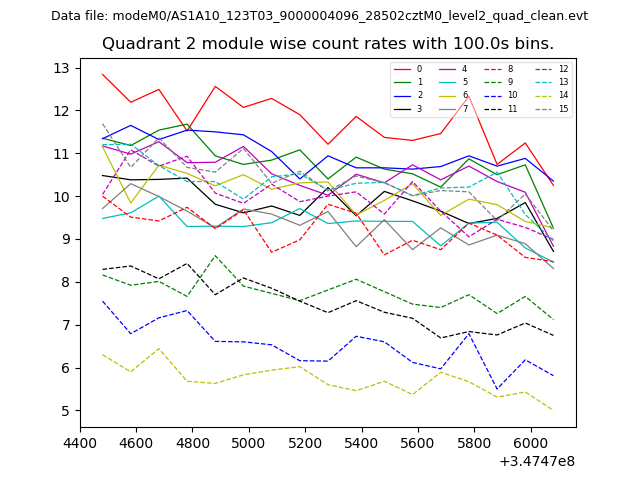
| Module-wise count rates for Quadrant B Data is divided into 100 sec bins |
 |
 |
| Module-wise count rates for Quadrant C Data is divided into 100 sec bins |
 |
 |
| Module-wise count rates for Quadrant D Data is divided into 100 sec bins |
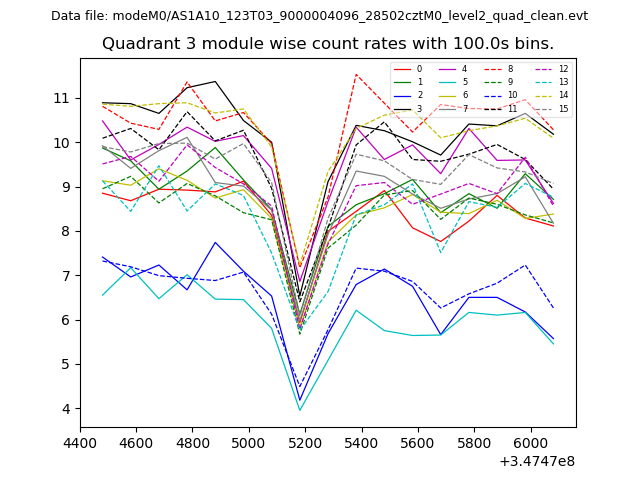 |
 |
| Parameter | Plot |
|---|---|
| CZT HV Monitor | 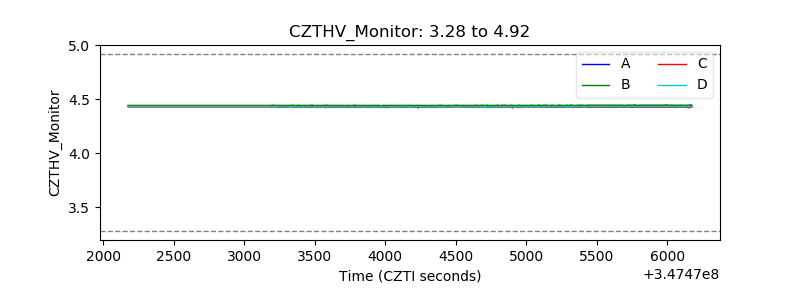 |
| D_VDD | 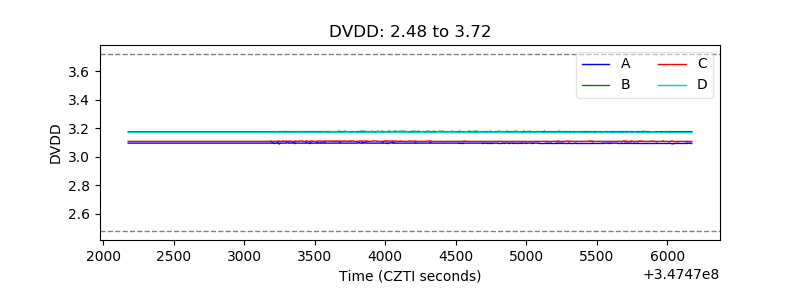 |
| Temperature 1 | 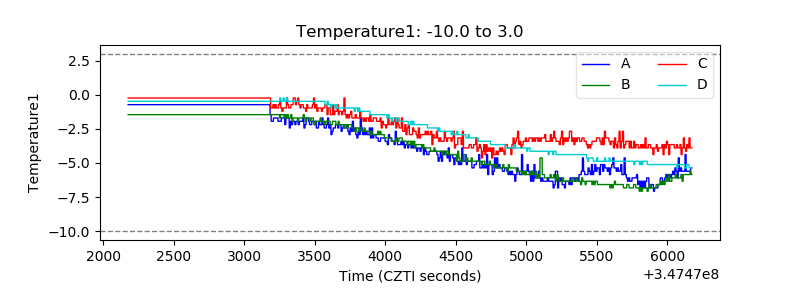 |
| Veto HV Monitor | 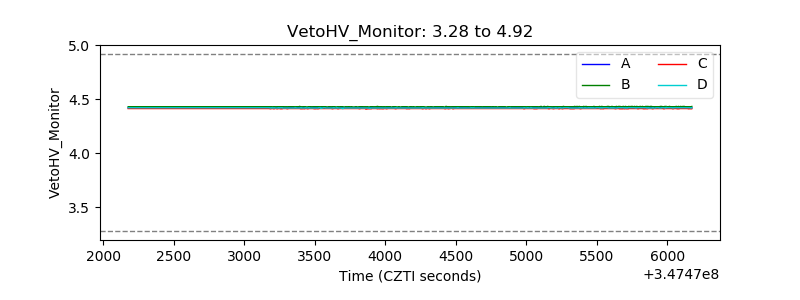 |
| Veto LLD | 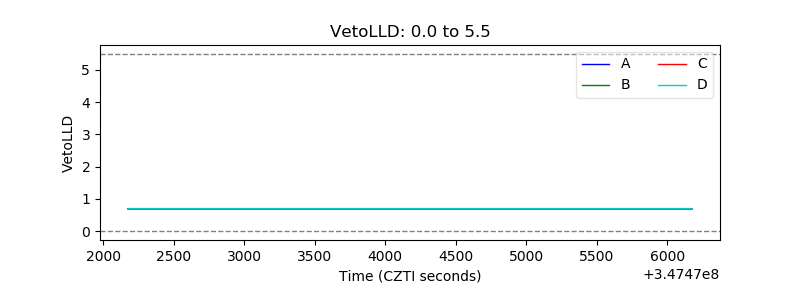 |
| Alpha Counter | 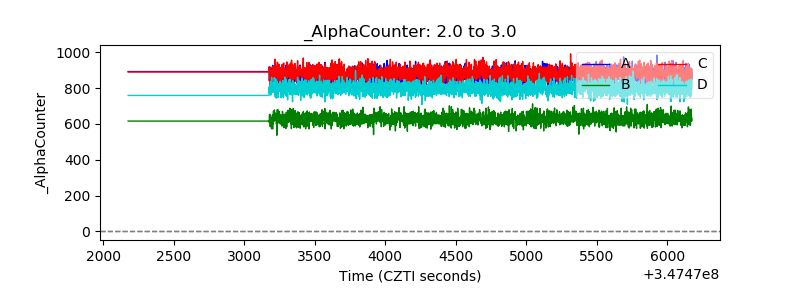 |
| _CPM_Rate | 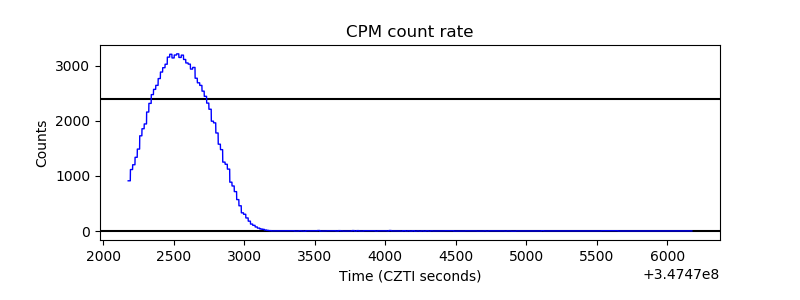 |
| CZT Counter | 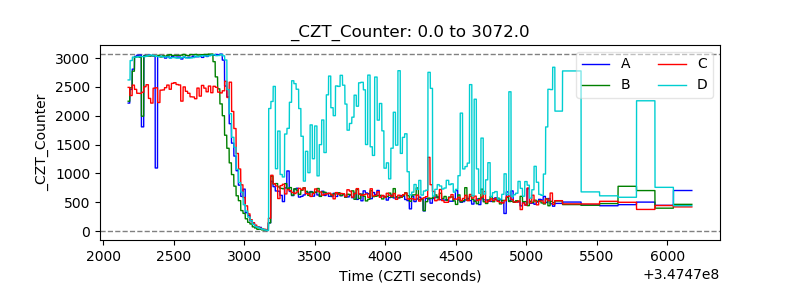 |
| +2.5 Volts monitor | 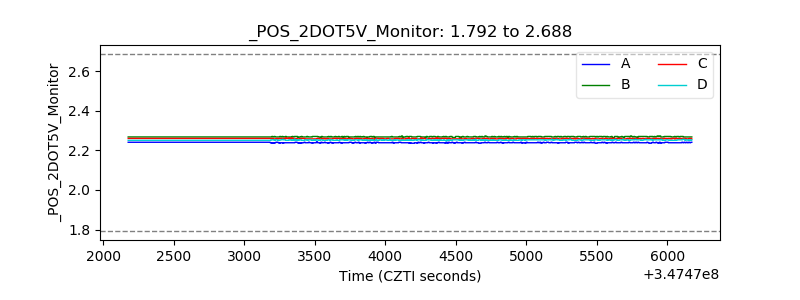 |
| +5 Volts monitor | 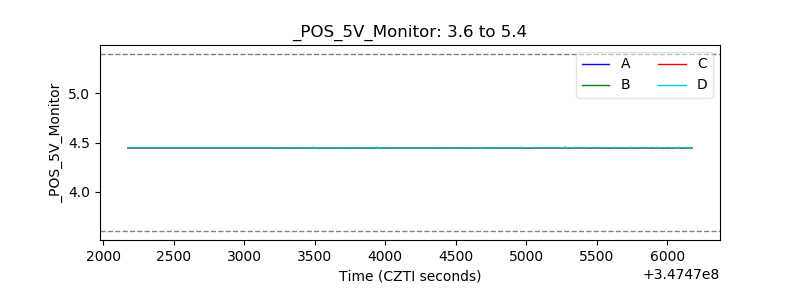 |
| _ROLL_ROT | 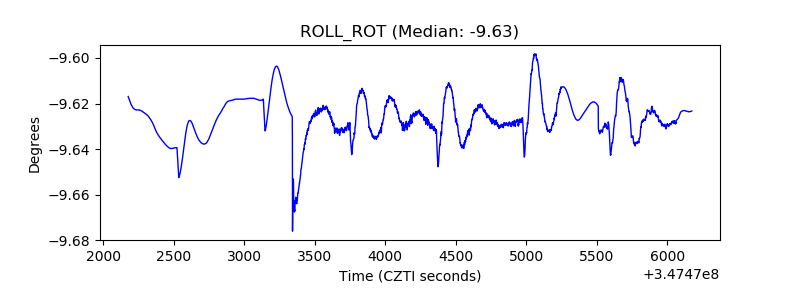 |
| _Roll_DEC | 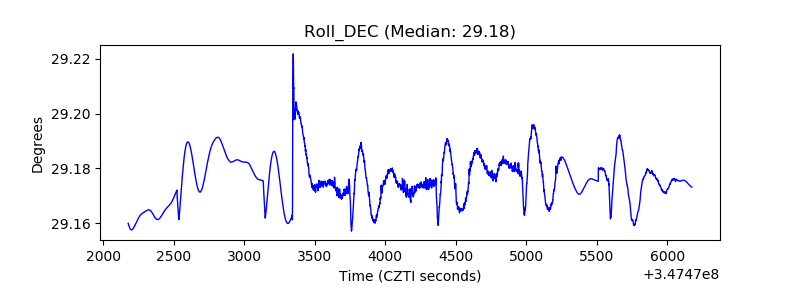 |
| _Roll_RA | 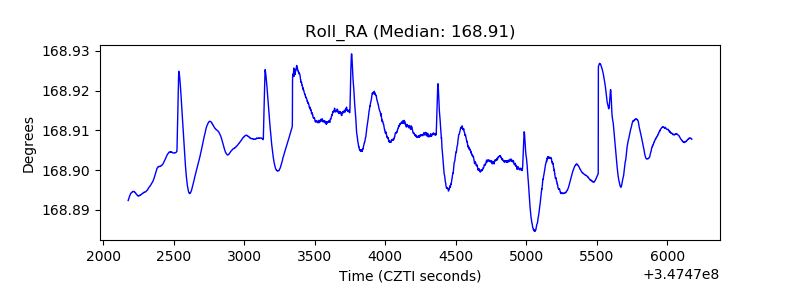 |
| Veto Counter | 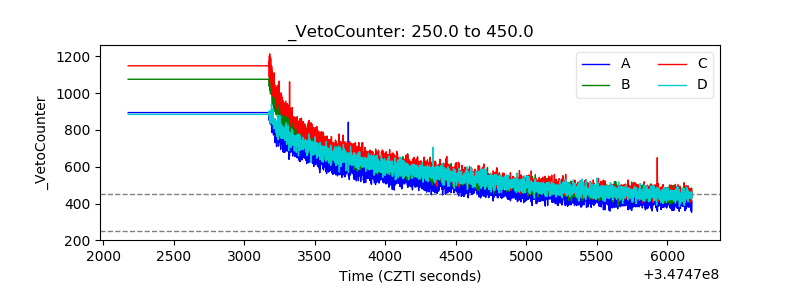 |