| Param | Original file | Final file |
|---|---|---|
| Filename | modeM0/AS1A10_058T09_9000004100cztM0_level2.fits | modeM0/AS1A10_058T09_9000004100cztM0_level2_quad_clean.evt |
| Size (bytes) | 848,975,040 | 642,525,120 |
| Size | 809.6 MB | 612.8 MB |
| Events in quadrant A | 5,293,469 | 3,581,660 |
| Events in quadrant B | 5,053,170 | 3,582,778 |
| Events in quadrant C | 5,164,154 | 3,416,991 |
| Events in quadrant D | 4,390,668 | 3,068,606 |
| Mode SS | |||
|---|---|---|---|
| Quadrant | BADHDUFLAG | Total packets | Discarded packets |
| A | 0 | 1723 | 0 |
| B | 0 | 1718 | 0 |
| C | 0 | 1738 | 0 |
| D | 0 | 1721 | 0 |
| Mode M9 | |||
|---|---|---|---|
| Quadrant | BADHDUFLAG | Total packets | Discarded packets |
| A | 0 | 162 | 0 |
| B | 0 | 159 | 0 |
| C | 0 | 162 | 0 |
| D | 0 | 160 | 0 |
| Mode M0 | |||
|---|---|---|---|
| Quadrant | BADHDUFLAG | Total packets | Discarded packets |
| A | 0 | 196557 | 0 |
| B | 0 | 198112 | 0 |
| C | 0 | 180141 | 0 |
| D | 0 | 268503 | 0 |
| Quadrant | Total seconds | Saturated seconds | Saturation percentage |
|---|---|---|---|
| A | 84776 | 2530 | 2.984335% |
| B | 84755 | 2432 | 2.869447% |
| C | 84673 | 1447 | 1.708927% |
| D | 84588 | 5508 | 6.511562% |
Noise dominated data is calculated using 1-second bins in cleaned event files. If a bin has >2000 counts, and if more than 50% of those come from <1% of pixels, then it is considered to be noise-dominated and hence unusable.
| Quadrant | # 1 sec bins | Bins with >0 counts | Bins with >2000 counts | High rate bins dominated by noise | Noise dominated (total time) | Noise dominated (detector-on time) | Marked lightcurve |
|---|---|---|---|---|---|---|---|
| A | 118346 | 85527 | 0 | 0 | 0.00% | 0.00% |  |
| B | 118349 | 85508 | 0 | 0 | 0.00% | 0.00% |  |
| C | 118349 | 85425 | 0 | 0 | 0.00% | 0.00% |  |
| D | 118348 | 85155 | 0 | 0 | 0.00% | 0.00% |  |
Top three noisy pixels from each quadrant. If the there are fewer than three noisy pixels in the level2.evt file, extra rows are filled as -1
| Pixel properties | Quadrant properties | ||||||
|---|---|---|---|---|---|---|---|
| Quadrant | DetID | PixID | Counts | Sigma | Mean | Median | Sigma |
| A | 0 | 29 | 5234 | 11.79 | 1380 | 1300 | 333.7 |
| A | 7 | 110 | 4106 | 8.41 | 1380 | 1300 | 333.7 |
| A | 0 | 30 | 4076 | 8.32 | 1380 | 1300 | 333.7 |
| B | 2 | 9 | 4128 | 10.79 | 1340 | 1280 | 263.8 |
| B | 2 | 8 | 3464 | 8.28 | 1340 | 1280 | 263.8 |
| B | 5 | 128 | 3403 | 8.05 | 1340 | 1280 | 263.8 |
| C | 1 | 81 | 3934 | 7.7 | 1363 | 1274 | 345.3 |
| C | 1 | 80 | 3907 | 7.63 | 1363 | 1274 | 345.3 |
| C | 12 | 241 | 3599 | 6.73 | 1363 | 1274 | 345.3 |
| D | 3 | 14 | 3182 | 6.06 | 1255 | 1146 | 335.7 |
| D | 7 | 3 | 3024 | 5.59 | 1255 | 1146 | 335.7 |
| D | 15 | 47 | 3007 | 5.54 | 1255 | 1146 | 335.7 |
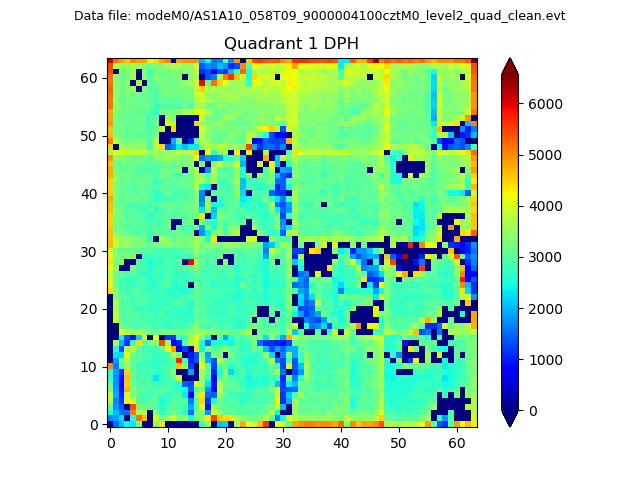
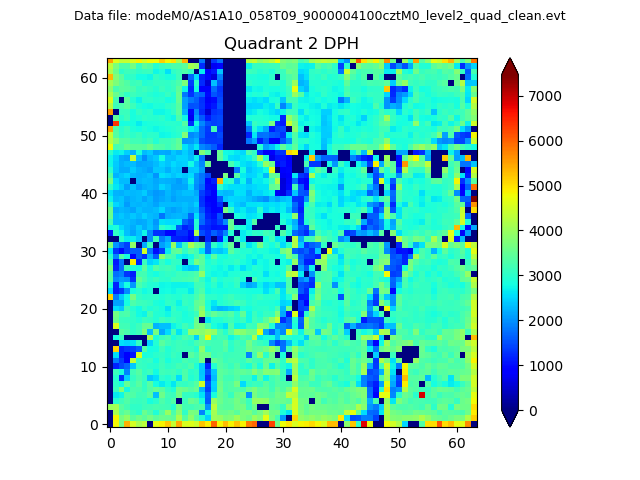
Histogram calculated using DETX and DETY for each event in the final _common_clean file
| Quadrant A |  |
 |
Quadrant B |
|---|---|---|---|
| Quadrant D |  |
 |
Quadrant C |
| Plot type | Count rate plots | Images |
|---|---|---|
| Comparison with Poisson distribution Blue bars denote a histogram of data divided into 1 sec bins. Red curve is a Poisson curve with rate = median count rate of data. |
 |
 |
| Quadrant-wise count rates Data is divided into 100 sec bins |
 |
|
| Module-wise count rates for Quadrant A Data is divided into 100 sec bins |
 |
 |
| Module-wise count rates for Quadrant B Data is divided into 100 sec bins |
 |
 |
| Module-wise count rates for Quadrant C Data is divided into 100 sec bins |
 |
 |
| Module-wise count rates for Quadrant D Data is divided into 100 sec bins |
 |
 |
| Parameter | Plot |
|---|---|
| CZT HV Monitor |  |
| D_VDD |  |
| Temperature 1 |  |
| Veto HV Monitor |  |
| Veto LLD |  |
| Alpha Counter |  |
| _CPM_Rate |  |
| CZT Counter |  |
| +2.5 Volts monitor |  |
| +5 Volts monitor |  |
| _ROLL_ROT |  |
| _Roll_DEC |  |
| _Roll_RA |  |
| Veto Counter |  |