| Param | Original file | Final file |
|---|---|---|
| Filename | modeM0/AS1A10_058T09_9000004100_28514cztM0_level2.evt | modeM0/AS1A10_058T09_9000004100_28514cztM0_level2_quad_clean.evt |
| Size (bytes) | 198,224,640 | 41,103,360 |
| Size | 189.0 MB | 39.2 MB |
| Events in quadrant A | 1,257,491 | 285,758 |
| Events in quadrant B | 1,600,334 | 281,122 |
| Events in quadrant C | 1,202,048 | 268,589 |
| Events in quadrant D | 1,799,463 | 257,308 |
| Mode SS | |||
|---|---|---|---|
| Quadrant | BADHDUFLAG | Total packets | Discarded packets |
| A | 0 | 46 | 0 |
| B | 0 | 46 | 0 |
| C | 0 | 46 | 0 |
| D | 0 | 46 | 0 |
| Mode M9 | |||
|---|---|---|---|
| Quadrant | BADHDUFLAG | Total packets | Discarded packets |
| A | 0 | 12 | 0 |
| B | 0 | 12 | 0 |
| C | 0 | 12 | 0 |
| D | 0 | 12 | 0 |
| Mode M0 | |||
|---|---|---|---|
| Quadrant | BADHDUFLAG | Total packets | Discarded packets |
| A | 0 | 5123 | 1 |
| B | 0 | 6211 | 4 |
| C | 0 | 4897 | 1 |
| D | 0 | 6922 | 1 |
| Quadrant | Total seconds | Saturated seconds | Saturation percentage |
|---|---|---|---|
| A | 2084 | 49 | 2.351248% |
| B | 2083 | 166 | 7.969275% |
| C | 2083 | 63 | 3.024484% |
| D | 2083 | 120 | 5.760922% |
Noise dominated data is calculated using 1-second bins in cleaned event files. If a bin has >2000 counts, and if more than 50% of those come from <1% of pixels, then it is considered to be noise-dominated and hence unusable.
| Quadrant | # 1 sec bins | Bins with >0 counts | Bins with >2000 counts | High rate bins dominated by noise | Noise dominated (total time) | Noise dominated (detector-on time) | Marked lightcurve |
|---|---|---|---|---|---|---|---|
| A | 3339 | 2084 | 0 | 0 | 0.00% | 0.00% | 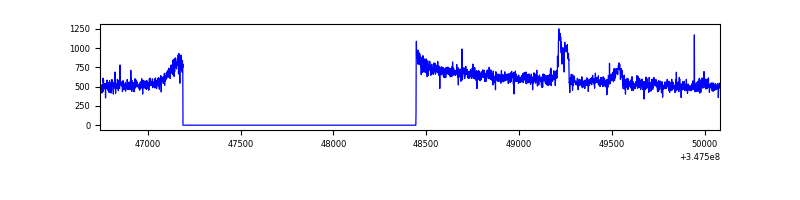 |
| B | 3338 | 2083 | 102 | 102 | 3.06% | 4.90% | 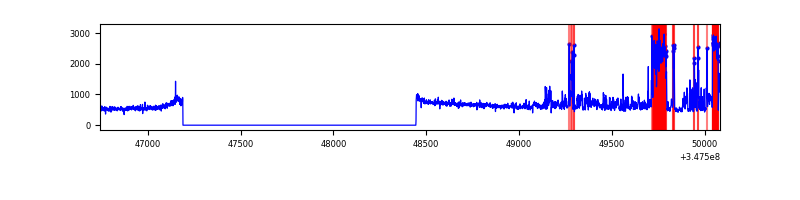 |
| C | 3338 | 2083 | 0 | 0 | 0.00% | 0.00% | 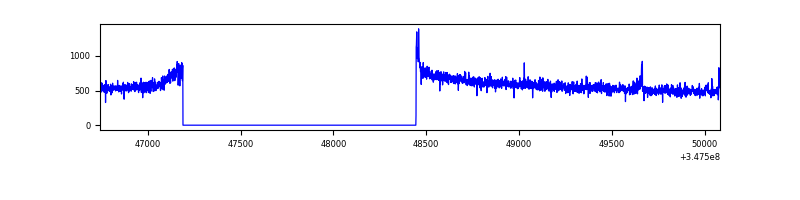 |
| D | 3338 | 2083 | 92 | 92 | 2.76% | 4.42% | 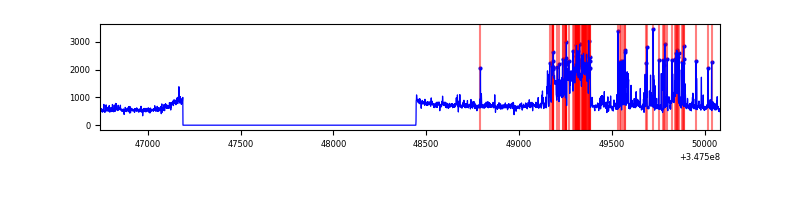 |
Top three noisy pixels from each quadrant. If the there are fewer than three noisy pixels in the level2.evt file, extra rows are filled as -1
| Pixel properties | Quadrant properties | ||||||
|---|---|---|---|---|---|---|---|
| Quadrant | DetID | PixID | Counts | Sigma | Mean | Median | Sigma |
| A | 0 | 247 | 27411 | 421.99 | 314 | 309 | 64.2 |
| A | 15 | 174 | 13024 | 197.98 | 314 | 309 | 64.2 |
| A | 0 | 226 | 4639 | 67.42 | 314 | 309 | 64.2 |
| B | 10 | 245 | 305424 | 5270.9 | 302 | 295 | 57.9 |
| B | 0 | 230 | 94464 | 1626.71 | 302 | 295 | 57.9 |
| B | 0 | 182 | 7261 | 120.33 | 302 | 295 | 57.9 |
| C | 14 | 238 | 47952 | 692.28 | 291 | 293 | 68.8 |
| C | 3 | 233 | 7061 | 98.31 | 291 | 293 | 68.8 |
| C | 7 | 247 | 5113 | 70.01 | 291 | 293 | 68.8 |
| D | 8 | 195 | 389352 | 5364.61 | 298 | 290 | 72.5 |
| D | 1 | 52 | 143856 | 1979.57 | 298 | 290 | 72.5 |
| D | 12 | 233 | 102125 | 1404.16 | 298 | 290 | 72.5 |
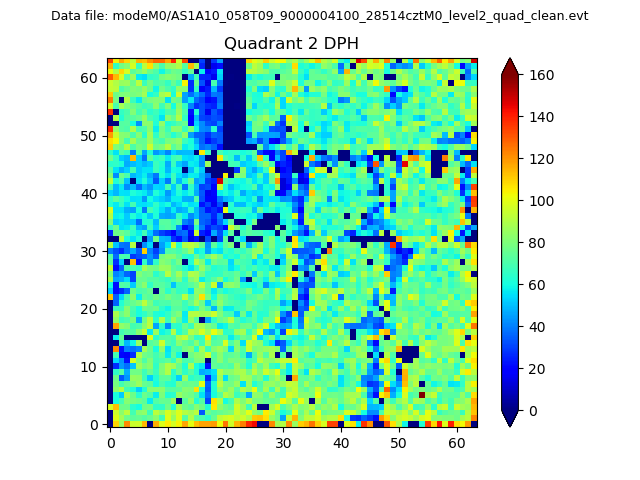
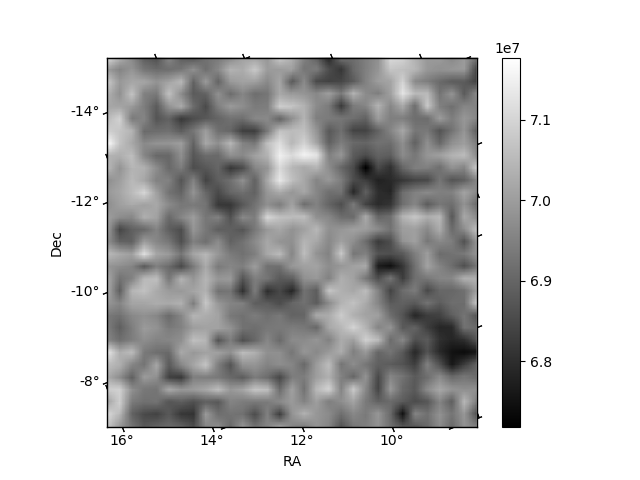
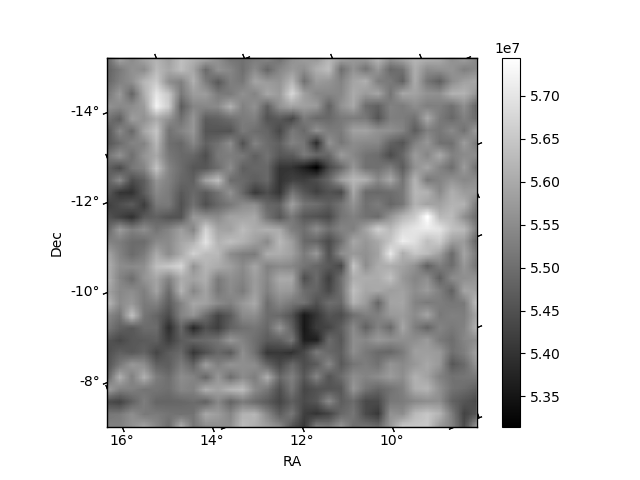
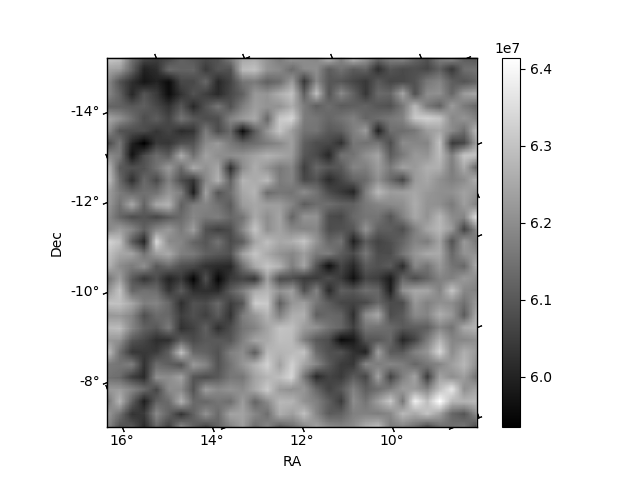
Histogram calculated using DETX and DETY for each event in the final _common_clean file
| Quadrant A |  |
 |
Quadrant B |
|---|---|---|---|
| Quadrant D | 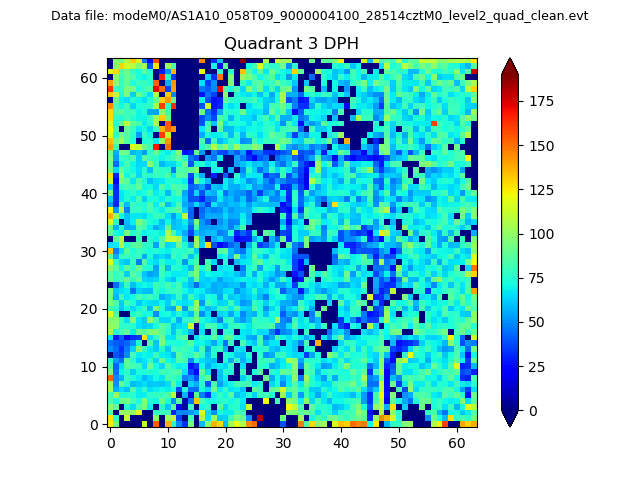 |
 |
Quadrant C |
| Plot type | Count rate plots | Images |
|---|---|---|
| Comparison with Poisson distribution Blue bars denote a histogram of data divided into 1 sec bins. Red curve is a Poisson curve with rate = median count rate of data. |
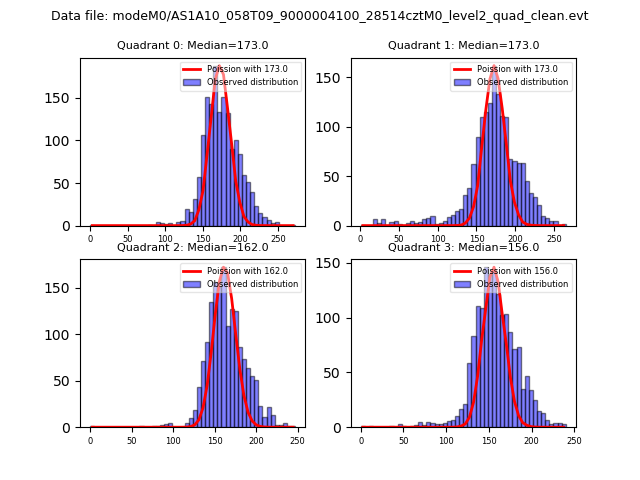 |
 |
| Quadrant-wise count rates Data is divided into 100 sec bins |
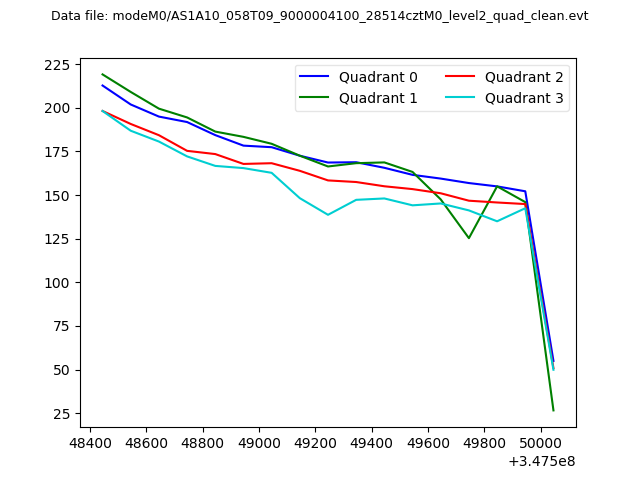 |
|
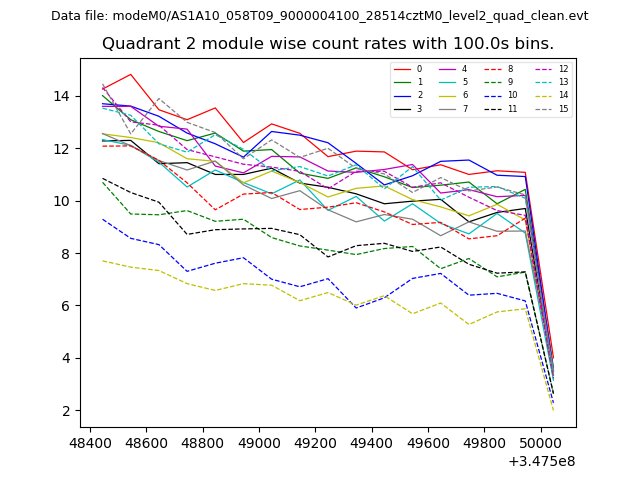
| Module-wise count rates for Quadrant A Data is divided into 100 sec bins |
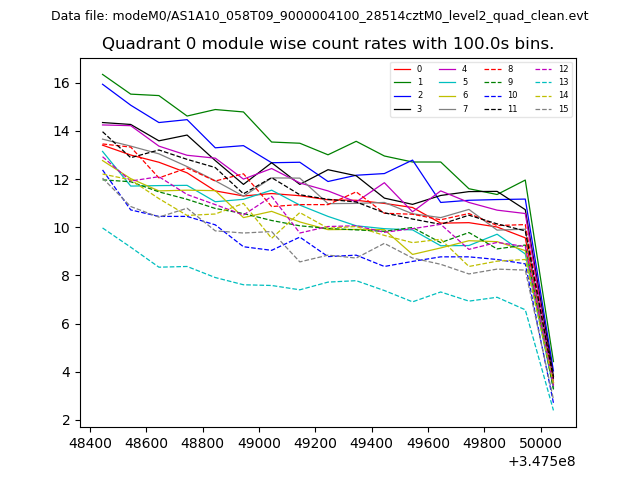 |
 |
| Module-wise count rates for Quadrant B Data is divided into 100 sec bins |
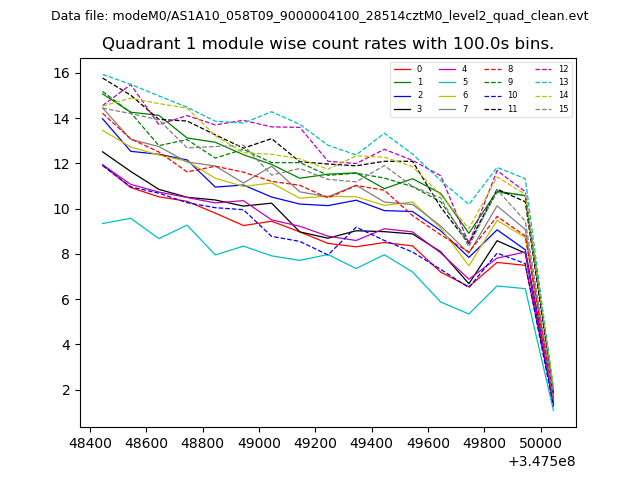 |
 |
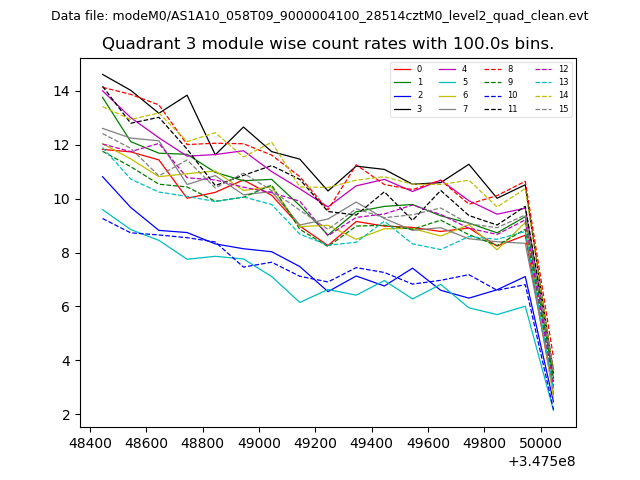
| Module-wise count rates for Quadrant C Data is divided into 100 sec bins |
 |
 |
| Module-wise count rates for Quadrant D Data is divided into 100 sec bins |
 |
 |
| Parameter | Plot |
|---|---|
| CZT HV Monitor | 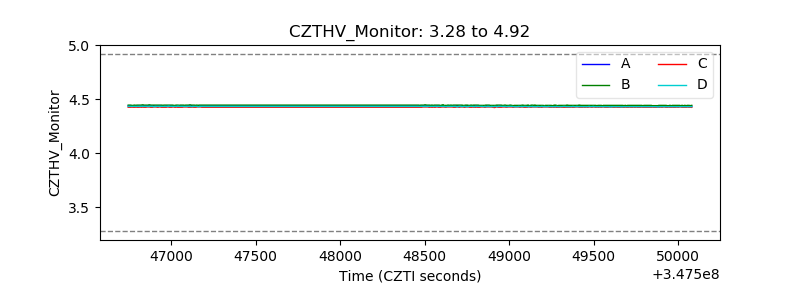 |
| D_VDD | 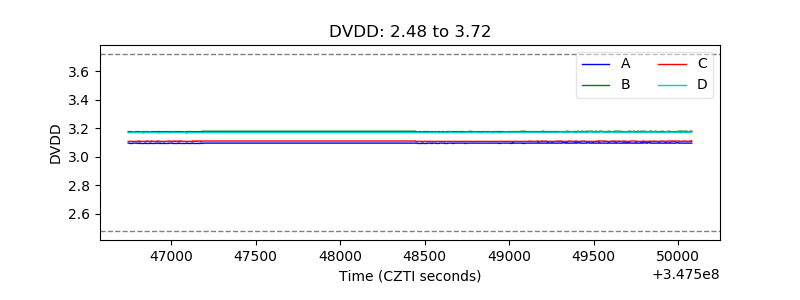 |
| Temperature 1 | 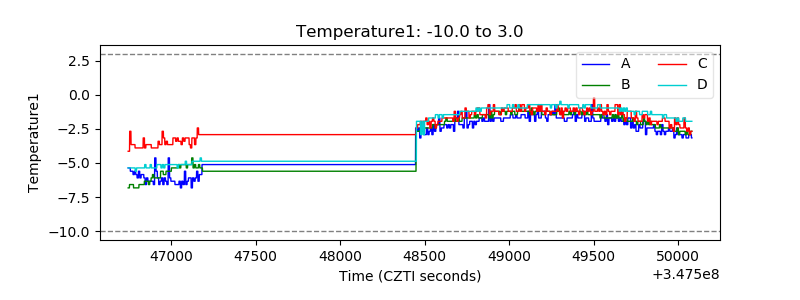 |
| Veto HV Monitor | 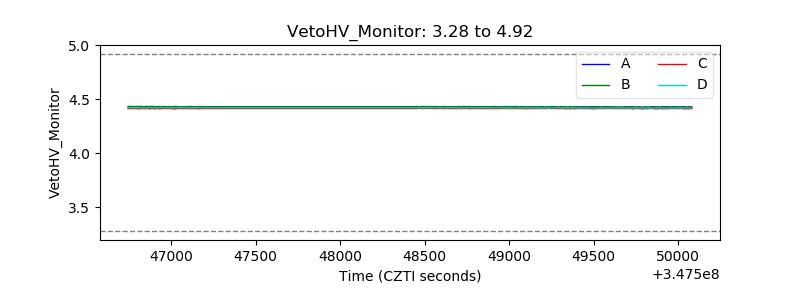 |
| Veto LLD | 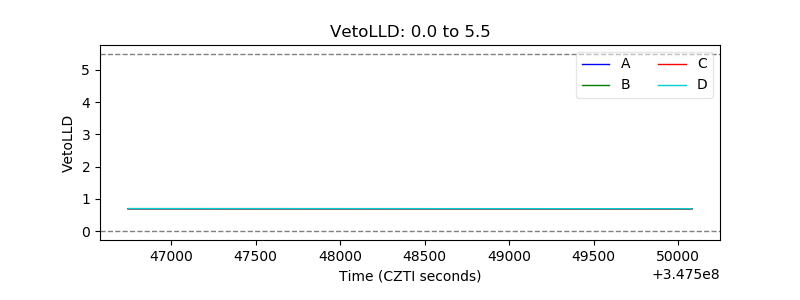 |
| Alpha Counter | 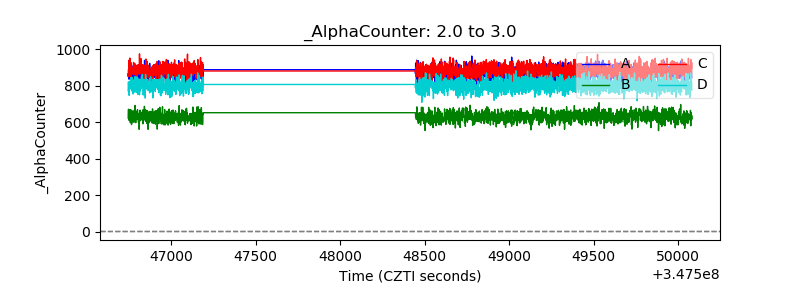 |
| _CPM_Rate | 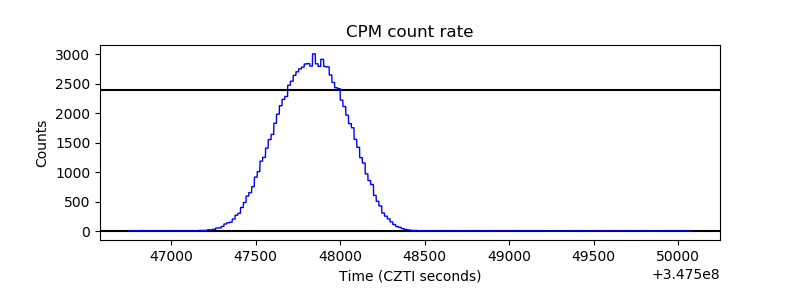 |
| CZT Counter | 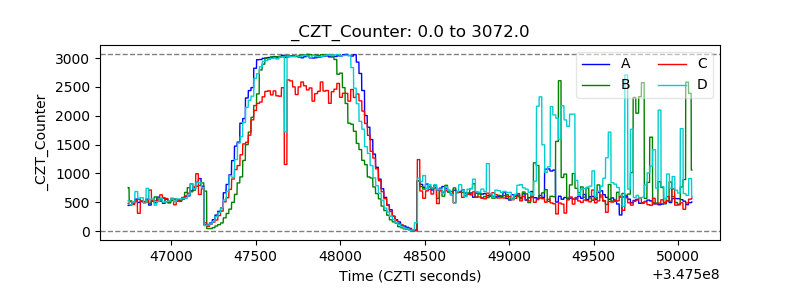 |
| +2.5 Volts monitor |  |
| +5 Volts monitor |  |
| _ROLL_ROT | 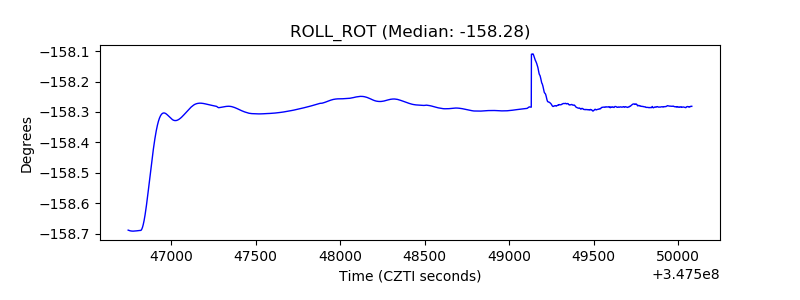 |
| _Roll_DEC | 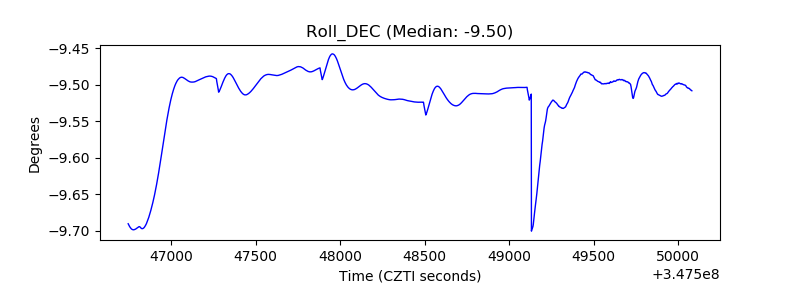 |
| _Roll_RA | 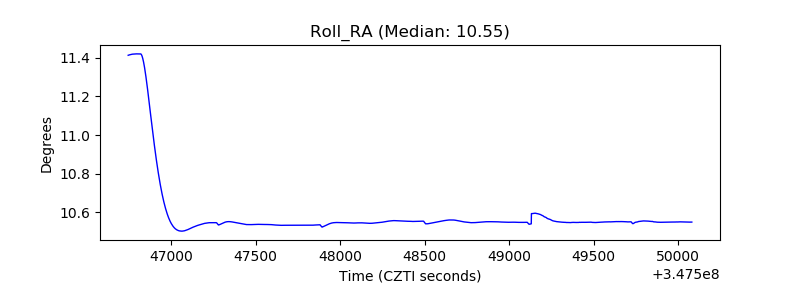 |
| Veto Counter | 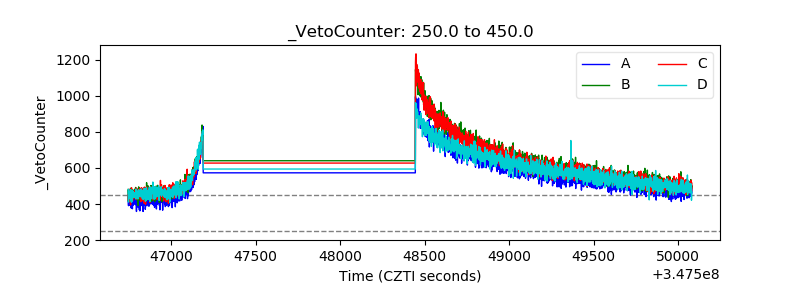 |