| Param | Original file | Final file |
|---|---|---|
| Filename | modeM0/AS1A10_058T09_9000004100_28515cztM0_level2.evt | modeM0/AS1A10_058T09_9000004100_28515cztM0_level2_quad_clean.evt |
| Size (bytes) | 585,872,640 | 106,427,520 |
| Size | 558.7 MB | 101.5 MB |
| Events in quadrant A | 3,483,153 | 734,598 |
| Events in quadrant B | 4,621,231 | 717,469 |
| Events in quadrant C | 3,440,423 | 692,111 |
| Events in quadrant D | 5,765,631 | 632,694 |
| Mode SS | |||
|---|---|---|---|
| Quadrant | BADHDUFLAG | Total packets | Discarded packets |
| A | 0 | 130 | 0 |
| B | 0 | 130 | 0 |
| C | 0 | 130 | 0 |
| D | 0 | 130 | 0 |
| Mode M9 | |||
|---|---|---|---|
| Quadrant | BADHDUFLAG | Total packets | Discarded packets |
| A | 0 | 13 | 0 |
| B | 0 | 13 | 0 |
| C | 0 | 13 | 0 |
| D | 0 | 13 | 0 |
| Mode M0 | |||
|---|---|---|---|
| Quadrant | BADHDUFLAG | Total packets | Discarded packets |
| A | 0 | 14364 | 1 |
| B | 0 | 17943 | 1 |
| C | 0 | 14199 | 1 |
| D | 0 | 21465 | 1 |
| Quadrant | Total seconds | Saturated seconds | Saturation percentage |
|---|---|---|---|
| A | 6392 | 86 | 1.345432% |
| B | 6393 | 409 | 6.397622% |
| C | 6393 | 107 | 1.673706% |
| D | 6393 | 600 | 9.385265% |
Noise dominated data is calculated using 1-second bins in cleaned event files. If a bin has >2000 counts, and if more than 50% of those come from <1% of pixels, then it is considered to be noise-dominated and hence unusable.
| Quadrant | # 1 sec bins | Bins with >0 counts | Bins with >2000 counts | High rate bins dominated by noise | Noise dominated (total time) | Noise dominated (detector-on time) | Marked lightcurve |
|---|---|---|---|---|---|---|---|
| A | 7682 | 6392 | 0 | 0 | 0.00% | 0.00% | 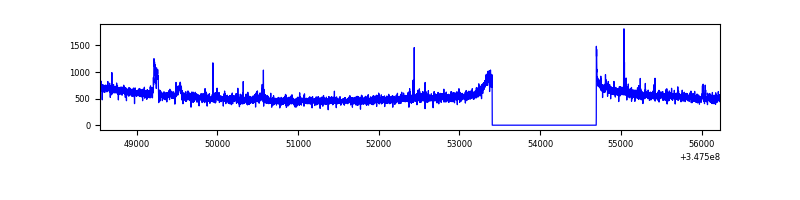 |
| B | 7683 | 6393 | 254 | 254 | 3.31% | 3.97% | 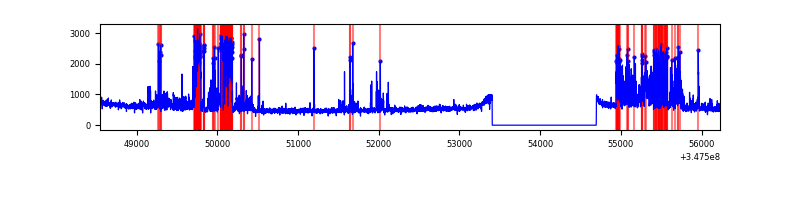 |
| C | 7683 | 6393 | 0 | 0 | 0.00% | 0.00% | 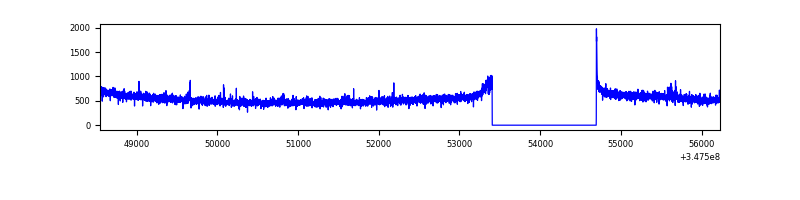 |
| D | 7682 | 6392 | 609 | 609 | 7.93% | 9.53% | 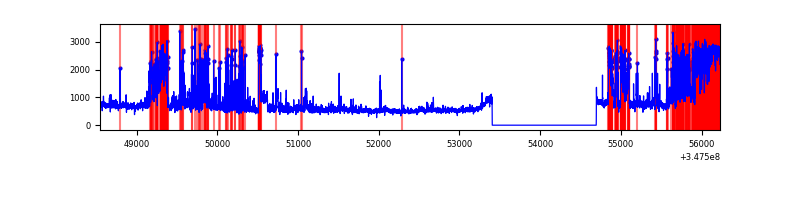 |
Top three noisy pixels from each quadrant. If the there are fewer than three noisy pixels in the level2.evt file, extra rows are filled as -1
| Pixel properties | Quadrant properties | ||||||
|---|---|---|---|---|---|---|---|
| Quadrant | DetID | PixID | Counts | Sigma | Mean | Median | Sigma |
| A | 15 | 174 | 43787 | 246.98 | 879 | 863 | 173.8 |
| A | 0 | 247 | 28080 | 156.6 | 879 | 863 | 173.8 |
| A | 13 | 254 | 11029 | 58.49 | 879 | 863 | 173.8 |
| B | 10 | 245 | 564459 | 3545.69 | 853 | 835 | 159.0 |
| B | 4 | 171 | 476138 | 2990.08 | 853 | 835 | 159.0 |
| B | 0 | 230 | 147470 | 922.46 | 853 | 835 | 159.0 |
| C | 14 | 238 | 137069 | 714.35 | 823 | 829 | 190.7 |
| C | 3 | 233 | 69582 | 360.49 | 823 | 829 | 190.7 |
| C | 7 | 247 | 13651 | 67.23 | 823 | 829 | 190.7 |
| D | 8 | 195 | 1124577 | 5870.05 | 807 | 787 | 191.4 |
| D | 12 | 233 | 1047573 | 5467.83 | 807 | 787 | 191.4 |
| D | 1 | 52 | 432260 | 2253.77 | 807 | 787 | 191.4 |
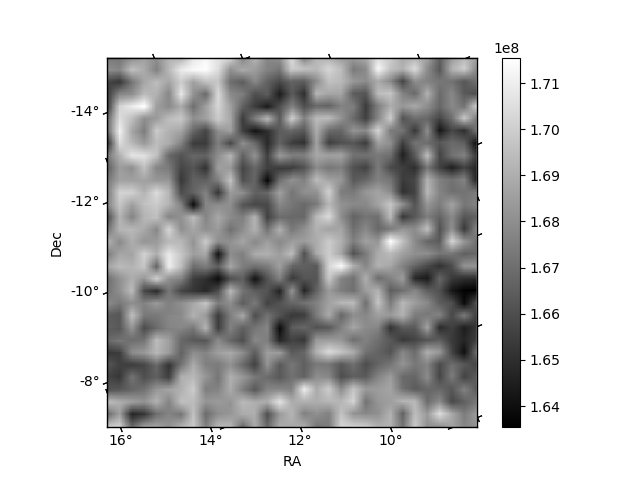
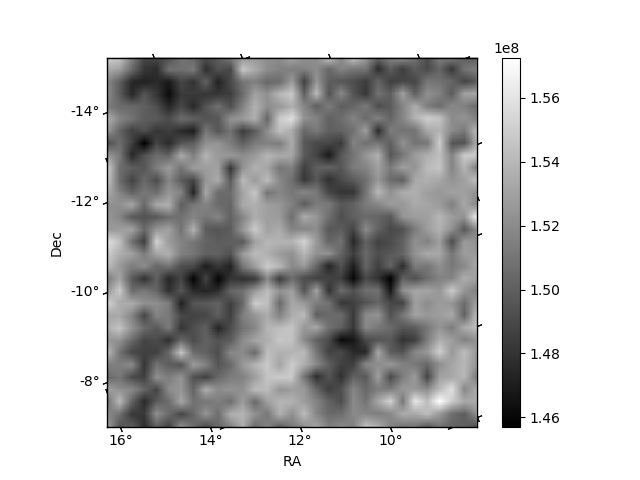
Histogram calculated using DETX and DETY for each event in the final _common_clean file
| Quadrant A |  |
 |
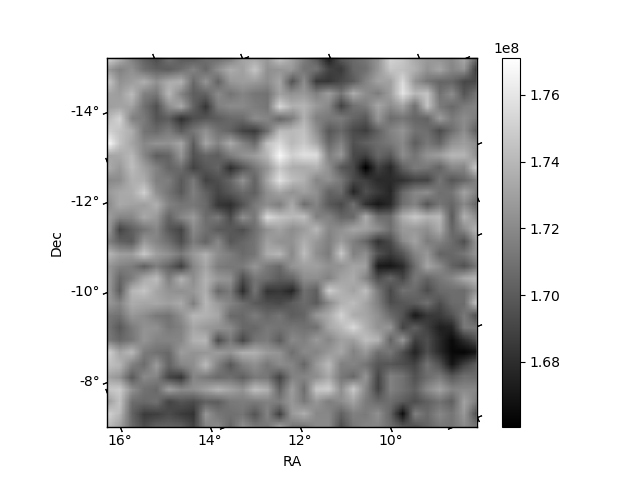
Quadrant B |
|---|---|---|---|
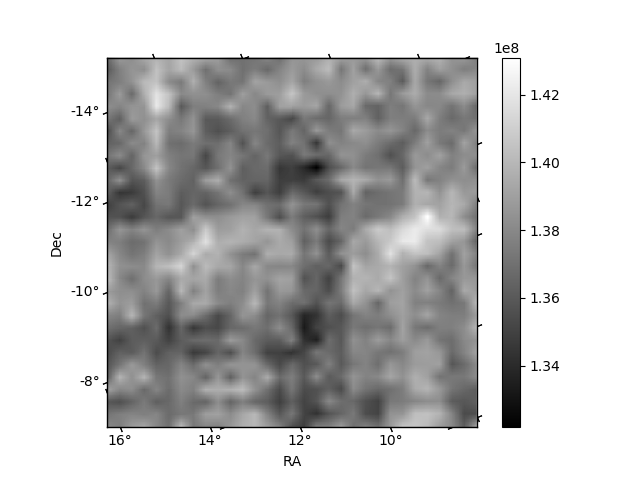
| Quadrant D |  |
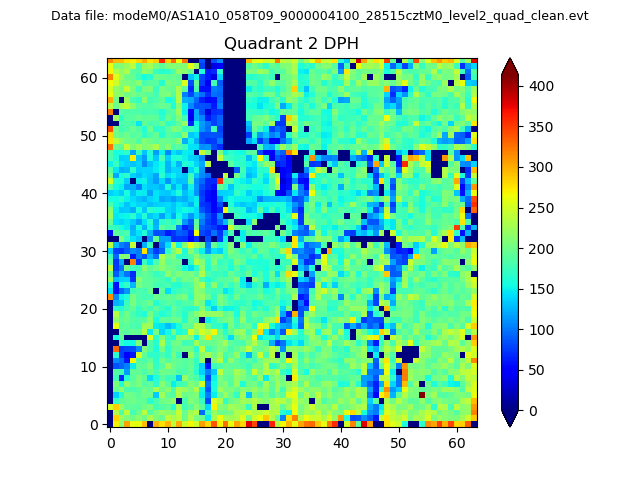 |
Quadrant C |
| Plot type | Count rate plots | Images |
|---|---|---|
| Comparison with Poisson distribution Blue bars denote a histogram of data divided into 1 sec bins. Red curve is a Poisson curve with rate = median count rate of data. |
 |
 |
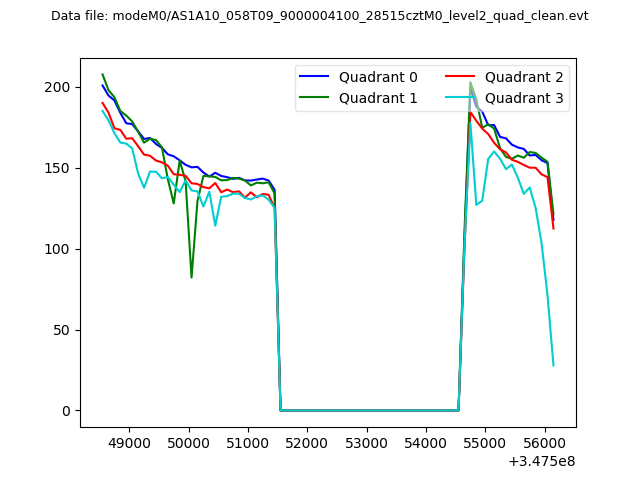
| Quadrant-wise count rates Data is divided into 100 sec bins |
 |
|
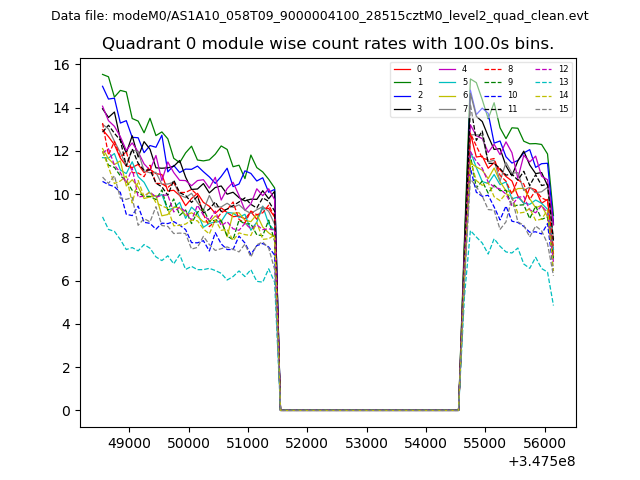
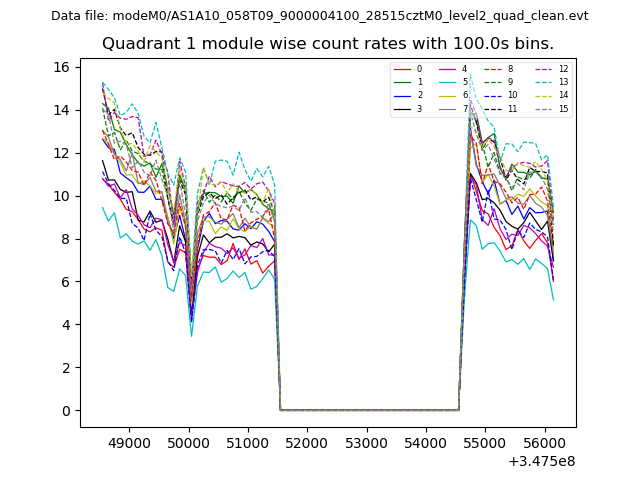
| Module-wise count rates for Quadrant A Data is divided into 100 sec bins |
 |
 |
| Module-wise count rates for Quadrant B Data is divided into 100 sec bins |
 |
 |
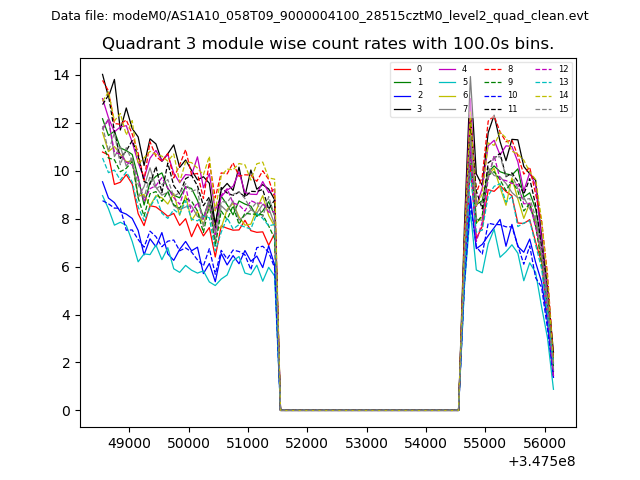
| Module-wise count rates for Quadrant C Data is divided into 100 sec bins |
 |
 |
| Module-wise count rates for Quadrant D Data is divided into 100 sec bins |
 |
 |
| Parameter | Plot |
|---|---|
| CZT HV Monitor |  |
| D_VDD | 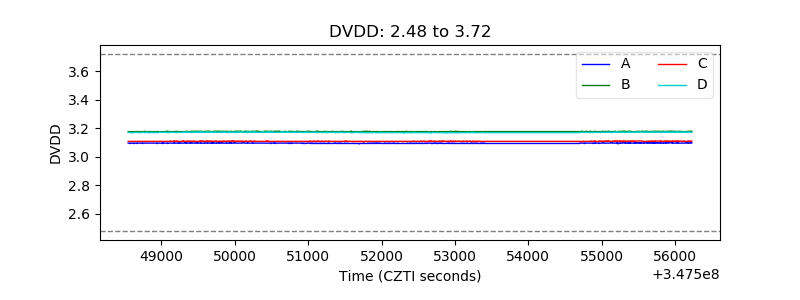 |
| Temperature 1 | 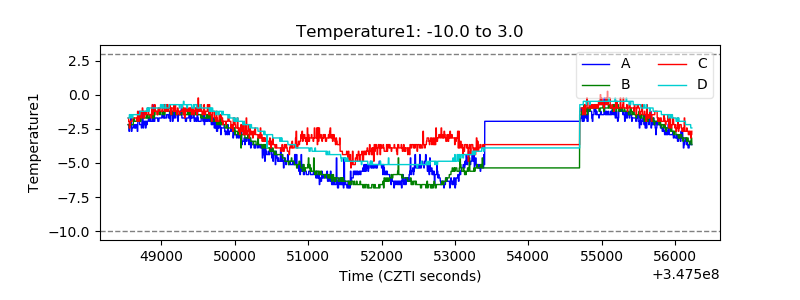 |
| Veto HV Monitor | 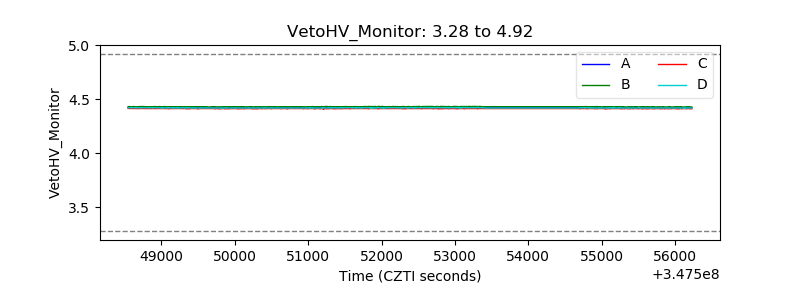 |
| Veto LLD | 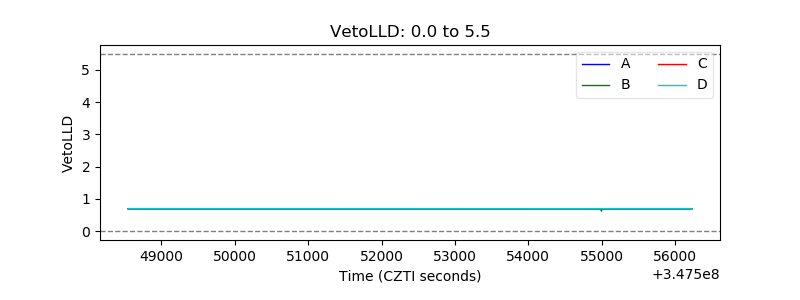 |
| Alpha Counter | 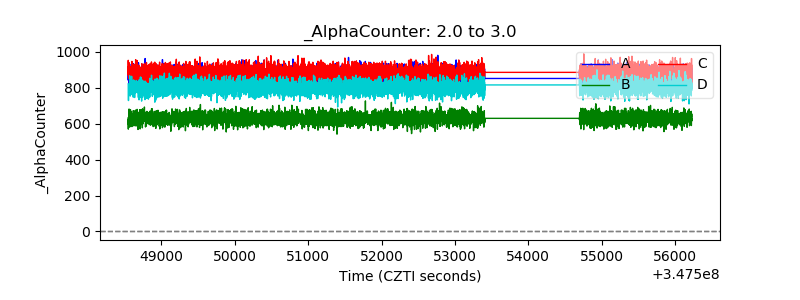 |
| _CPM_Rate | 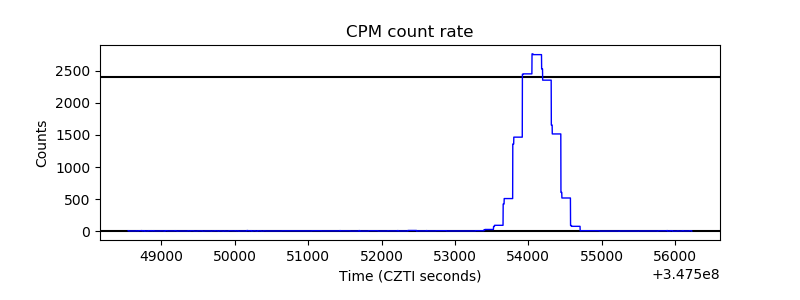 |
| CZT Counter | 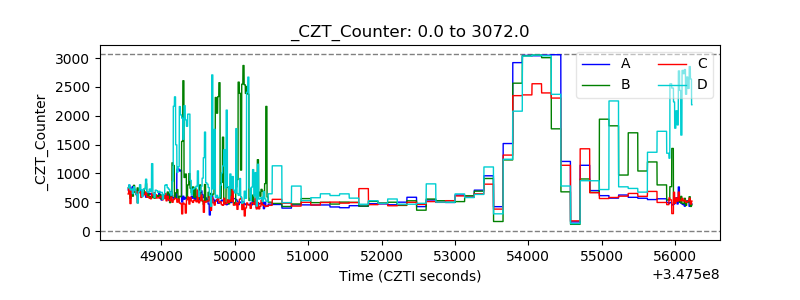 |
| +2.5 Volts monitor |  |
| +5 Volts monitor | 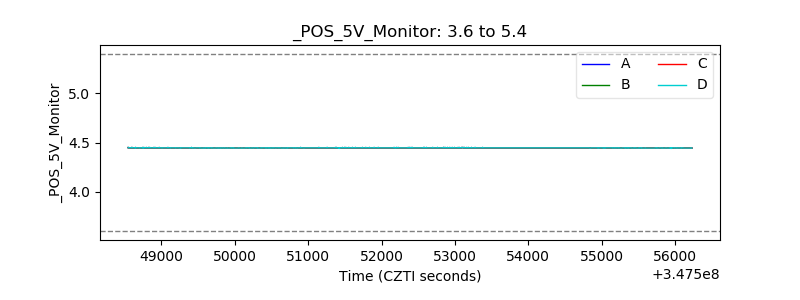 |
| _ROLL_ROT | 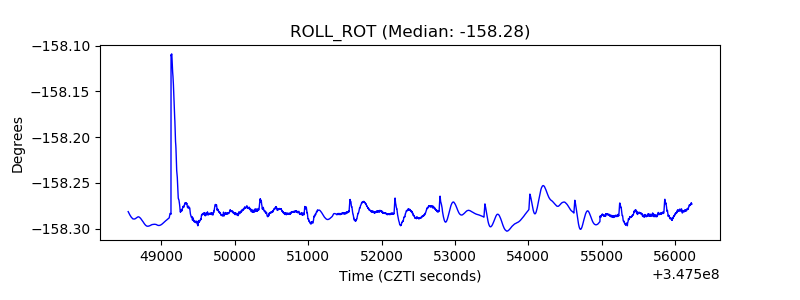 |
| _Roll_DEC | 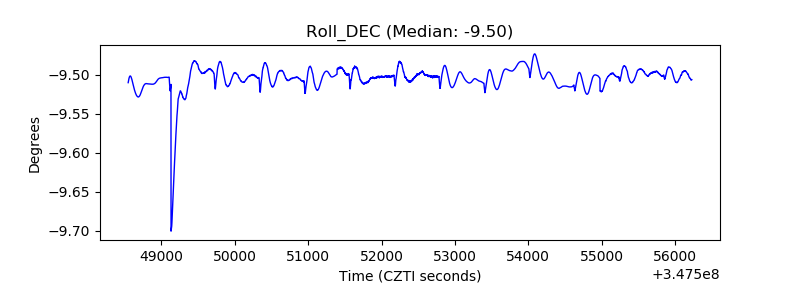 |
| _Roll_RA |  |
| Veto Counter | 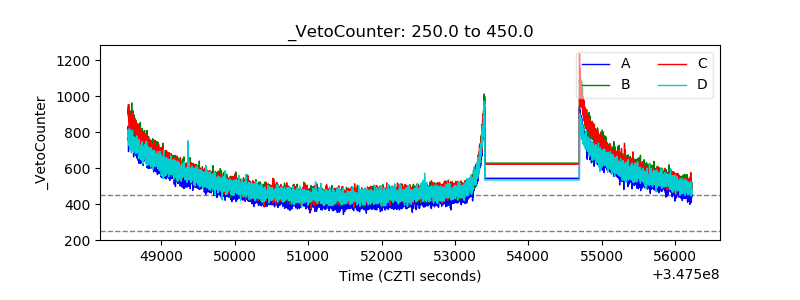 |