| Param | Original file | Final file |
|---|---|---|
| Filename | modeM0/AS1A10_058T09_9000004100_28516cztM0_level2.evt | modeM0/AS1A10_058T09_9000004100_28516cztM0_level2_quad_clean.evt |
| Size (bytes) | 601,891,200 | 94,288,320 |
| Size | 574.0 MB | 89.9 MB |
| Events in quadrant A | 3,407,509 | 641,756 |
| Events in quadrant B | 3,994,863 | 645,442 |
| Events in quadrant C | 3,384,747 | 610,784 |
| Events in quadrant D | 7,014,489 | 517,052 |
| Mode SS | |||
|---|---|---|---|
| Quadrant | BADHDUFLAG | Total packets | Discarded packets |
| A | 0 | 128 | 0 |
| B | 0 | 128 | 0 |
| C | 0 | 128 | 0 |
| D | 0 | 128 | 0 |
| Mode M9 | |||
|---|---|---|---|
| Quadrant | BADHDUFLAG | Total packets | Discarded packets |
| A | 0 | 14 | 0 |
| B | 0 | 15 | 0 |
| C | 0 | 15 | 0 |
| D | 0 | 15 | 0 |
| Mode M0 | |||
|---|---|---|---|
| Quadrant | BADHDUFLAG | Total packets | Discarded packets |
| A | 0 | 13987 | 2 |
| B | 0 | 15869 | 2 |
| C | 0 | 13895 | 2 |
| D | 0 | 25063 | 2 |
| Quadrant | Total seconds | Saturated seconds | Saturation percentage |
|---|---|---|---|
| A | 6305 | 102 | 1.617764% |
| B | 6305 | 219 | 3.473434% |
| C | 6305 | 103 | 1.633624% |
| D | 6305 | 998 | 15.828707% |
Noise dominated data is calculated using 1-second bins in cleaned event files. If a bin has >2000 counts, and if more than 50% of those come from <1% of pixels, then it is considered to be noise-dominated and hence unusable.
| Quadrant | # 1 sec bins | Bins with >0 counts | Bins with >2000 counts | High rate bins dominated by noise | Noise dominated (total time) | Noise dominated (detector-on time) | Marked lightcurve |
|---|---|---|---|---|---|---|---|
| A | 7620 | 6305 | 19 | 19 | 0.25% | 0.30% | 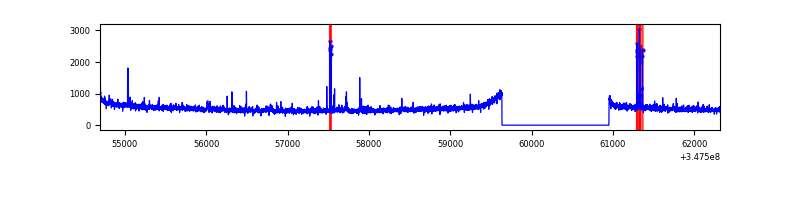 |
| B | 7620 | 6305 | 67 | 67 | 0.88% | 1.06% | 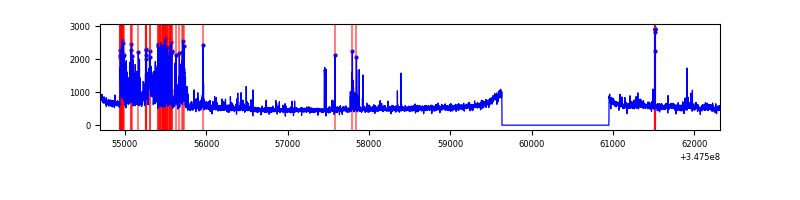 |
| C | 7620 | 6305 | 0 | 0 | 0.00% | 0.00% | 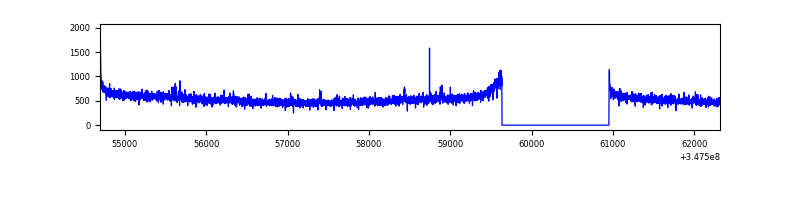 |
| D | 7620 | 6305 | 1039 | 1039 | 13.64% | 16.48% | 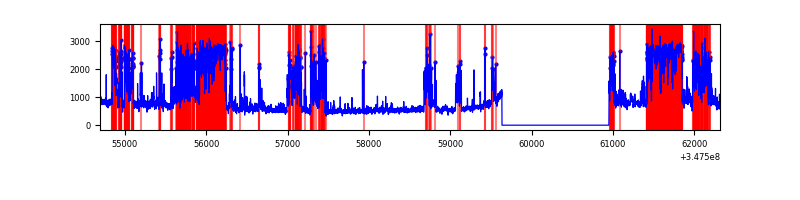 |
Top three noisy pixels from each quadrant. If the there are fewer than three noisy pixels in the level2.evt file, extra rows are filled as -1
| Pixel properties | Quadrant properties | ||||||
|---|---|---|---|---|---|---|---|
| Quadrant | DetID | PixID | Counts | Sigma | Mean | Median | Sigma |
| A | 13 | 248 | 44864 | 260.89 | 851 | 836 | 168.8 |
| A | 15 | 174 | 35013 | 202.52 | 851 | 836 | 168.8 |
| A | 12 | 96 | 25010 | 143.24 | 851 | 836 | 168.8 |
| B | 4 | 171 | 487847 | 3102.92 | 842 | 825 | 157.0 |
| B | 10 | 245 | 59483 | 373.72 | 842 | 825 | 157.0 |
| B | 0 | 230 | 50122 | 314.08 | 842 | 825 | 157.0 |
| C | 14 | 238 | 131601 | 701.57 | 803 | 810 | 186.4 |
| C | 3 | 233 | 100779 | 536.24 | 803 | 810 | 186.4 |
| C | 7 | 247 | 10426 | 51.58 | 803 | 810 | 186.4 |
| D | 12 | 233 | 1880210 | 10450.68 | 756 | 736 | 179.8 |
| D | 8 | 195 | 1801239 | 10011.57 | 756 | 736 | 179.8 |
| D | 1 | 52 | 277772 | 1540.44 | 756 | 736 | 179.8 |
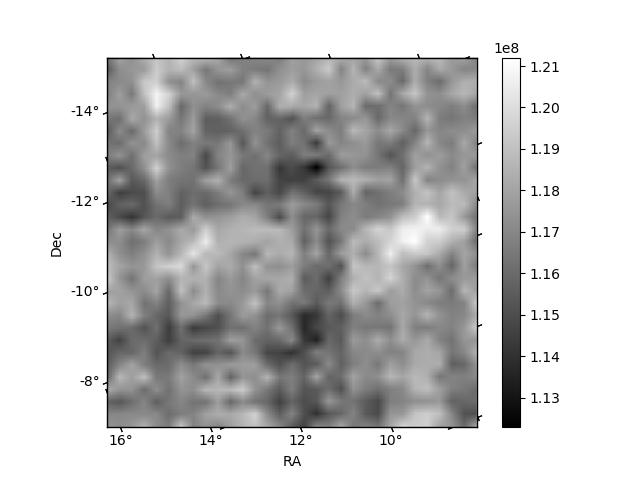
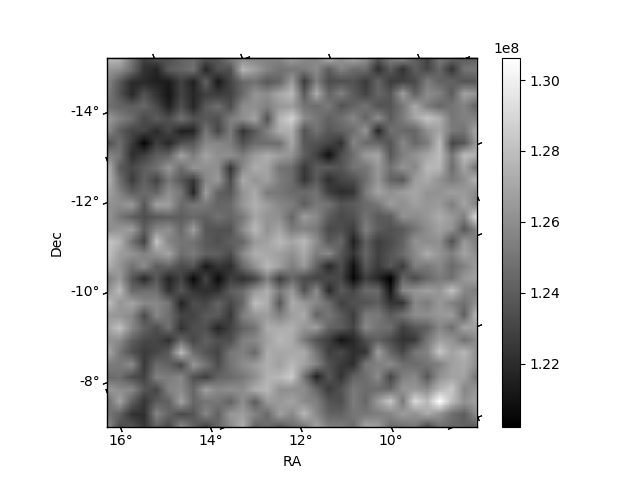
Histogram calculated using DETX and DETY for each event in the final _common_clean file
| Quadrant A |  |
 |
Quadrant B |
|---|---|---|---|
| Quadrant D | 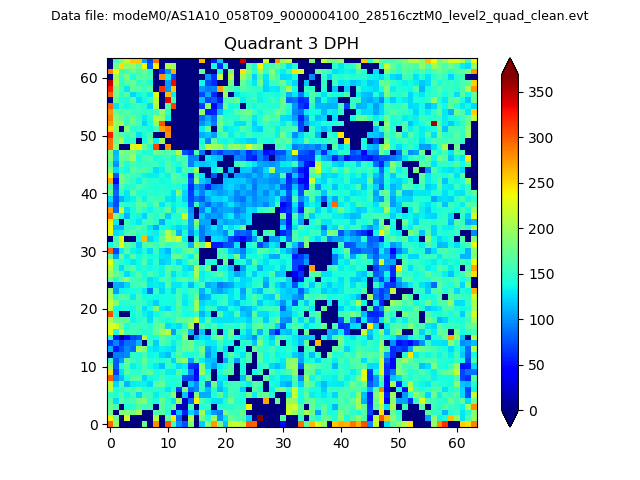 |
 |
Quadrant C |
| Plot type | Count rate plots | Images |
|---|---|---|
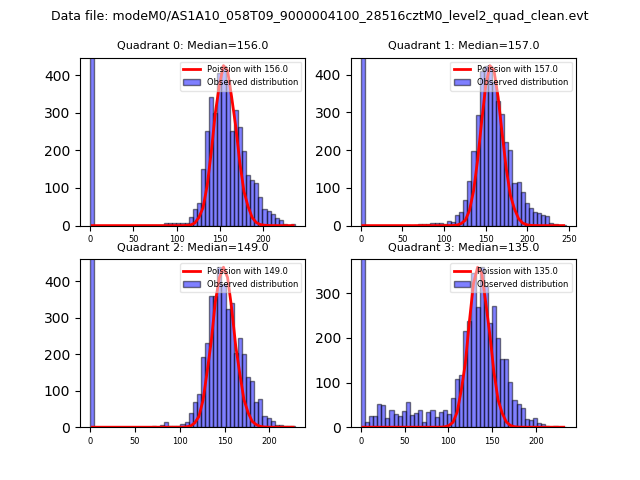
| Comparison with Poisson distribution Blue bars denote a histogram of data divided into 1 sec bins. Red curve is a Poisson curve with rate = median count rate of data. |
 |
 |
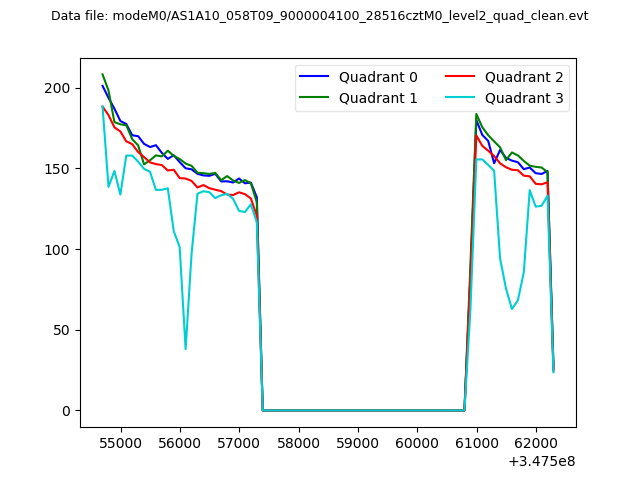
| Quadrant-wise count rates Data is divided into 100 sec bins |
 |
|
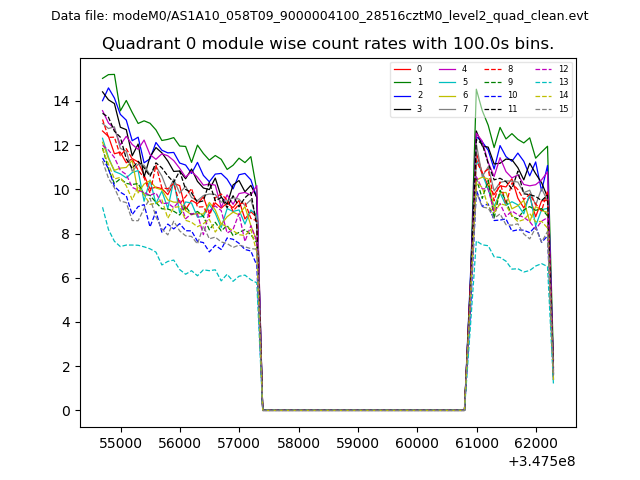
| Module-wise count rates for Quadrant A Data is divided into 100 sec bins |
 |
 |
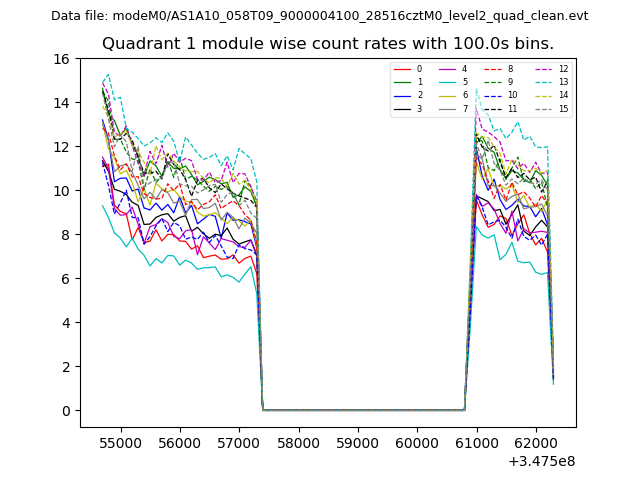
| Module-wise count rates for Quadrant B Data is divided into 100 sec bins |
 |
 |
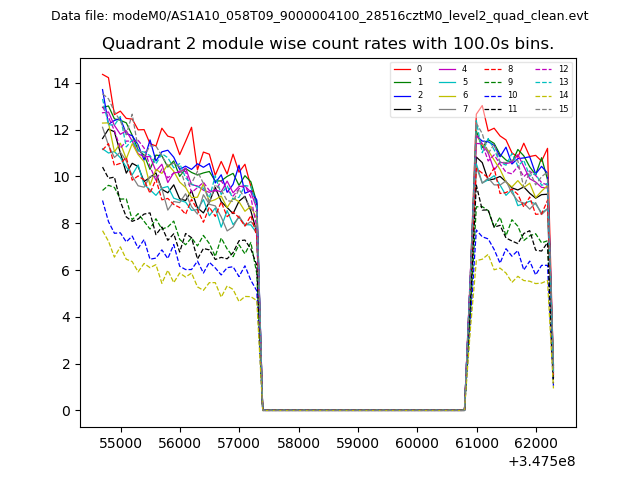
| Module-wise count rates for Quadrant C Data is divided into 100 sec bins |
 |
 |
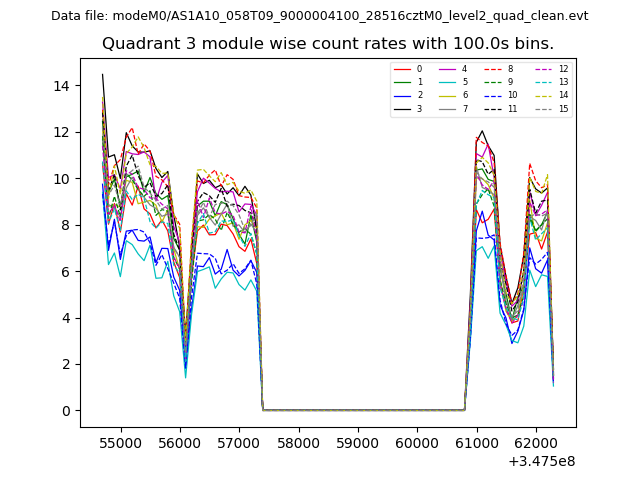
| Module-wise count rates for Quadrant D Data is divided into 100 sec bins |
 |
 |
| Parameter | Plot |
|---|---|
| CZT HV Monitor |  |
| D_VDD | 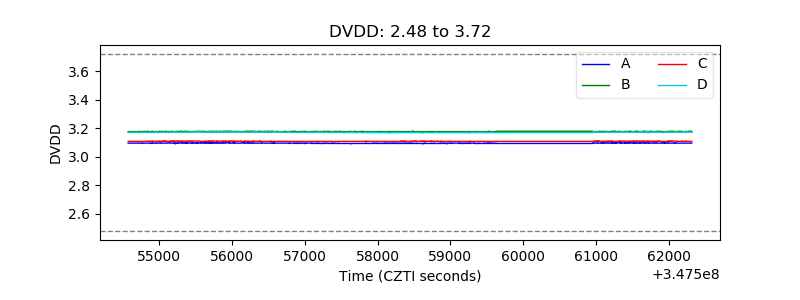 |
| Temperature 1 | 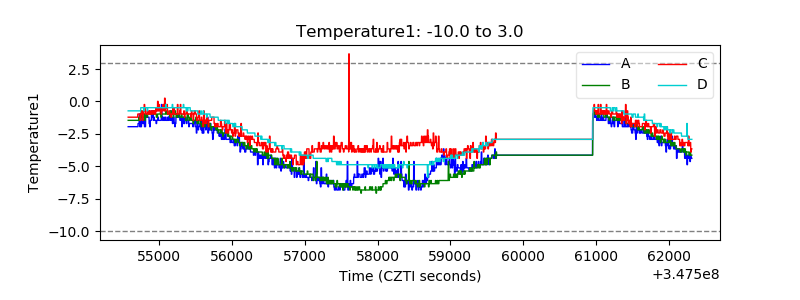 |
| Veto HV Monitor | 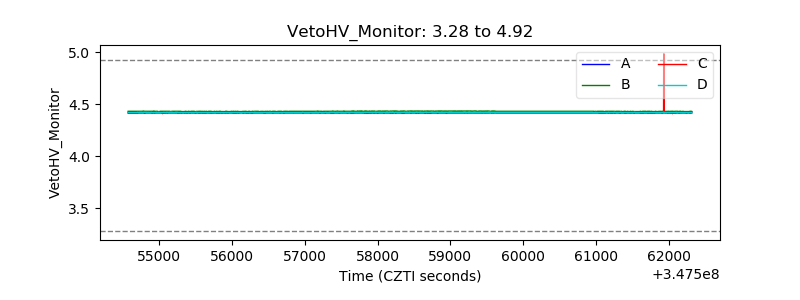 |
| Veto LLD | 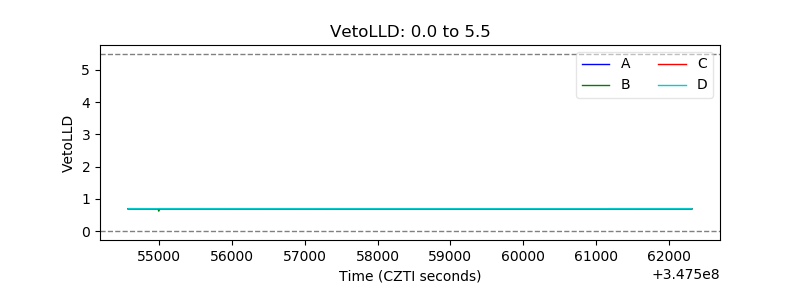 |
| Alpha Counter | 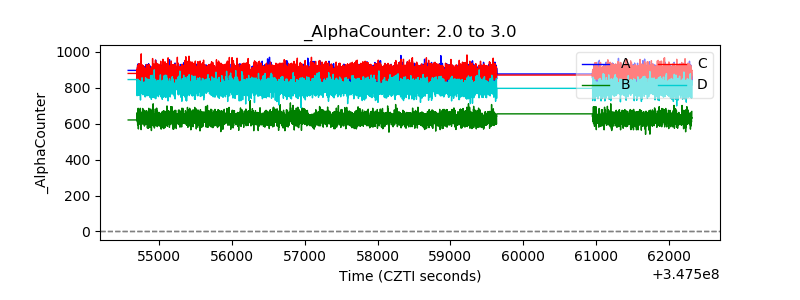 |
| _CPM_Rate | 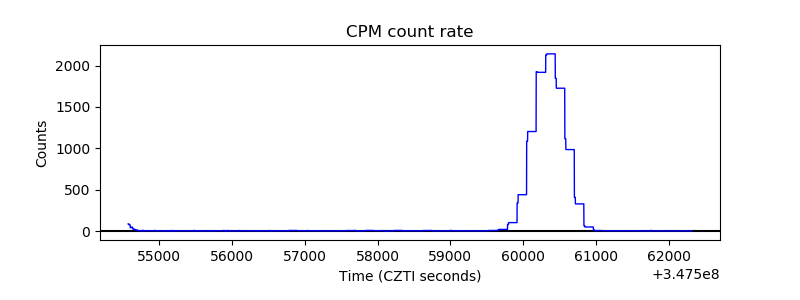 |
| CZT Counter | 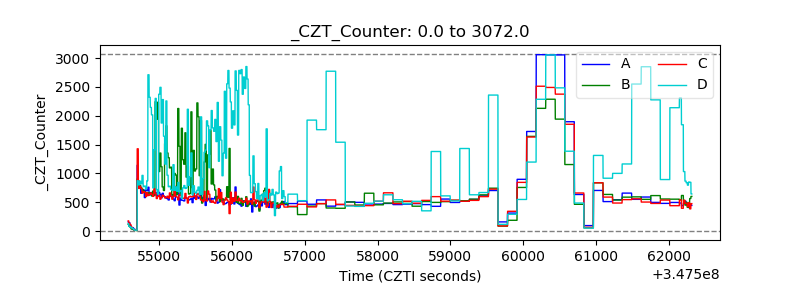 |
| +2.5 Volts monitor |  |
| +5 Volts monitor |  |
| _ROLL_ROT | 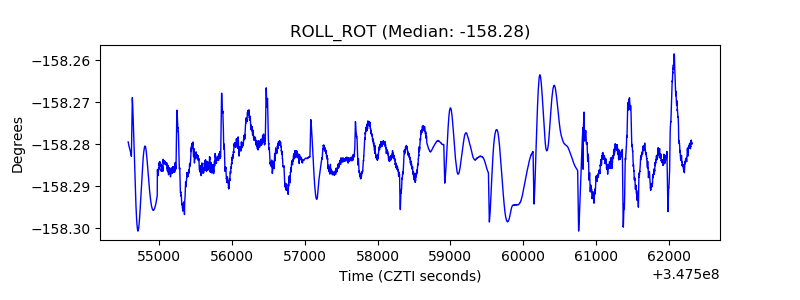 |
| _Roll_DEC | 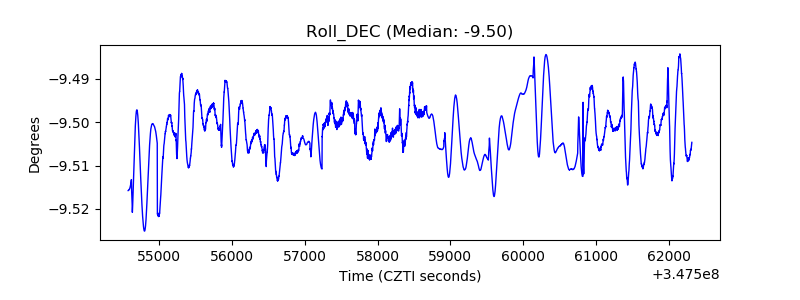 |
| _Roll_RA | 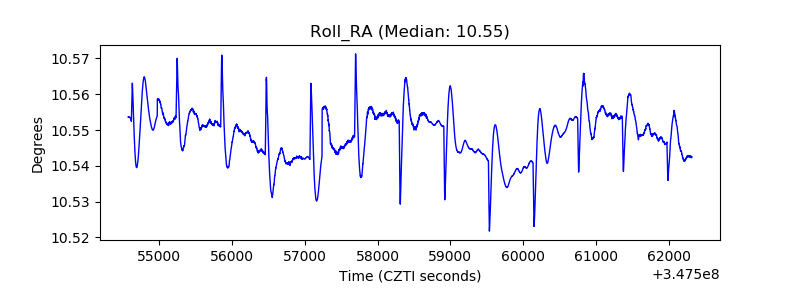 |
| Veto Counter | 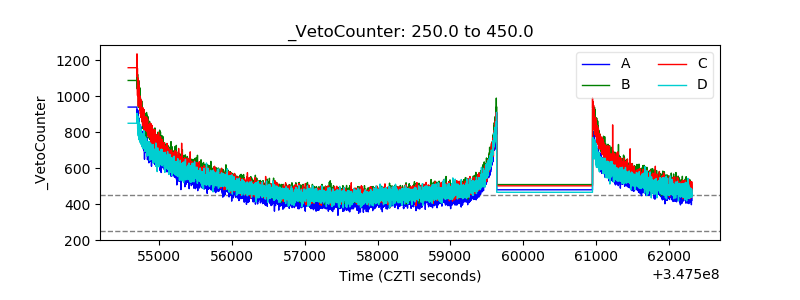 |