| Param | Original file | Final file |
|---|---|---|
| Filename | modeM0/AS1A10_058T09_9000004100_28519cztM0_level2.evt | modeM0/AS1A10_058T09_9000004100_28519cztM0_level2_quad_clean.evt |
| Size (bytes) | 625,008,960 | 94,809,600 |
| Size | 596.1 MB | 90.4 MB |
| Events in quadrant A | 4,257,196 | 602,407 |
| Events in quadrant B | 4,056,659 | 611,053 |
| Events in quadrant C | 3,645,042 | 585,059 |
| Events in quadrant D | 6,479,190 | 568,372 |
| Mode SS | |||
|---|---|---|---|
| Quadrant | BADHDUFLAG | Total packets | Discarded packets |
| A | 0 | 146 | 0 |
| B | 0 | 146 | 0 |
| C | 0 | 146 | 0 |
| D | 0 | 146 | 0 |
| Mode M9 | |||
|---|---|---|---|
| Quadrant | BADHDUFLAG | Total packets | Discarded packets |
| A | 0 | 13 | 0 |
| B | 0 | 14 | 0 |
| C | 0 | 14 | 0 |
| D | 0 | 14 | 0 |
| Mode M0 | |||
|---|---|---|---|
| Quadrant | BADHDUFLAG | Total packets | Discarded packets |
| A | 0 | 17393 | 2 |
| B | 0 | 16635 | 2 |
| C | 0 | 15184 | 2 |
| D | 0 | 24323 | 2 |
| Quadrant | Total seconds | Saturated seconds | Saturation percentage |
|---|---|---|---|
| A | 7245 | 281 | 3.878537% |
| B | 7245 | 153 | 2.111801% |
| C | 7245 | 95 | 1.311249% |
| D | 7245 | 594 | 8.198758% |
Noise dominated data is calculated using 1-second bins in cleaned event files. If a bin has >2000 counts, and if more than 50% of those come from <1% of pixels, then it is considered to be noise-dominated and hence unusable.
| Quadrant | # 1 sec bins | Bins with >0 counts | Bins with >2000 counts | High rate bins dominated by noise | Noise dominated (total time) | Noise dominated (detector-on time) | Marked lightcurve |
|---|---|---|---|---|---|---|---|
| A | 7810 | 7246 | 197 | 197 | 2.52% | 2.72% | 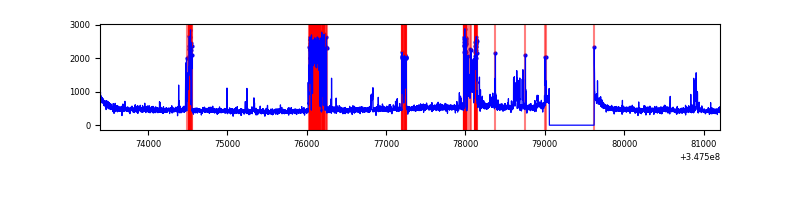 |
| B | 7810 | 7246 | 76 | 76 | 0.97% | 1.05% | 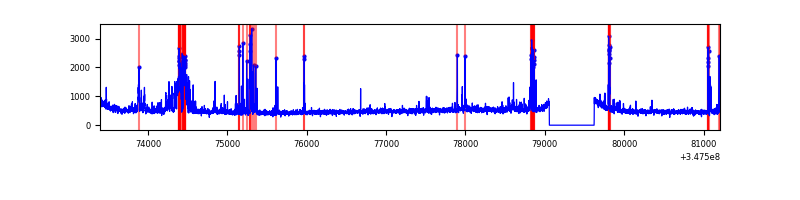 |
| C | 7810 | 7246 | 1 | 1 | 0.01% | 0.01% | 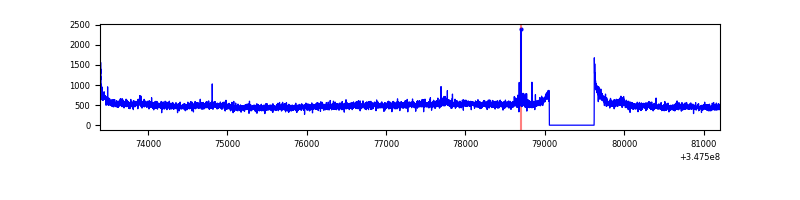 |
| D | 7810 | 7246 | 656 | 656 | 8.40% | 9.05% | 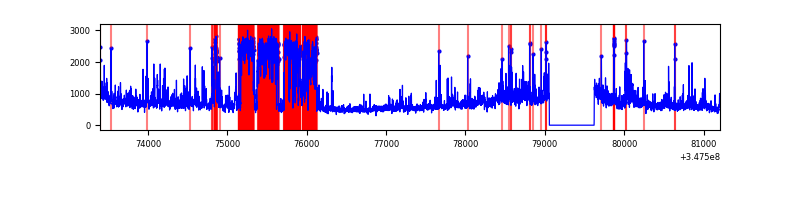 |
Top three noisy pixels from each quadrant. If the there are fewer than three noisy pixels in the level2.evt file, extra rows are filled as -1
| Pixel properties | Quadrant properties | ||||||
|---|---|---|---|---|---|---|---|
| Quadrant | DetID | PixID | Counts | Sigma | Mean | Median | Sigma |
| A | 15 | 174 | 854795 | 4787.27 | 879 | 861 | 178.4 |
| A | 13 | 254 | 13046 | 68.31 | 879 | 861 | 178.4 |
| A | 3 | 137 | 8548 | 43.09 | 879 | 861 | 178.4 |
| B | 10 | 245 | 441750 | 2608.13 | 880 | 856 | 169.0 |
| B | 5 | 172 | 63381 | 369.87 | 880 | 856 | 169.0 |
| B | 0 | 230 | 57722 | 336.39 | 880 | 856 | 169.0 |
| C | 3 | 233 | 187748 | 936.71 | 848 | 854 | 199.5 |
| C | 14 | 238 | 137015 | 682.44 | 848 | 854 | 199.5 |
| C | 7 | 247 | 15454 | 73.18 | 848 | 854 | 199.5 |
| D | 1 | 52 | 2004625 | 9905.46 | 841 | 817 | 202.3 |
| D | 8 | 195 | 1067084 | 5270.9 | 841 | 817 | 202.3 |
| D | 2 | 250 | 104549 | 512.78 | 841 | 817 | 202.3 |
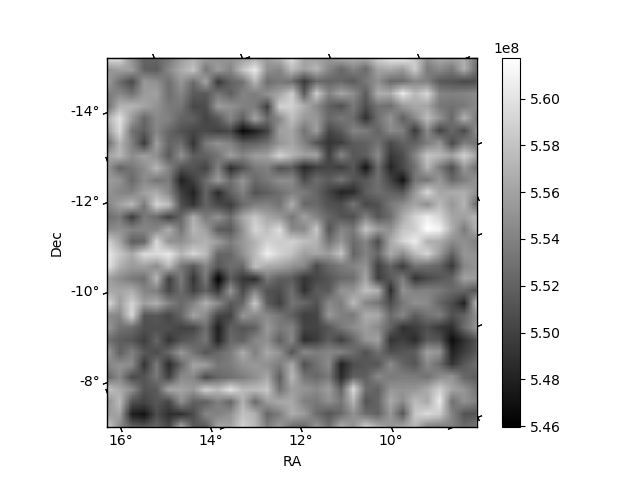
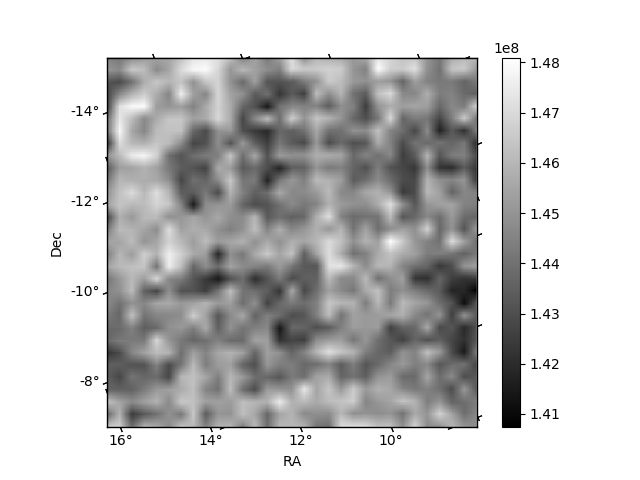
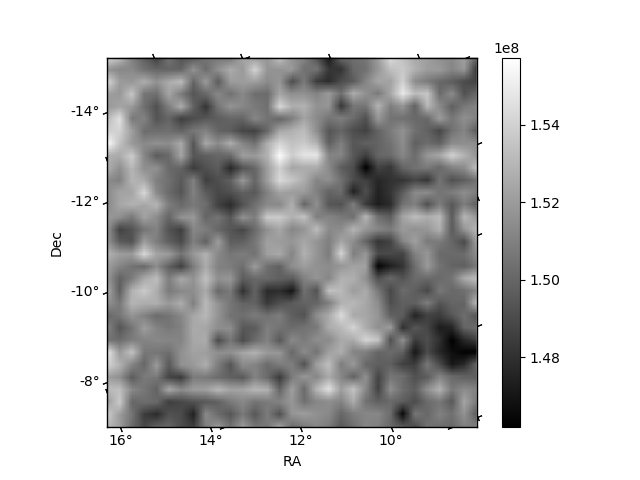
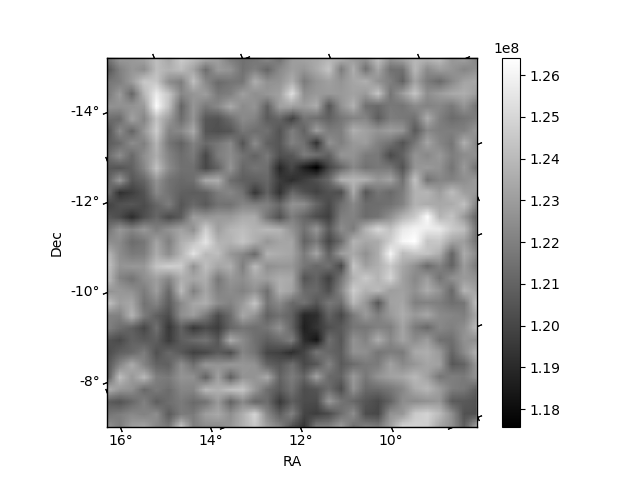
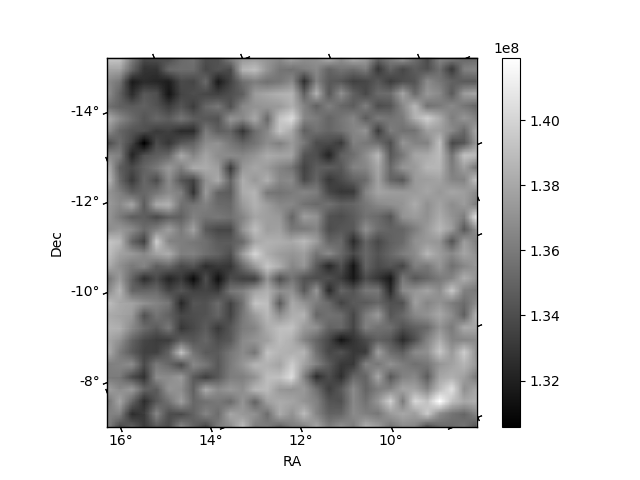
Histogram calculated using DETX and DETY for each event in the final _common_clean file
| Quadrant A | 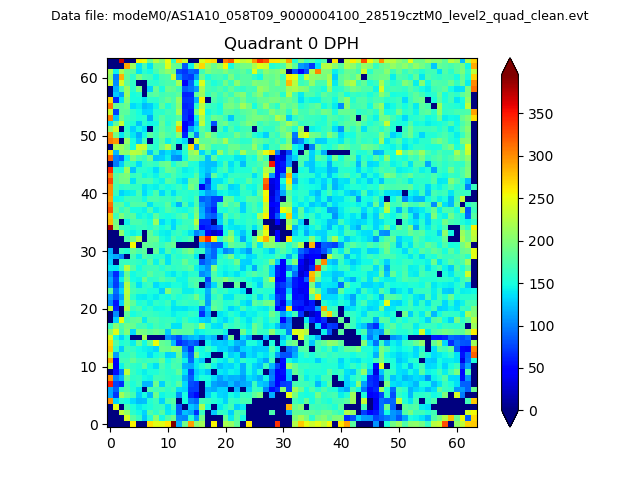 |
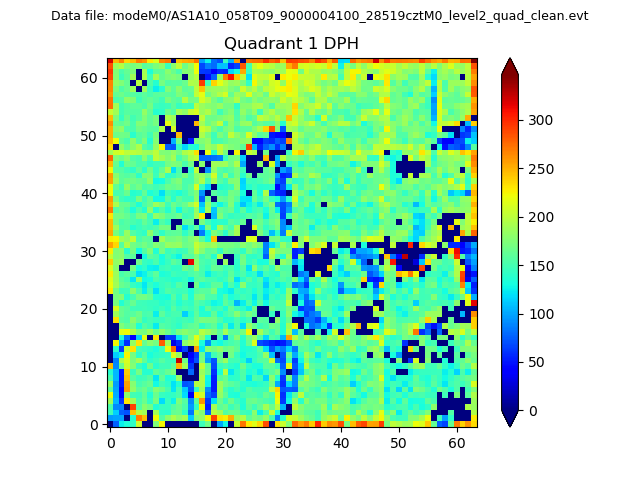 |
Quadrant B |
|---|---|---|---|
| Quadrant D | 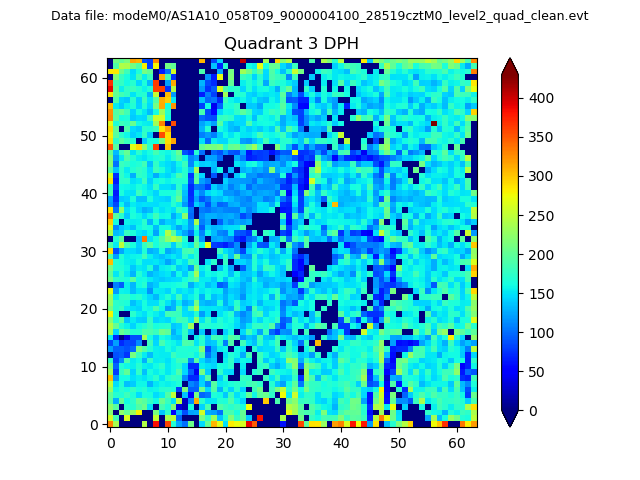 |
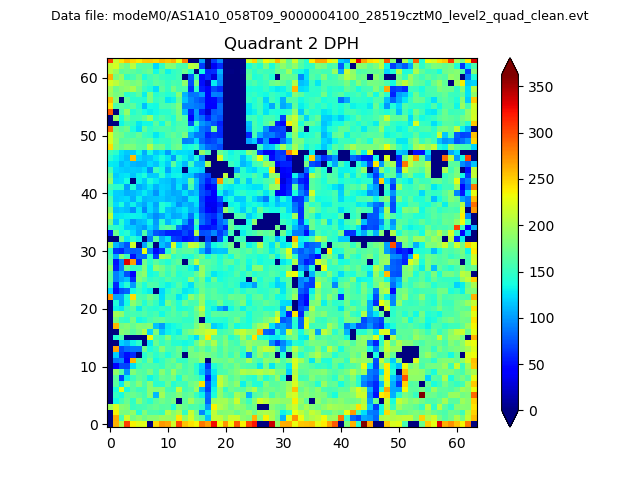 |
Quadrant C |
| Plot type | Count rate plots | Images |
|---|---|---|
| Comparison with Poisson distribution Blue bars denote a histogram of data divided into 1 sec bins. Red curve is a Poisson curve with rate = median count rate of data. |
 |
 |
| Quadrant-wise count rates Data is divided into 100 sec bins |
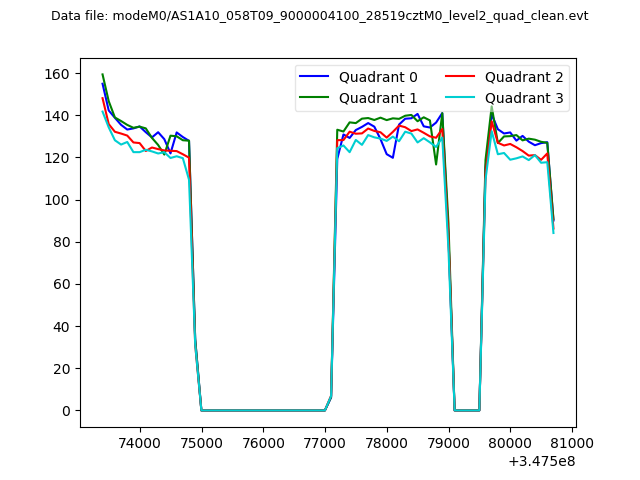 |
|
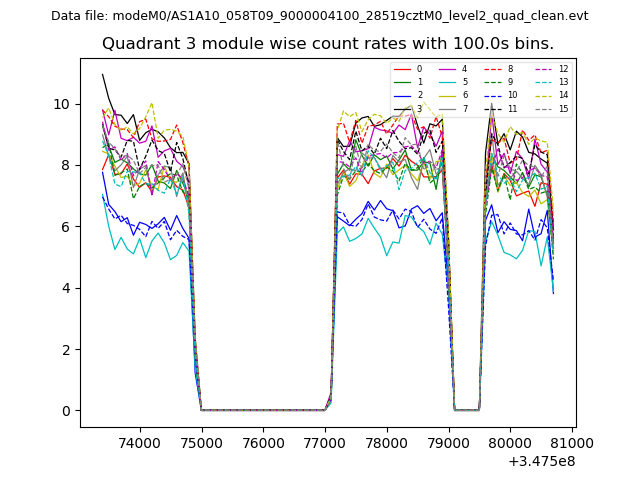
| Module-wise count rates for Quadrant A Data is divided into 100 sec bins |
 |
 |
| Module-wise count rates for Quadrant B Data is divided into 100 sec bins |
 |
 |
| Module-wise count rates for Quadrant C Data is divided into 100 sec bins |
 |
 |
| Module-wise count rates for Quadrant D Data is divided into 100 sec bins |
 |
 |
| Parameter | Plot |
|---|---|
| CZT HV Monitor |  |
| D_VDD | 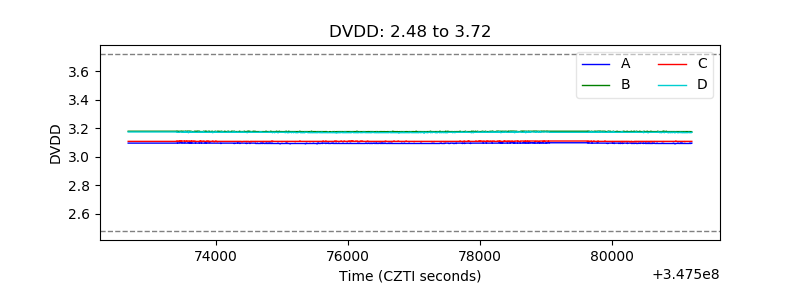 |
| Temperature 1 | 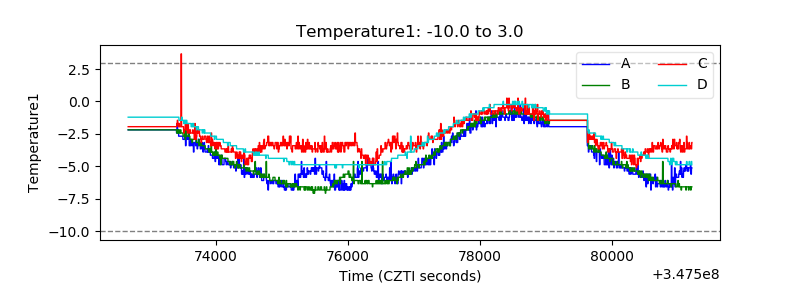 |
| Veto HV Monitor | 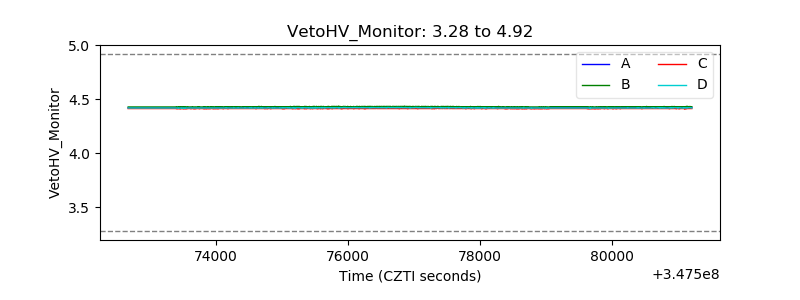 |
| Veto LLD | 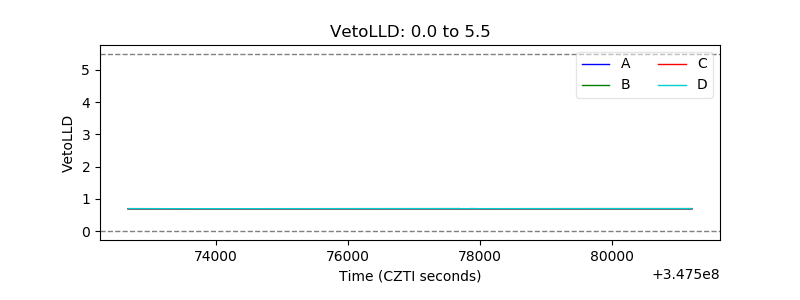 |
| Alpha Counter | 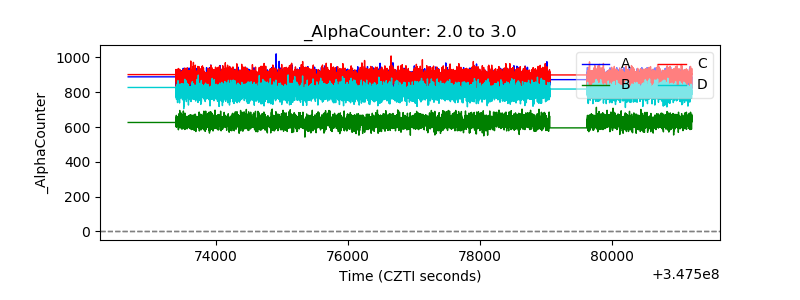 |
| _CPM_Rate | 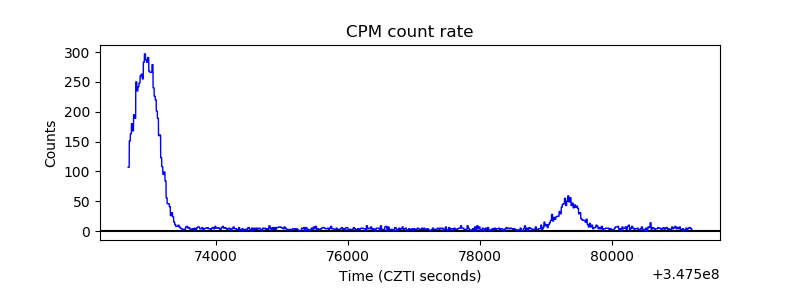 |
| CZT Counter | 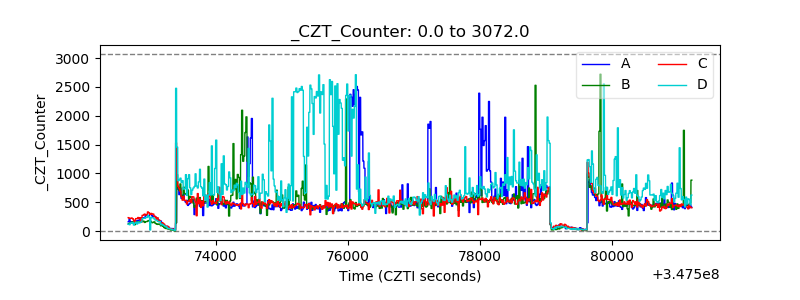 |
| +2.5 Volts monitor | 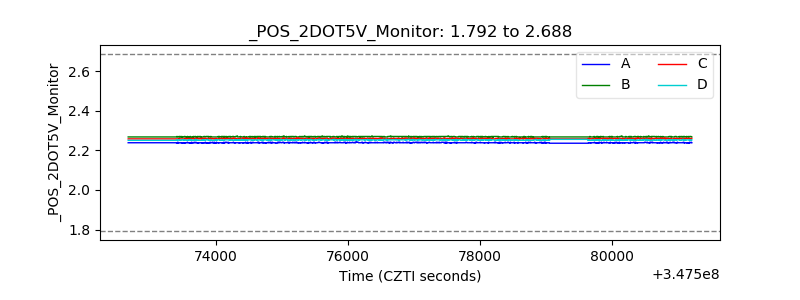 |
| +5 Volts monitor |  |
| _ROLL_ROT | 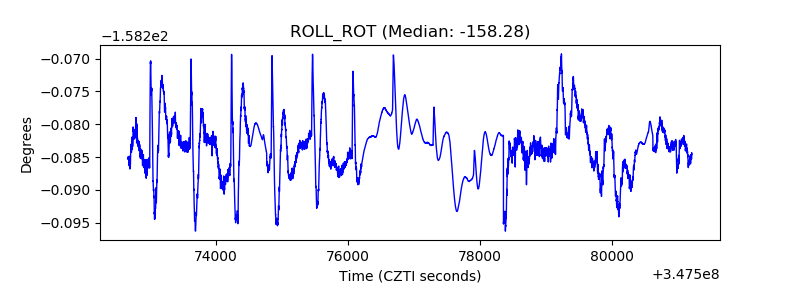 |
| _Roll_DEC | 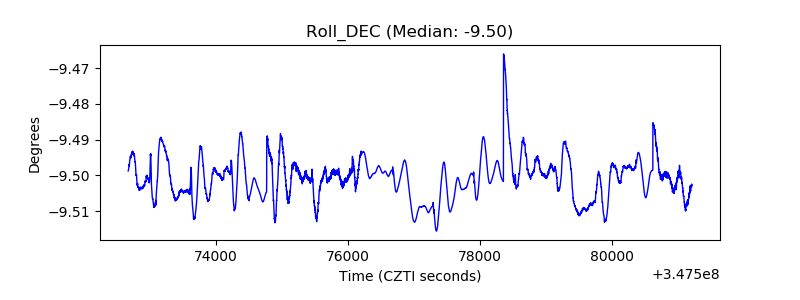 |
| _Roll_RA | 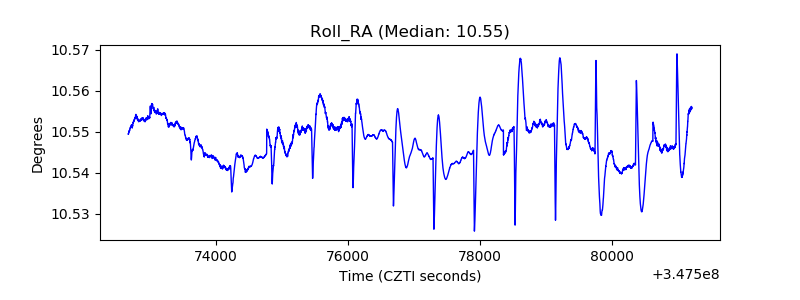 |
| Veto Counter | 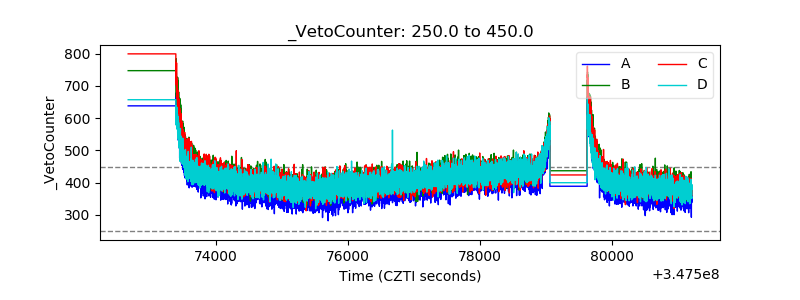 |