| Param | Original file | Final file |
|---|---|---|
| Filename | modeM0/AS1A10_058T09_9000004100_28524cztM0_level2.evt | modeM0/AS1A10_058T09_9000004100_28524cztM0_level2_quad_clean.evt |
| Size (bytes) | 3,047,817,600 | 456,534,720 |
| Size | 2.8 GB | 435.4 MB |
| Events in quadrant A | 21,706,762 | 2,861,410 |
| Events in quadrant B | 20,325,666 | 2,920,194 |
| Events in quadrant C | 18,192,833 | 2,819,883 |
| Events in quadrant D | 29,595,717 | 2,693,509 |
| Mode SS | |||
|---|---|---|---|
| Quadrant | BADHDUFLAG | Total packets | Discarded packets |
| A | 0 | 746 | 0 |
| B | 0 | 746 | 0 |
| C | 0 | 746 | 0 |
| D | 0 | 746 | 0 |
| Mode M9 | |||
|---|---|---|---|
| Quadrant | BADHDUFLAG | Total packets | Discarded packets |
| A | 0 | 44 | 0 |
| B | 0 | 44 | 0 |
| C | 0 | 44 | 0 |
| D | 0 | 44 | 0 |
| Mode M0 | |||
|---|---|---|---|
| Quadrant | BADHDUFLAG | Total packets | Discarded packets |
| A | 0 | 88683 | 7 |
| B | 0 | 83404 | 7 |
| C | 0 | 76764 | 7 |
| D | 0 | 112474 | 8 |
| Quadrant | Total seconds | Saturated seconds | Saturation percentage |
|---|---|---|---|
| A | 36885 | 1348 | 3.654602% |
| B | 36886 | 714 | 1.935694% |
| C | 36886 | 550 | 1.491081% |
| D | 36886 | 2046 | 5.546820% |
Noise dominated data is calculated using 1-second bins in cleaned event files. If a bin has >2000 counts, and if more than 50% of those come from <1% of pixels, then it is considered to be noise-dominated and hence unusable.
| Quadrant | # 1 sec bins | Bins with >0 counts | Bins with >2000 counts | High rate bins dominated by noise | Noise dominated (total time) | Noise dominated (detector-on time) | Marked lightcurve |
|---|---|---|---|---|---|---|---|
| A | 45419 | 36887 | 807 | 807 | 1.78% | 2.19% | 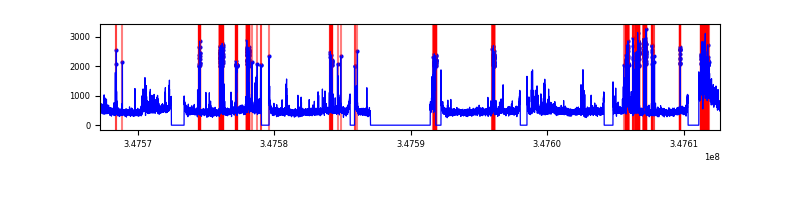 |
| B | 45420 | 36889 | 261 | 261 | 0.57% | 0.71% | 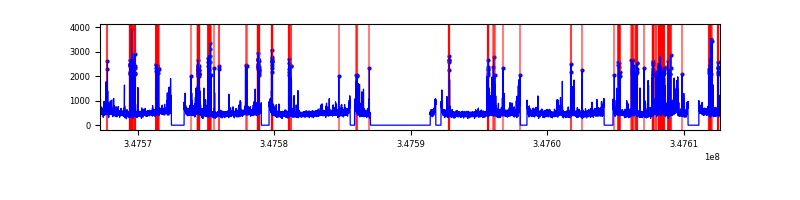 |
| C | 45420 | 36888 | 1 | 1 | 0.00% | 0.00% | 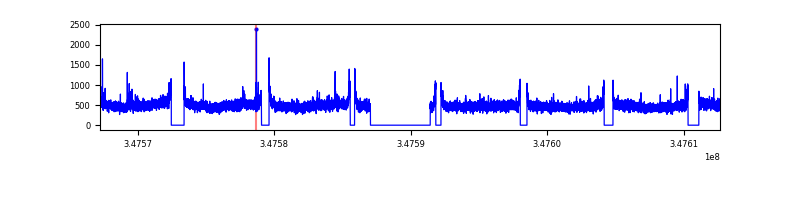 |
| D | 45420 | 36889 | 1814 | 1814 | 3.99% | 4.92% | 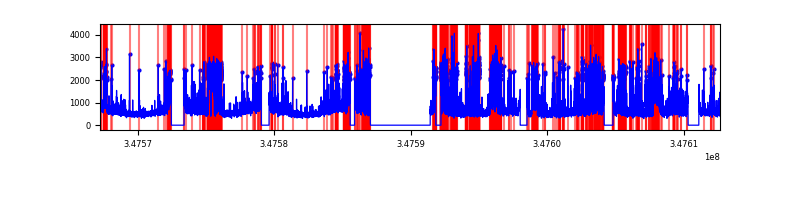 |
Top three noisy pixels from each quadrant. If the there are fewer than three noisy pixels in the level2.evt file, extra rows are filled as -1
| Pixel properties | Quadrant properties | ||||||
|---|---|---|---|---|---|---|---|
| Quadrant | DetID | PixID | Counts | Sigma | Mean | Median | Sigma |
| A | 15 | 174 | 4361447 | 4817.35 | 4488 | 4387 | 904.5 |
| A | 13 | 254 | 66539 | 68.72 | 4488 | 4387 | 904.5 |
| A | 3 | 137 | 44255 | 44.08 | 4488 | 4387 | 904.5 |
| B | 10 | 245 | 1944389 | 2262.54 | 4498 | 4378 | 857.4 |
| B | 0 | 230 | 225376 | 257.74 | 4498 | 4378 | 857.4 |
| B | 4 | 171 | 146979 | 166.31 | 4498 | 4378 | 857.4 |
| C | 14 | 238 | 696157 | 684.86 | 4336 | 4368 | 1010.1 |
| C | 3 | 233 | 547357 | 537.55 | 4336 | 4368 | 1010.1 |
| C | 7 | 247 | 55040 | 50.16 | 4336 | 4368 | 1010.1 |
| D | 1 | 52 | 6592209 | 6390.51 | 4303 | 4194 | 1030.9 |
| D | 8 | 195 | 5615853 | 5443.42 | 4303 | 4194 | 1030.9 |
| D | 2 | 250 | 484314 | 465.73 | 4303 | 4194 | 1030.9 |
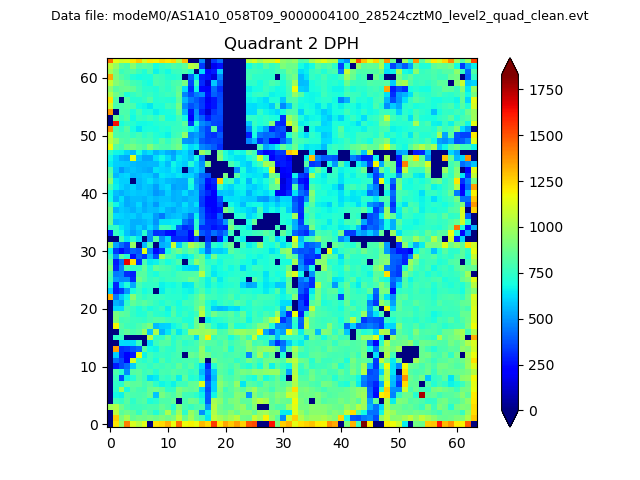
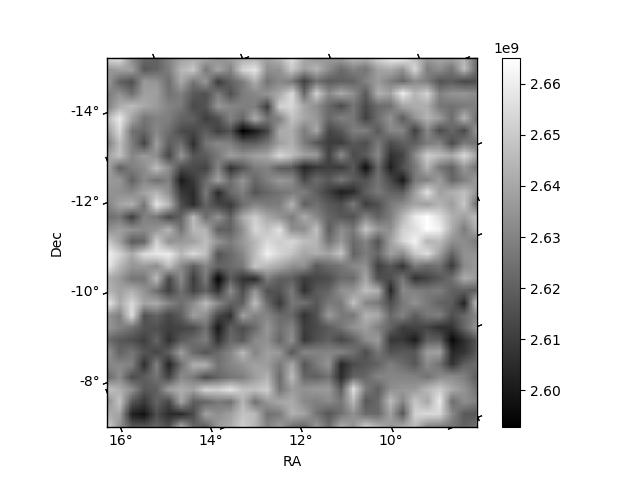
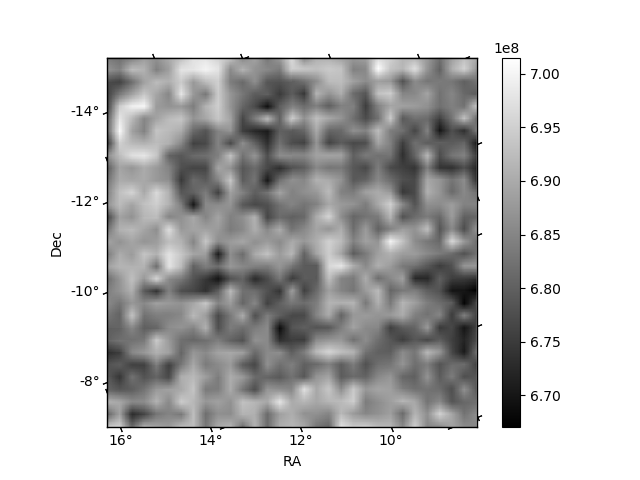
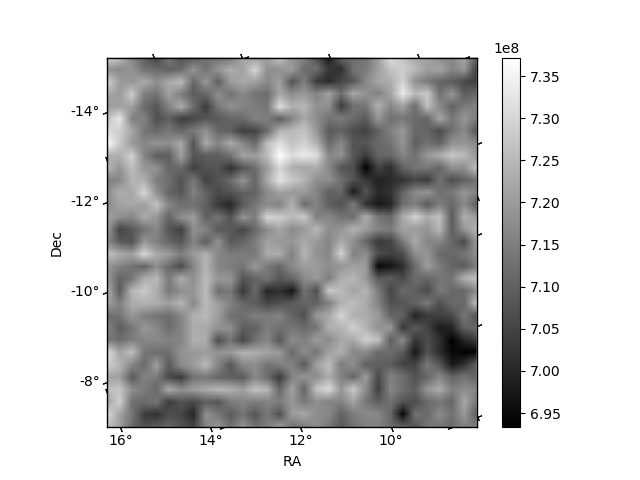
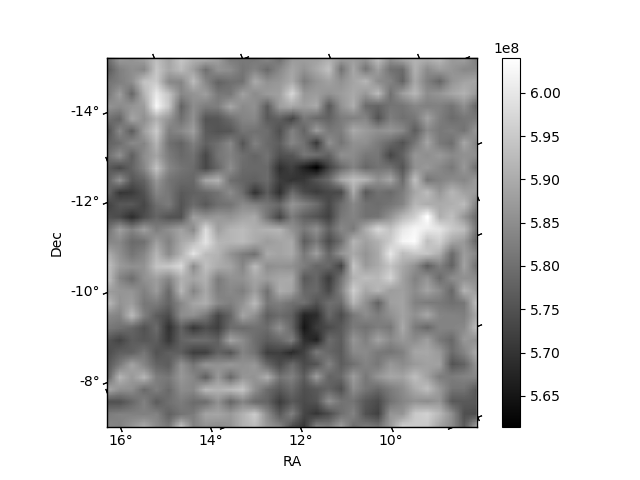
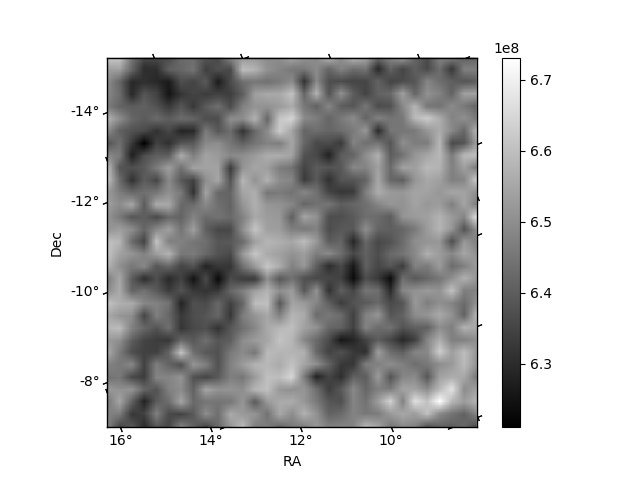
Histogram calculated using DETX and DETY for each event in the final _common_clean file
| Quadrant A | 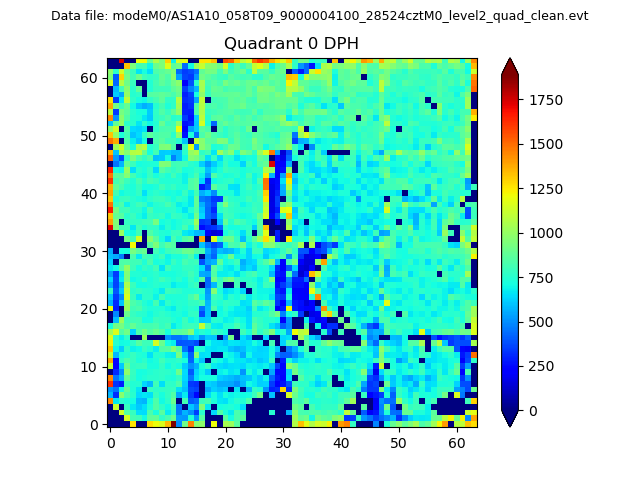 |
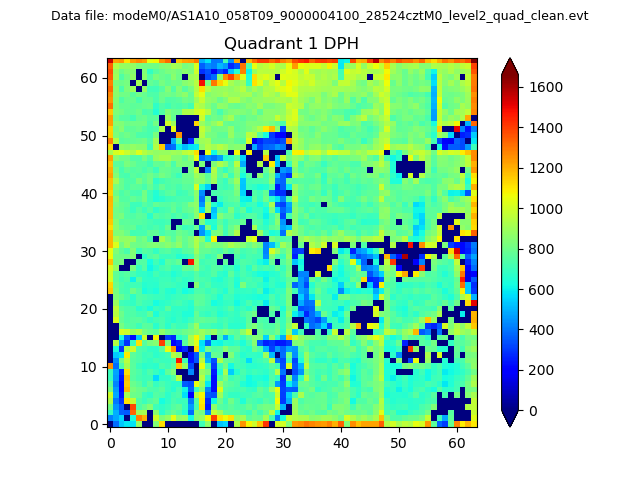 |
Quadrant B |
|---|---|---|---|
| Quadrant D | 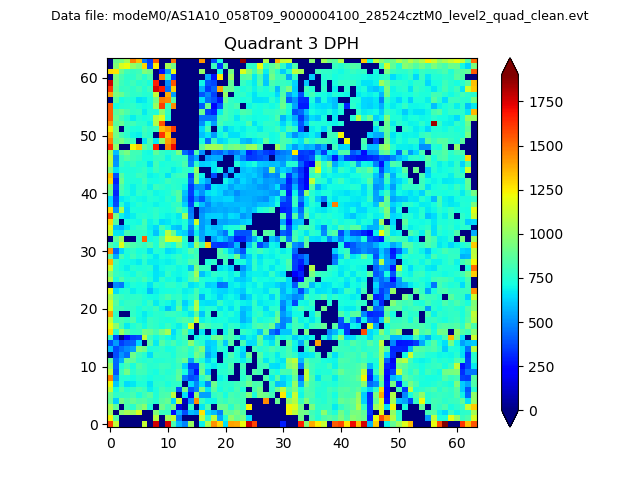 |
 |
Quadrant C |
| Plot type | Count rate plots | Images |
|---|---|---|
| Comparison with Poisson distribution Blue bars denote a histogram of data divided into 1 sec bins. Red curve is a Poisson curve with rate = median count rate of data. |
 |
 |
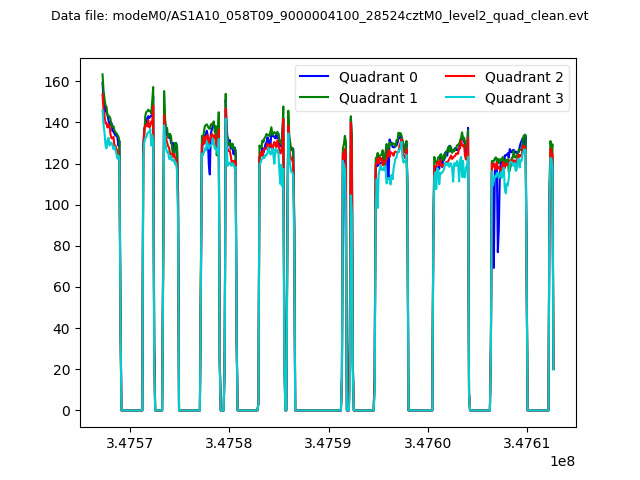
| Quadrant-wise count rates Data is divided into 100 sec bins |
 |
|
| Module-wise count rates for Quadrant A Data is divided into 100 sec bins |
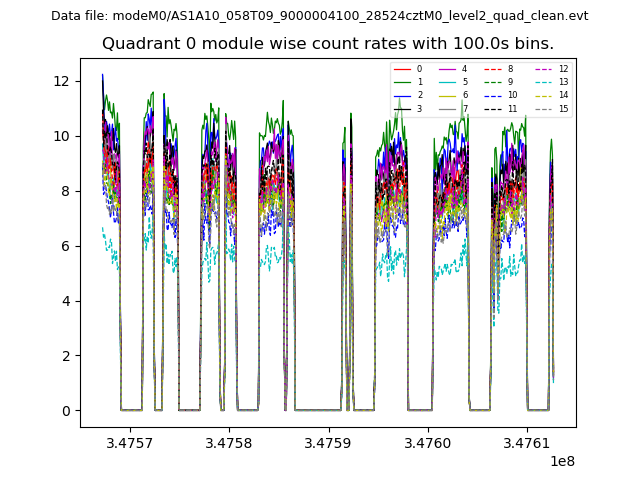 |
 |
| Module-wise count rates for Quadrant B Data is divided into 100 sec bins |
 |
 |
| Module-wise count rates for Quadrant C Data is divided into 100 sec bins |
 |
 |
| Module-wise count rates for Quadrant D Data is divided into 100 sec bins |
 |
 |
| Parameter | Plot |
|---|---|
| CZT HV Monitor |  |
| D_VDD | 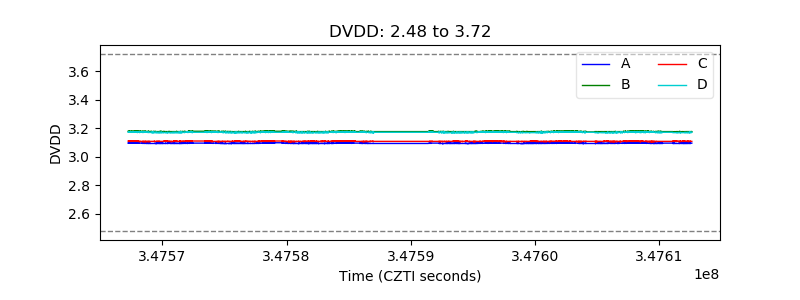 |
| Temperature 1 | 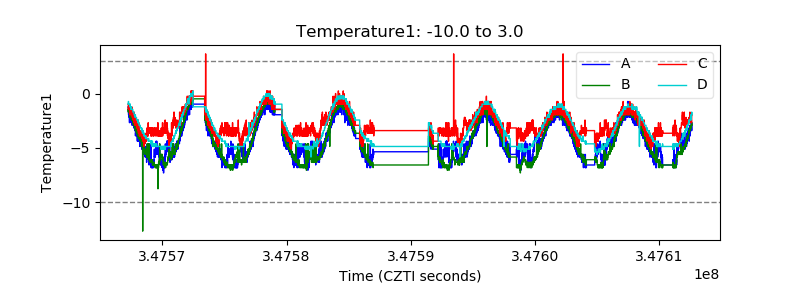 |
| Veto HV Monitor | 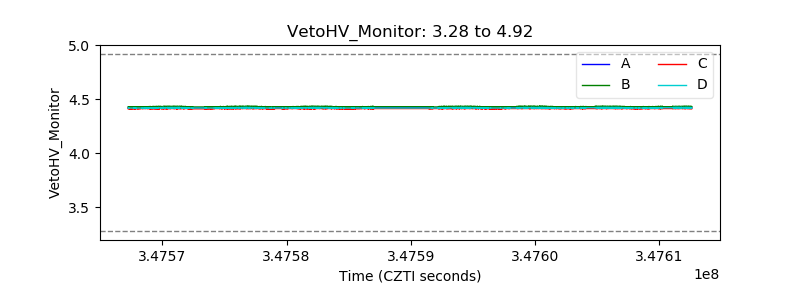 |
| Veto LLD | 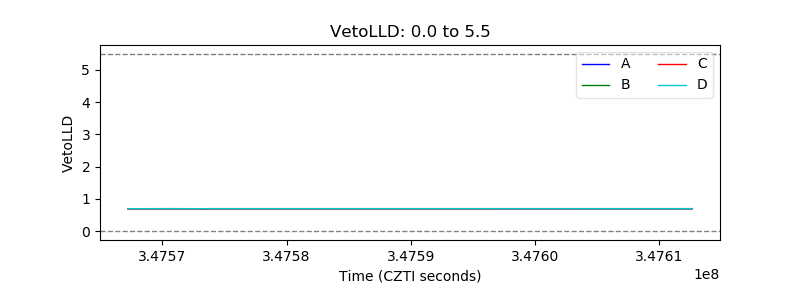 |
| Alpha Counter | 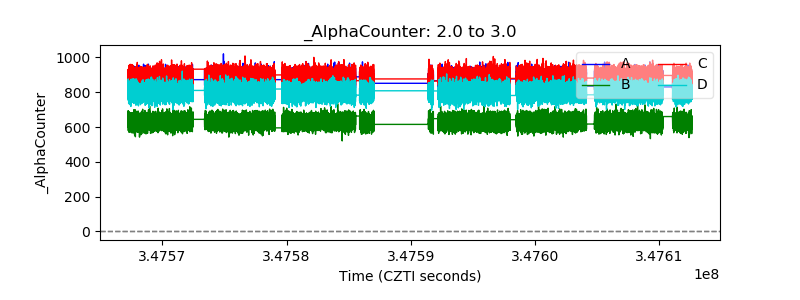 |
| _CPM_Rate | 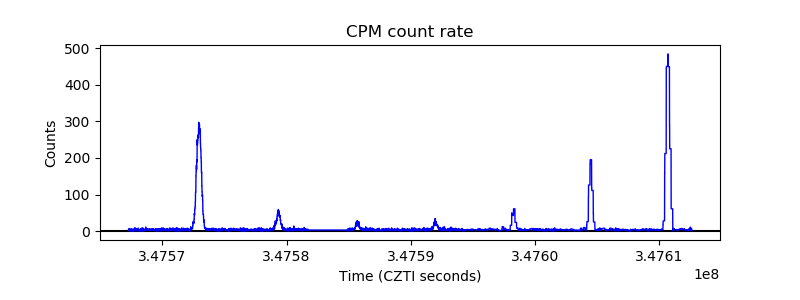 |
| CZT Counter | 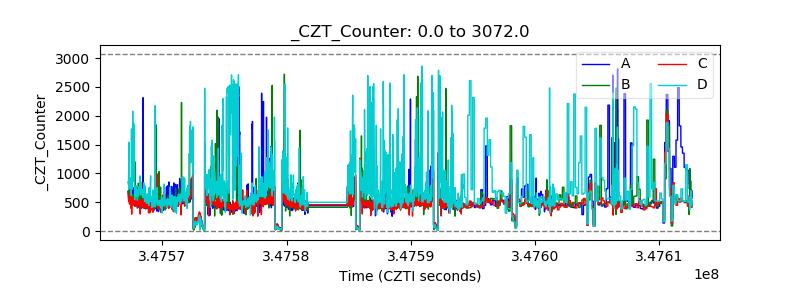 |
| +2.5 Volts monitor | 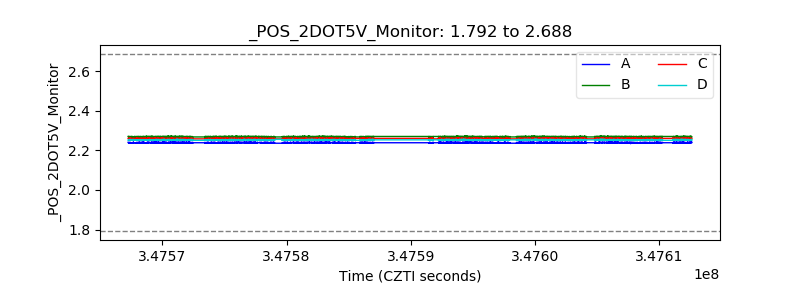 |
| +5 Volts monitor |  |
| _ROLL_ROT |  |
| _Roll_DEC | 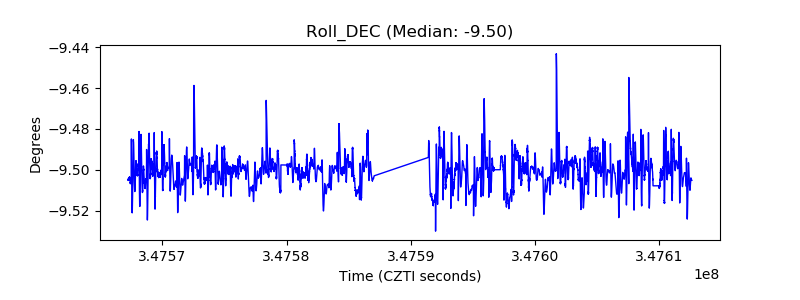 |
| _Roll_RA | 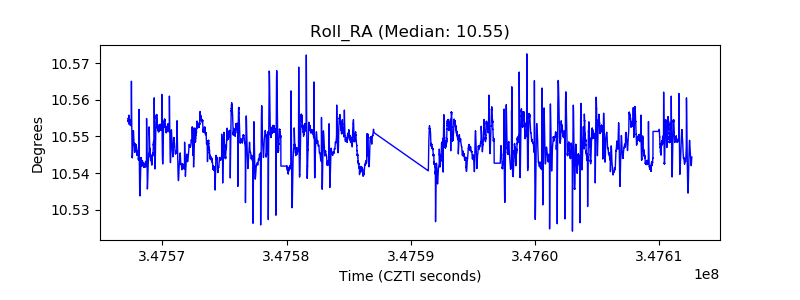 |
| Veto Counter |  |