| Param | Original file | Final file |
|---|---|---|
| Filename | modeM0/AS1A10_058T09_9000004100_28528cztM0_level2.evt | modeM0/AS1A10_058T09_9000004100_28528cztM0_level2_quad_clean.evt |
| Size (bytes) | 551,914,560 | 106,560,000 |
| Size | 526.3 MB | 101.6 MB |
| Events in quadrant A | 4,248,652 | 729,377 |
| Events in quadrant B | 3,676,760 | 732,812 |
| Events in quadrant C | 3,109,318 | 687,497 |
| Events in quadrant D | 5,268,443 | 653,096 |
| Mode SS | |||
|---|---|---|---|
| Quadrant | BADHDUFLAG | Total packets | Discarded packets |
| A | 0 | 124 | 0 |
| B | 0 | 124 | 0 |
| C | 0 | 124 | 0 |
| D | 0 | 124 | 0 |
| Mode M9 | |||
|---|---|---|---|
| Quadrant | BADHDUFLAG | Total packets | Discarded packets |
| A | 0 | 12 | 0 |
| B | 0 | 12 | 0 |
| C | 0 | 12 | 0 |
| D | 0 | 12 | 0 |
| Mode M0 | |||
|---|---|---|---|
| Quadrant | BADHDUFLAG | Total packets | Discarded packets |
| A | 0 | 16667 | 1 |
| B | 0 | 14902 | 1 |
| C | 0 | 13122 | 1 |
| D | 0 | 19966 | 1 |
| Quadrant | Total seconds | Saturated seconds | Saturation percentage |
|---|---|---|---|
| A | 6076 | 480 | 7.899934% |
| B | 6077 | 115 | 1.892381% |
| C | 6077 | 81 | 1.332895% |
| D | 6077 | 451 | 7.421425% |
Noise dominated data is calculated using 1-second bins in cleaned event files. If a bin has >2000 counts, and if more than 50% of those come from <1% of pixels, then it is considered to be noise-dominated and hence unusable.
| Quadrant | # 1 sec bins | Bins with >0 counts | Bins with >2000 counts | High rate bins dominated by noise | Noise dominated (total time) | Noise dominated (detector-on time) | Marked lightcurve |
|---|---|---|---|---|---|---|---|
| A | 7291 | 6076 | 410 | 410 | 5.62% | 6.75% | 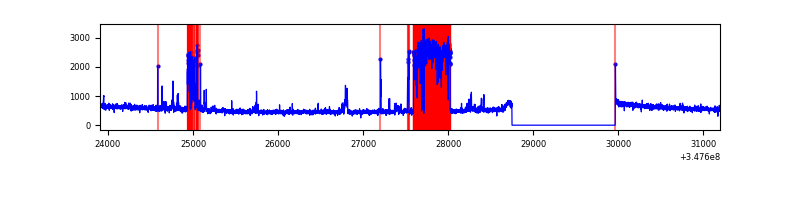 |
| B | 7292 | 6077 | 42 | 42 | 0.58% | 0.69% | 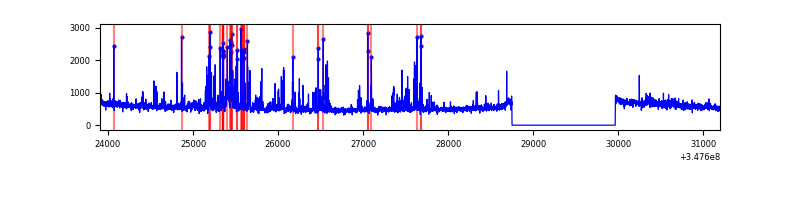 |
| C | 7292 | 6077 | 0 | 0 | 0.00% | 0.00% | 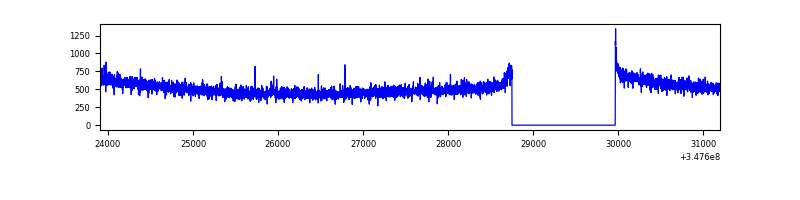 |
| D | 7292 | 6077 | 374 | 374 | 5.13% | 6.15% | 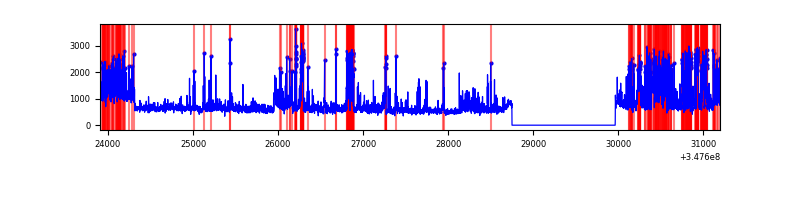 |
Top three noisy pixels from each quadrant. If the there are fewer than three noisy pixels in the level2.evt file, extra rows are filled as -1
| Pixel properties | Quadrant properties | ||||||
|---|---|---|---|---|---|---|---|
| Quadrant | DetID | PixID | Counts | Sigma | Mean | Median | Sigma |
| A | 15 | 174 | 1174767 | 7428.49 | 792 | 779 | 158.0 |
| A | 13 | 254 | 11327 | 66.74 | 792 | 779 | 158.0 |
| A | 1 | 113 | 8641 | 49.75 | 792 | 779 | 158.0 |
| B | 10 | 245 | 386022 | 2572.17 | 797 | 780 | 149.8 |
| B | 0 | 230 | 51891 | 341.26 | 797 | 780 | 149.8 |
| B | 4 | 171 | 47418 | 311.39 | 797 | 780 | 149.8 |
| C | 14 | 238 | 125954 | 711.91 | 759 | 766 | 175.8 |
| C | 3 | 233 | 16656 | 90.36 | 759 | 766 | 175.8 |
| C | 7 | 247 | 6374 | 31.89 | 759 | 766 | 175.8 |
| D | 1 | 52 | 1434522 | 7899.78 | 761 | 741 | 181.5 |
| D | 8 | 195 | 819137 | 4509.16 | 761 | 741 | 181.5 |
| D | 7 | 238 | 38599 | 208.59 | 761 | 741 | 181.5 |
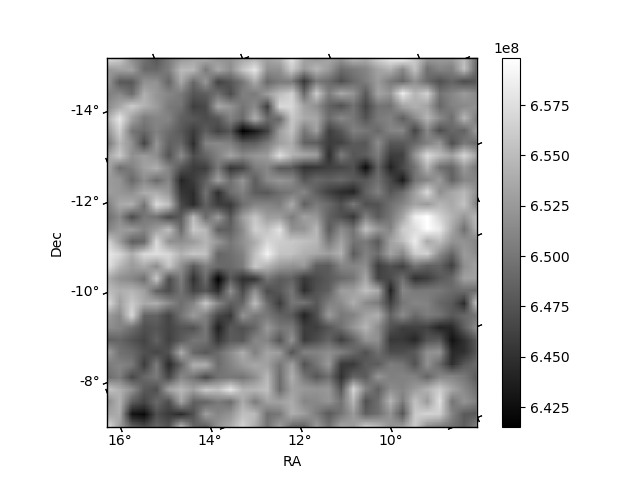
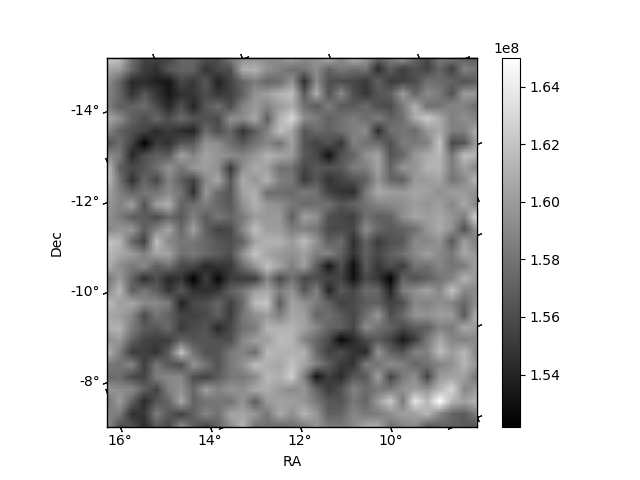
Histogram calculated using DETX and DETY for each event in the final _common_clean file
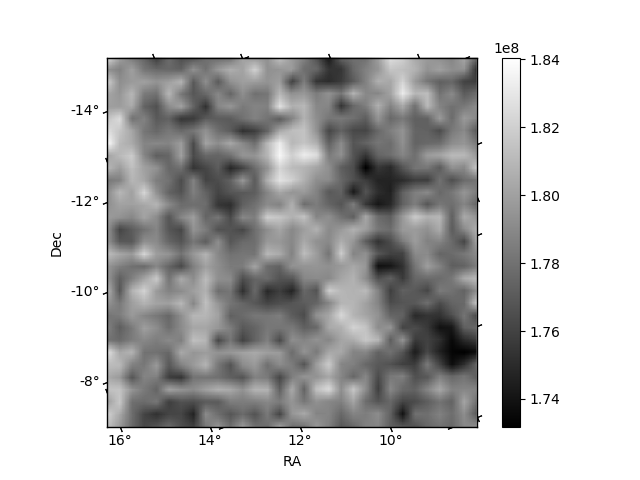
| Quadrant A | 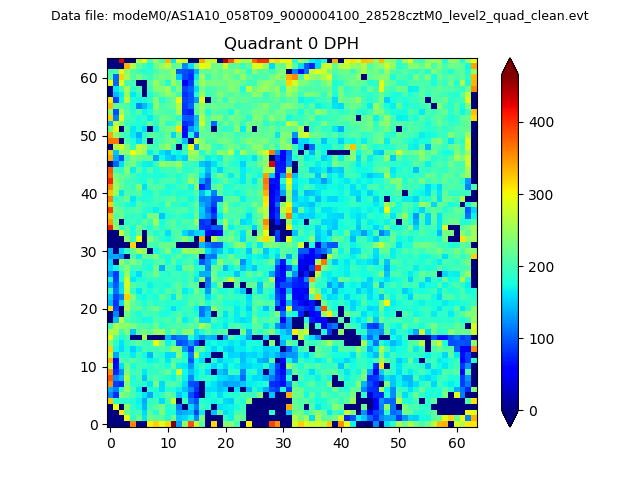 |
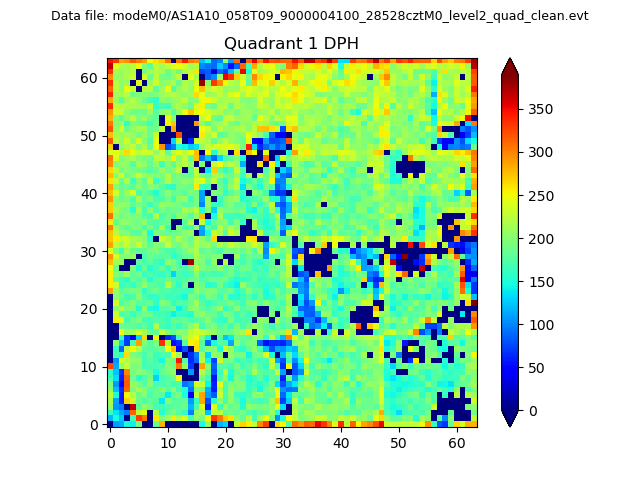 |
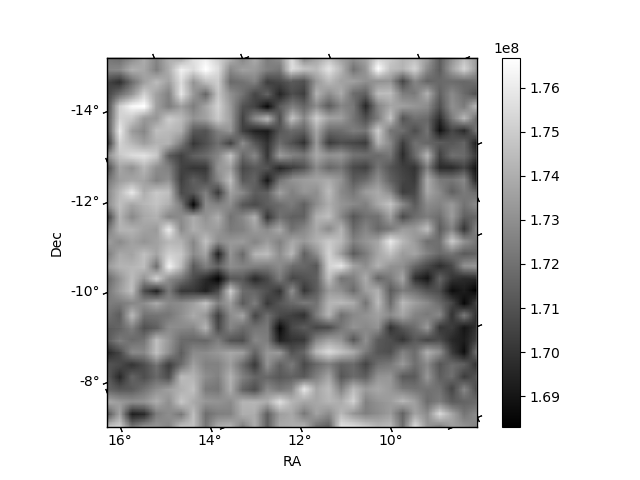
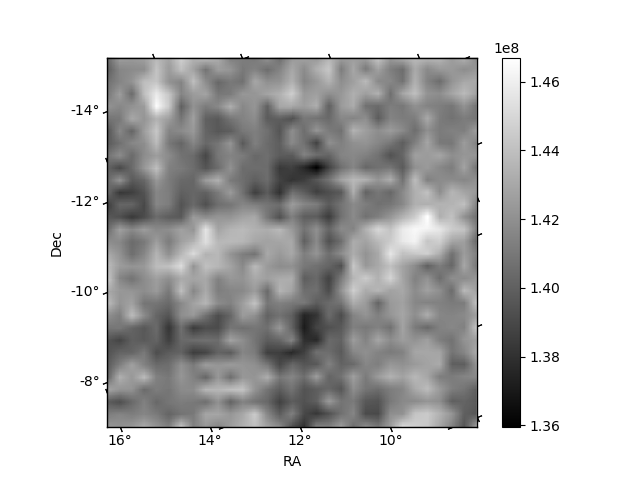
Quadrant B |
|---|---|---|---|
| Quadrant D | 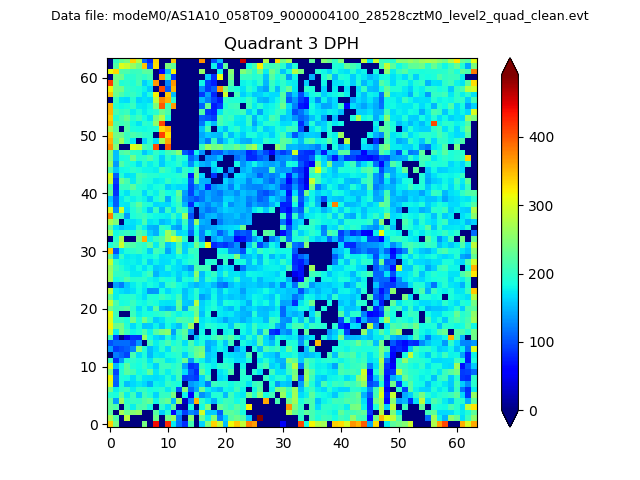 |
 |
Quadrant C |
| Plot type | Count rate plots | Images |
|---|---|---|
| Comparison with Poisson distribution Blue bars denote a histogram of data divided into 1 sec bins. Red curve is a Poisson curve with rate = median count rate of data. |
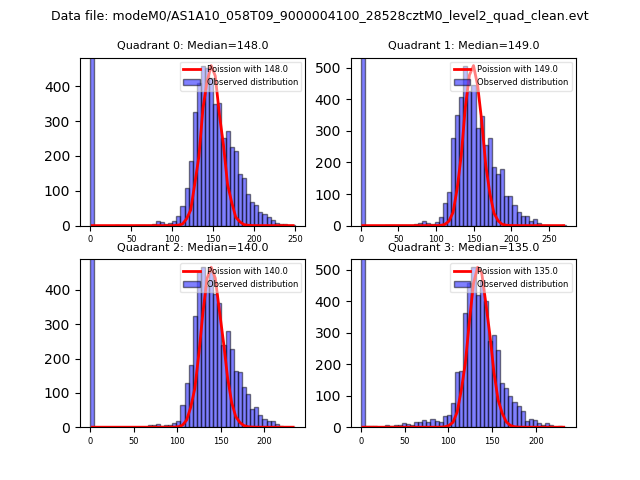 |
 |
| Quadrant-wise count rates Data is divided into 100 sec bins |
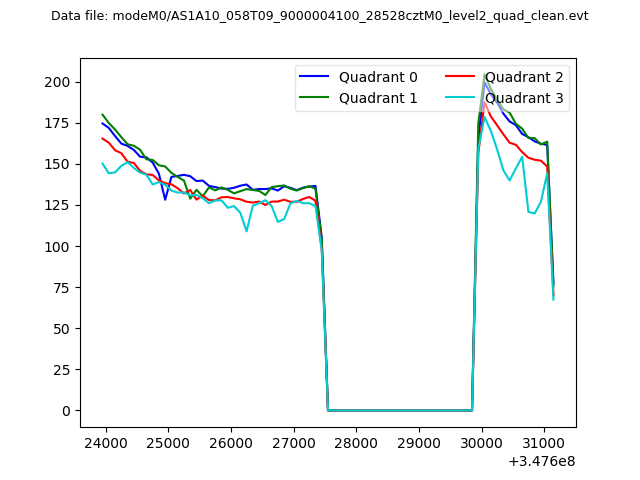 |
|
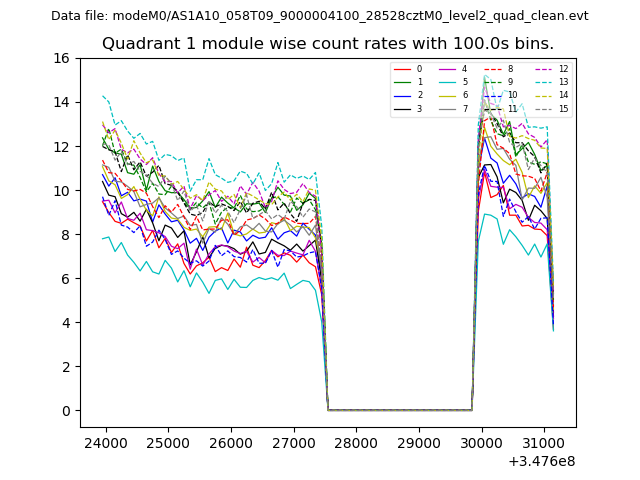
| Module-wise count rates for Quadrant A Data is divided into 100 sec bins |
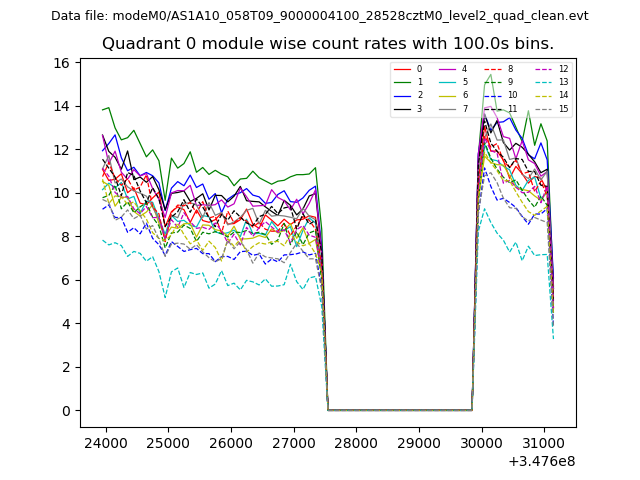 |
 |
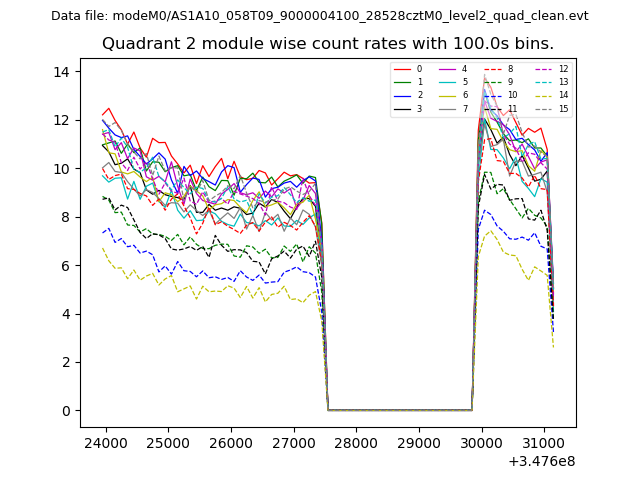
| Module-wise count rates for Quadrant B Data is divided into 100 sec bins |
 |
 |
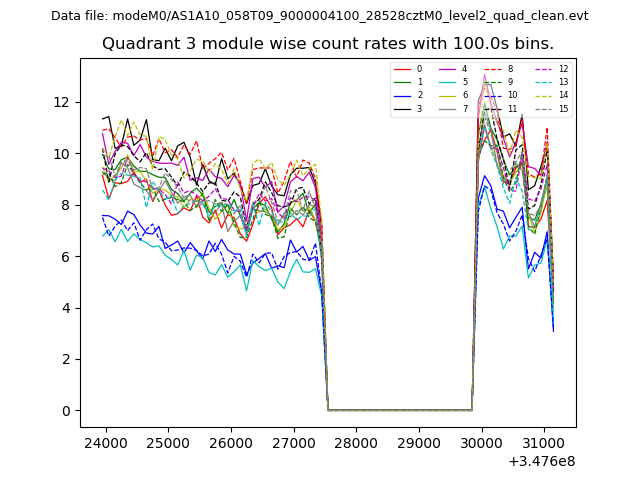
| Module-wise count rates for Quadrant C Data is divided into 100 sec bins |
 |
 |
| Module-wise count rates for Quadrant D Data is divided into 100 sec bins |
 |
 |
| Parameter | Plot |
|---|---|
| CZT HV Monitor | 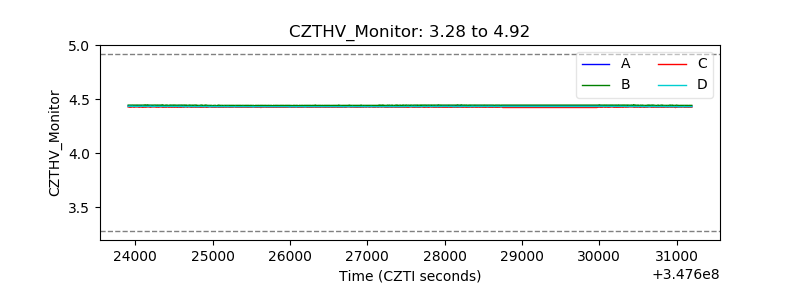 |
| D_VDD | 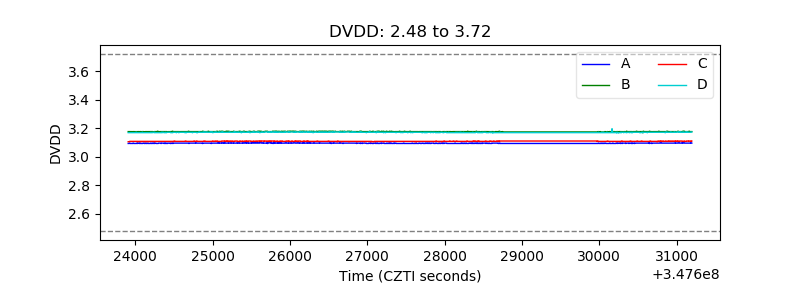 |
| Temperature 1 | 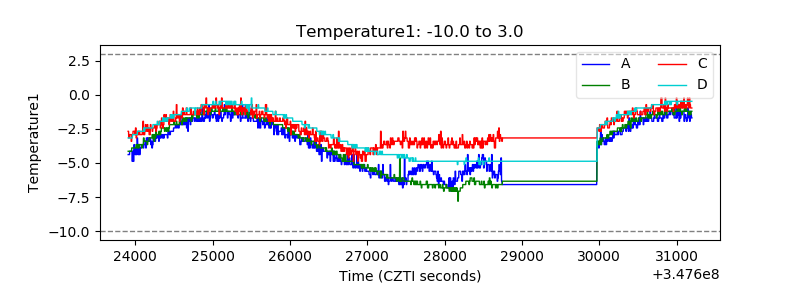 |
| Veto HV Monitor | 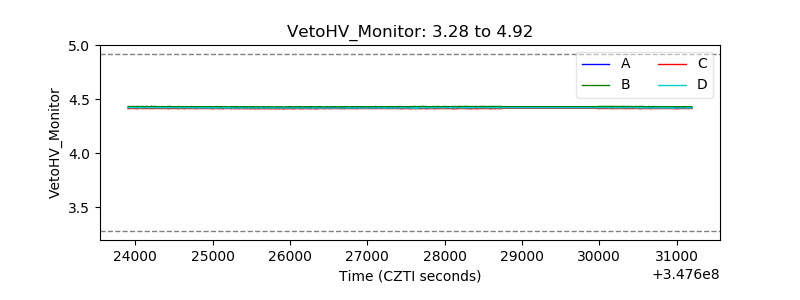 |
| Veto LLD | 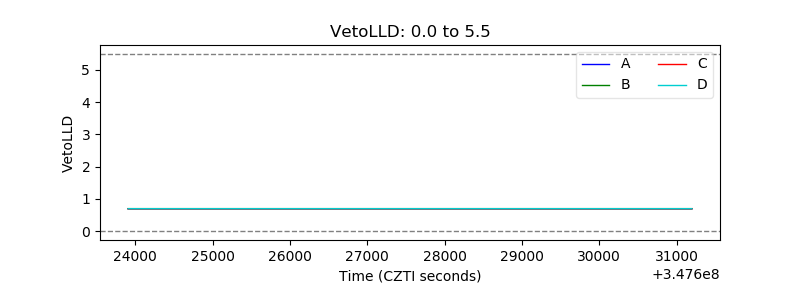 |
| Alpha Counter | 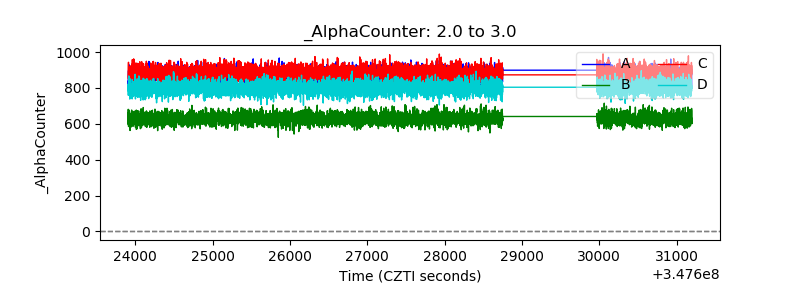 |
| _CPM_Rate | 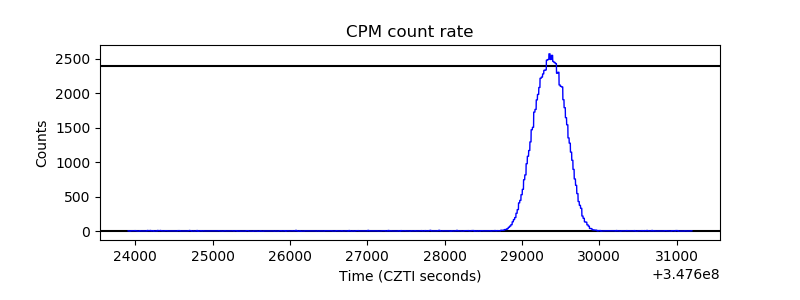 |
| CZT Counter | 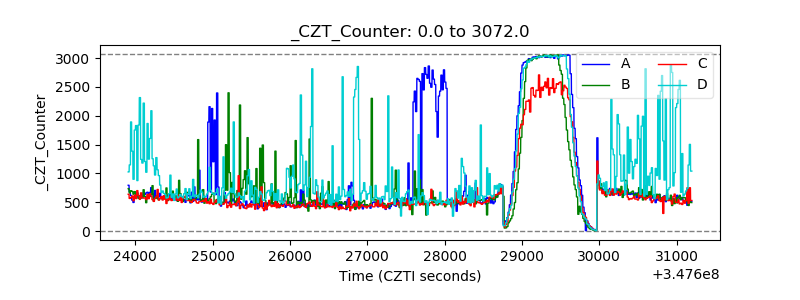 |
| +2.5 Volts monitor |  |
| +5 Volts monitor |  |
| _ROLL_ROT | 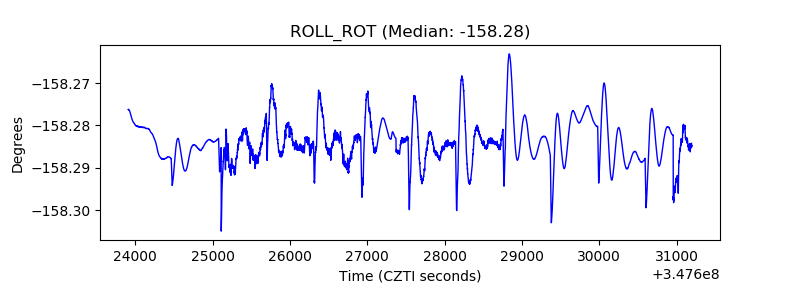 |
| _Roll_DEC | 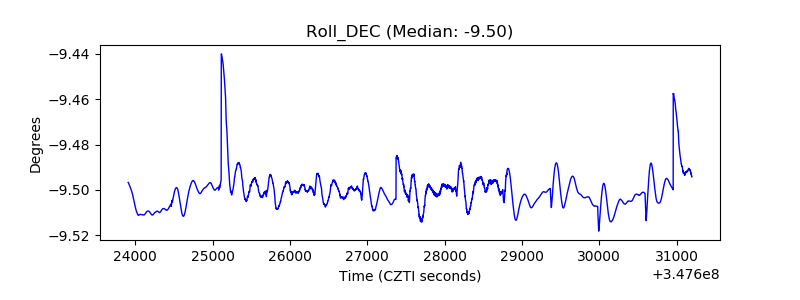 |
| _Roll_RA |  |
| Veto Counter | 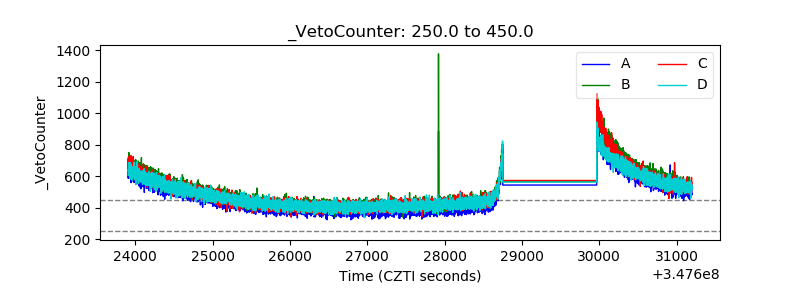 |