| Param | Original file | Final file |
|---|---|---|
| Filename | modeM0/AS1A10_058T09_9000004100_28529cztM0_level2.evt | modeM0/AS1A10_058T09_9000004100_28529cztM0_level2_quad_clean.evt |
| Size (bytes) | 526,219,200 | 106,911,360 |
| Size | 501.8 MB | 102.0 MB |
| Events in quadrant A | 3,291,993 | 732,347 |
| Events in quadrant B | 3,650,445 | 730,463 |
| Events in quadrant C | 3,227,364 | 684,088 |
| Events in quadrant D | 5,345,432 | 657,200 |
| Mode SS | |||
|---|---|---|---|
| Quadrant | BADHDUFLAG | Total packets | Discarded packets |
| A | 0 | 124 | 0 |
| B | 0 | 124 | 0 |
| C | 0 | 124 | 0 |
| D | 0 | 124 | 0 |
| Mode M9 | |||
|---|---|---|---|
| Quadrant | BADHDUFLAG | Total packets | Discarded packets |
| A | 0 | 13 | 0 |
| B | 0 | 13 | 0 |
| C | 0 | 13 | 0 |
| D | 0 | 13 | 0 |
| Mode M0 | |||
|---|---|---|---|
| Quadrant | BADHDUFLAG | Total packets | Discarded packets |
| A | 0 | 13665 | 1 |
| B | 0 | 14673 | 1 |
| C | 0 | 13380 | 1 |
| D | 0 | 20368 | 1 |
| Quadrant | Total seconds | Saturated seconds | Saturation percentage |
|---|---|---|---|
| A | 6223 | 100 | 1.606942% |
| B | 6223 | 198 | 3.181745% |
| C | 6223 | 119 | 1.912261% |
| D | 6224 | 348 | 5.591260% |
Noise dominated data is calculated using 1-second bins in cleaned event files. If a bin has >2000 counts, and if more than 50% of those come from <1% of pixels, then it is considered to be noise-dominated and hence unusable.
| Quadrant | # 1 sec bins | Bins with >0 counts | Bins with >2000 counts | High rate bins dominated by noise | Noise dominated (total time) | Noise dominated (detector-on time) | Marked lightcurve |
|---|---|---|---|---|---|---|---|
| A | 7448 | 6223 | 2 | 2 | 0.03% | 0.03% | 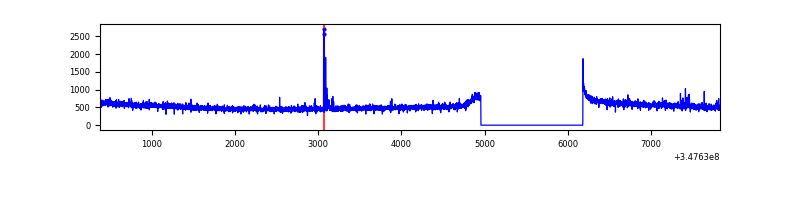 |
| B | 7448 | 6223 | 82 | 82 | 1.10% | 1.32% | 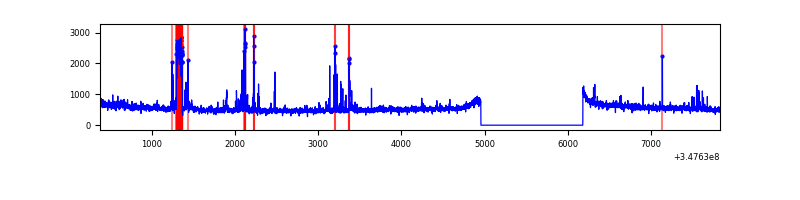 |
| C | 7448 | 6223 | 0 | 0 | 0.00% | 0.00% |  |
| D | 7449 | 6224 | 280 | 280 | 3.76% | 4.50% | 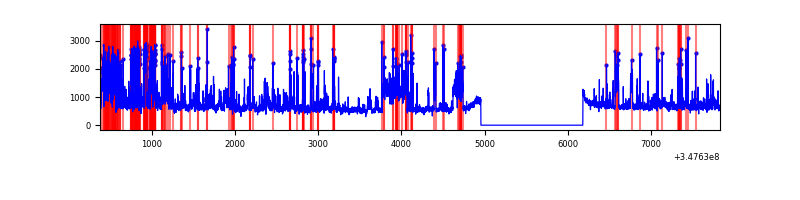 |
Top three noisy pixels from each quadrant. If the there are fewer than three noisy pixels in the level2.evt file, extra rows are filled as -1
| Pixel properties | Quadrant properties | ||||||
|---|---|---|---|---|---|---|---|
| Quadrant | DetID | PixID | Counts | Sigma | Mean | Median | Sigma |
| A | 15 | 174 | 28627 | 167.1 | 844 | 829 | 166.4 |
| A | 13 | 254 | 12154 | 68.08 | 844 | 829 | 166.4 |
| A | 0 | 226 | 7426 | 39.66 | 844 | 829 | 166.4 |
| B | 10 | 245 | 287656 | 1846.43 | 826 | 809 | 155.4 |
| B | 0 | 230 | 33521 | 210.57 | 826 | 809 | 155.4 |
| B | 4 | 171 | 27004 | 168.62 | 826 | 809 | 155.4 |
| C | 14 | 238 | 129609 | 705.3 | 786 | 793 | 182.6 |
| C | 3 | 233 | 20272 | 106.65 | 786 | 793 | 182.6 |
| C | 7 | 247 | 12369 | 63.38 | 786 | 793 | 182.6 |
| D | 1 | 52 | 1161839 | 6195.72 | 792 | 773 | 187.4 |
| D | 8 | 195 | 993394 | 5296.86 | 792 | 773 | 187.4 |
| D | 2 | 250 | 75955 | 401.19 | 792 | 773 | 187.4 |
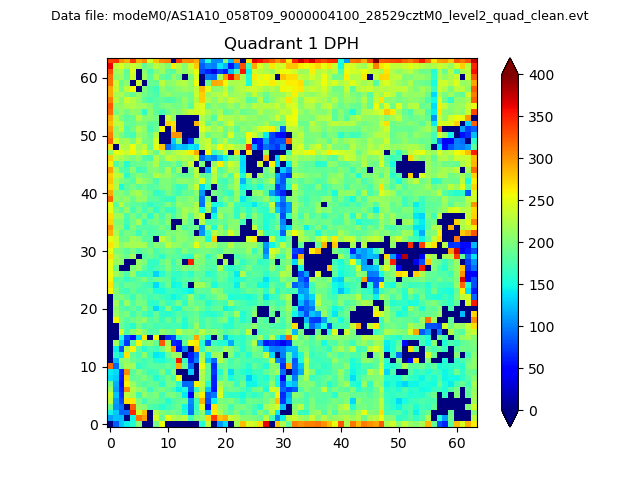
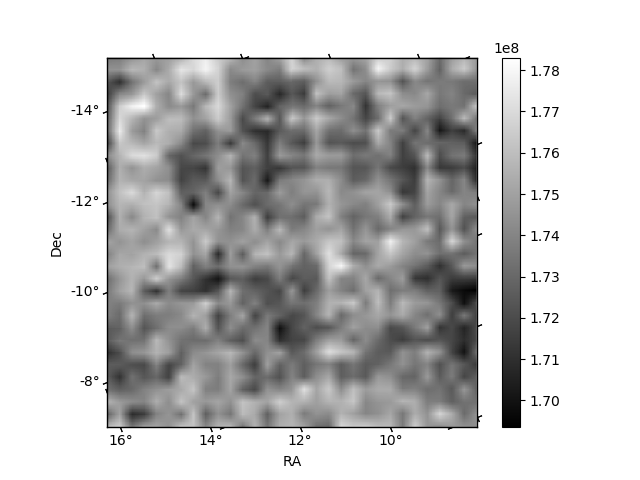
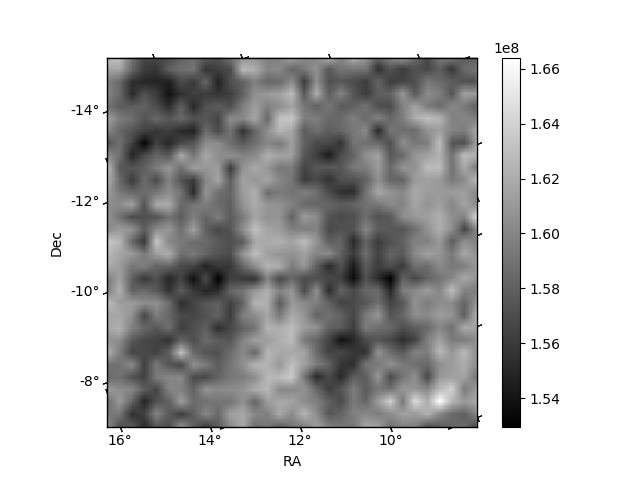
Histogram calculated using DETX and DETY for each event in the final _common_clean file
| Quadrant A |  |
 |
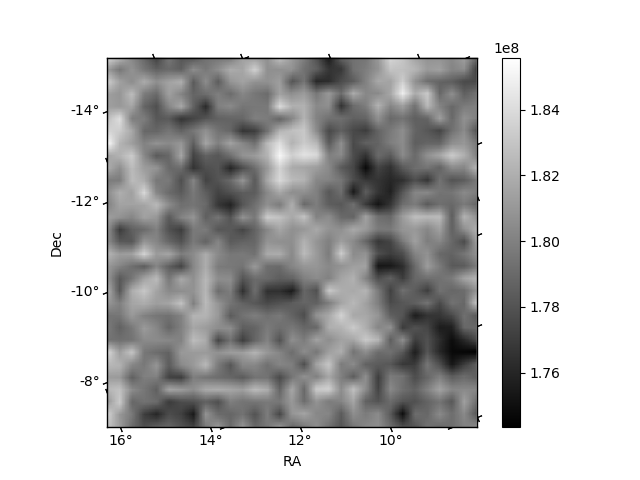
Quadrant B |
|---|---|---|---|
| Quadrant D |  |
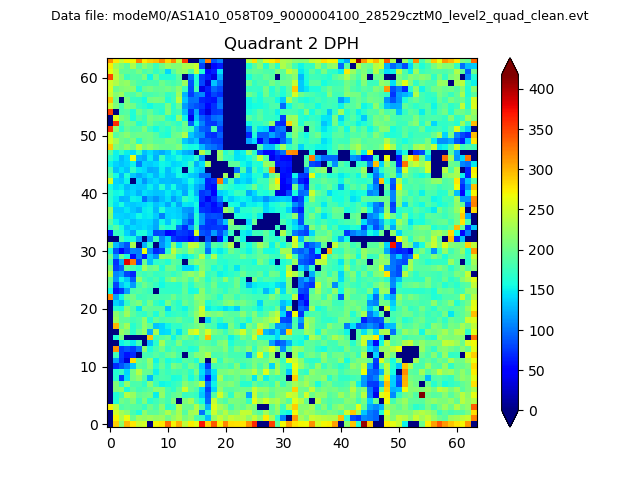 |
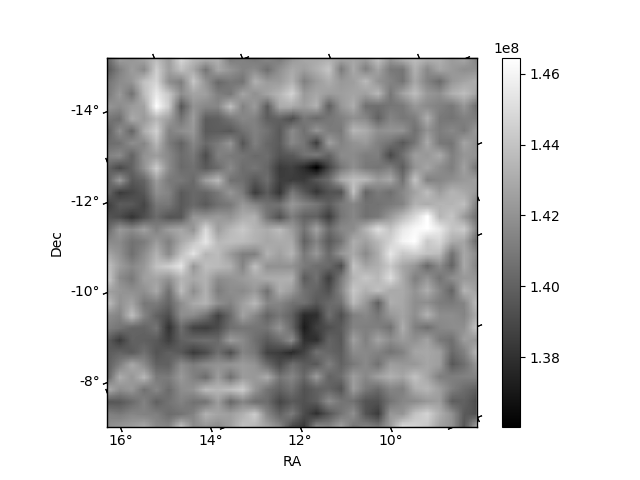
Quadrant C |
| Plot type | Count rate plots | Images |
|---|---|---|
| Comparison with Poisson distribution Blue bars denote a histogram of data divided into 1 sec bins. Red curve is a Poisson curve with rate = median count rate of data. |
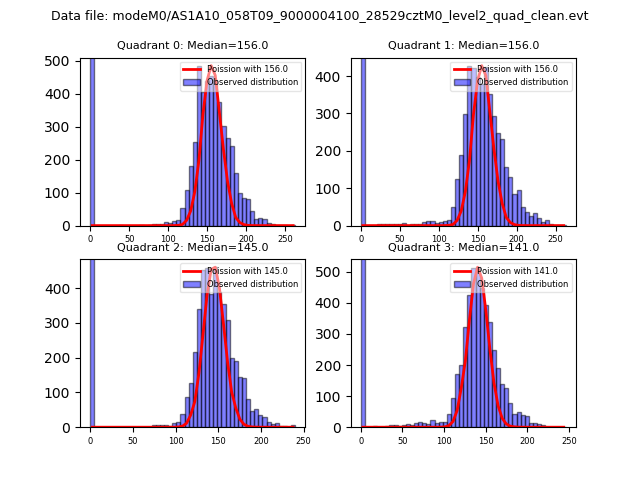 |
 |
| Quadrant-wise count rates Data is divided into 100 sec bins |
 |
|
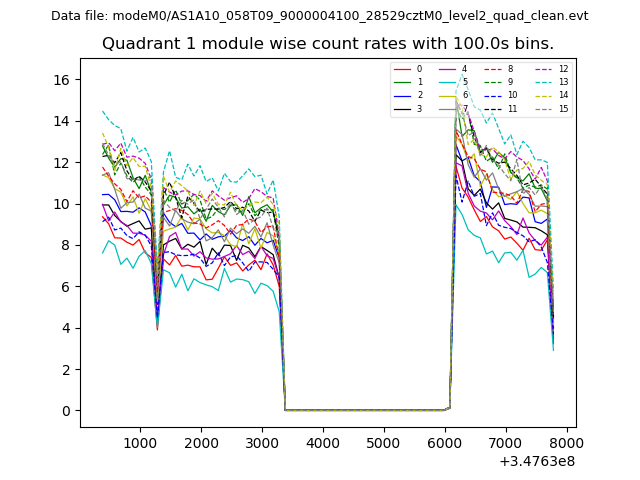
| Module-wise count rates for Quadrant A Data is divided into 100 sec bins |
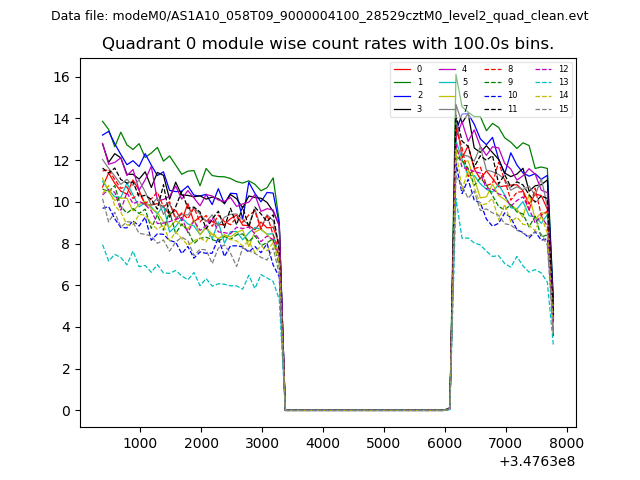 |
 |
| Module-wise count rates for Quadrant B Data is divided into 100 sec bins |
 |
 |
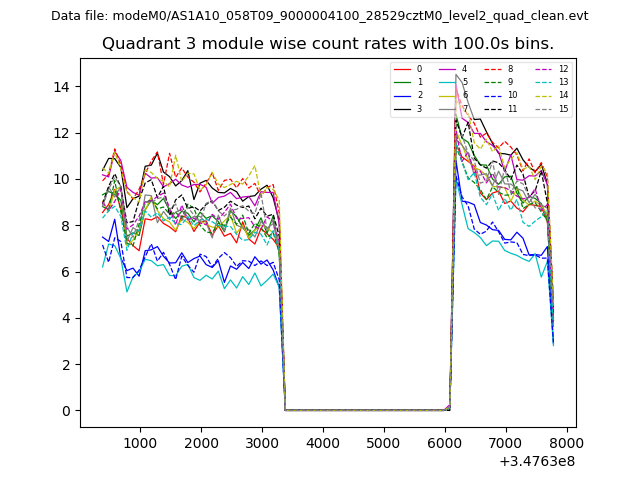
| Module-wise count rates for Quadrant C Data is divided into 100 sec bins |
 |
 |
| Module-wise count rates for Quadrant D Data is divided into 100 sec bins |
 |
 |
| Parameter | Plot |
|---|---|
| CZT HV Monitor |  |
| D_VDD | 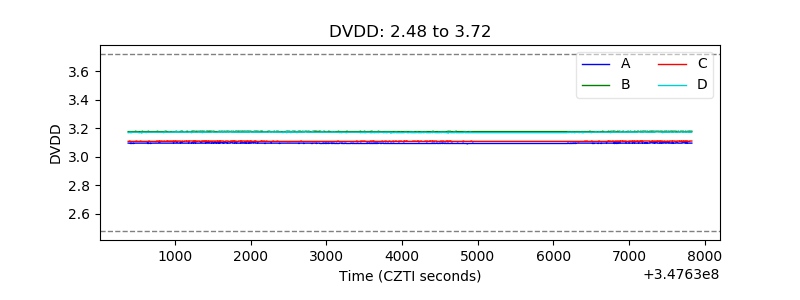 |
| Temperature 1 | 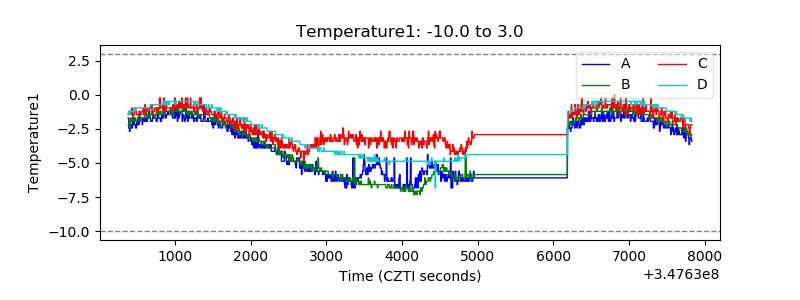 |
| Veto HV Monitor | 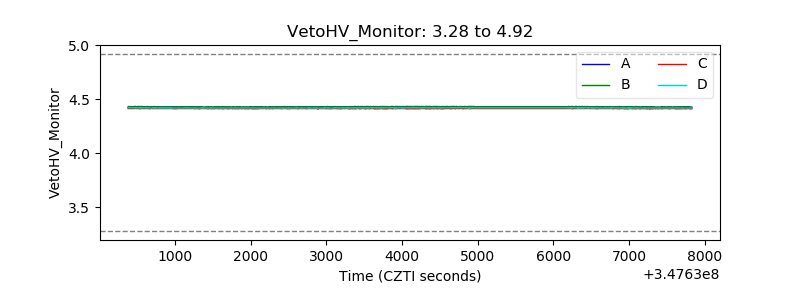 |
| Veto LLD | 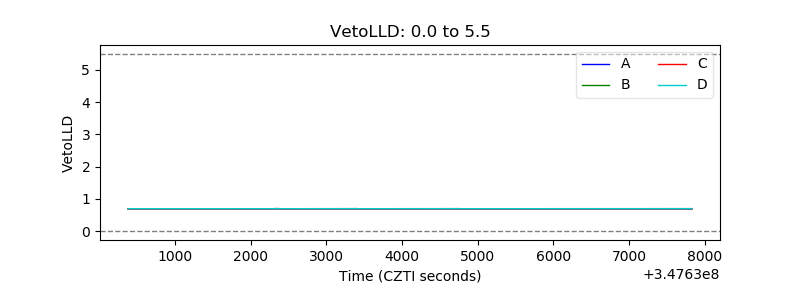 |
| Alpha Counter | 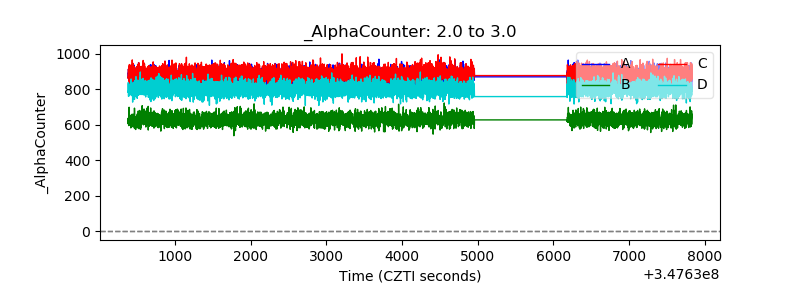 |
| _CPM_Rate | 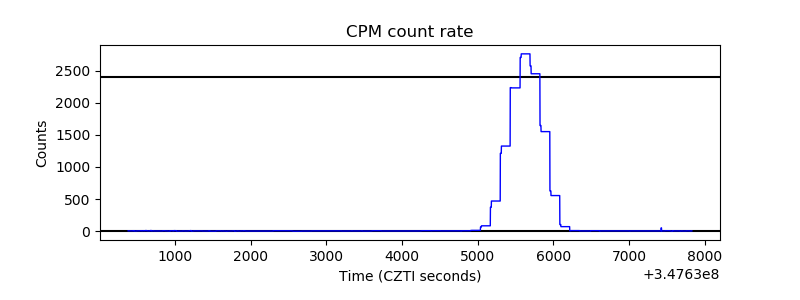 |
| CZT Counter | 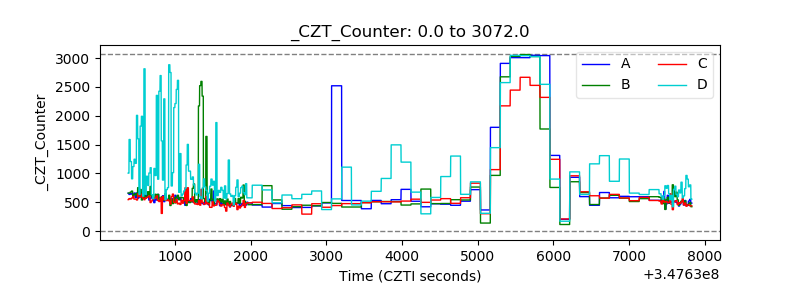 |
| +2.5 Volts monitor |  |
| +5 Volts monitor |  |
| _ROLL_ROT | 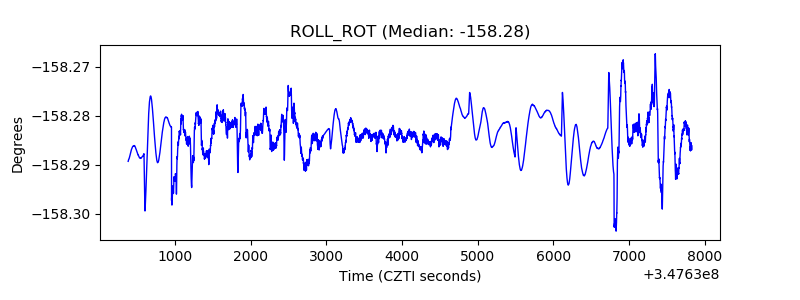 |
| _Roll_DEC | 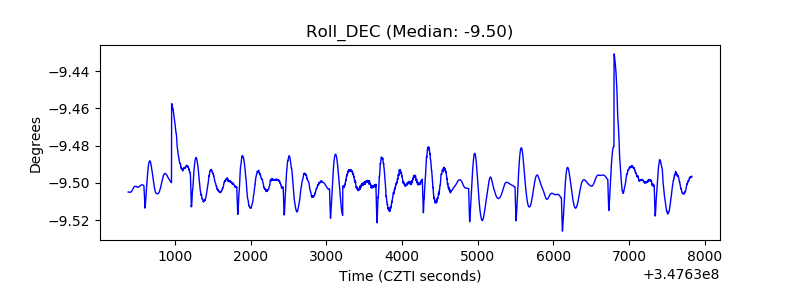 |
| _Roll_RA | 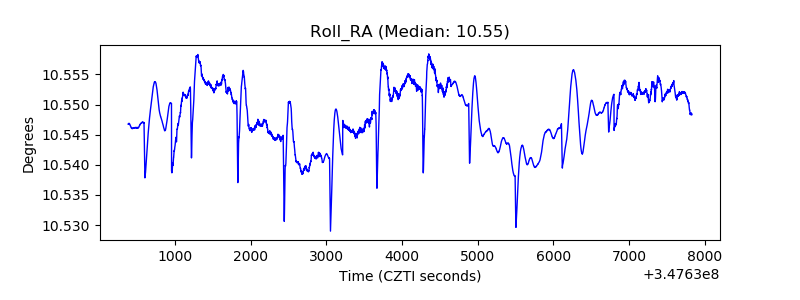 |
| Veto Counter | 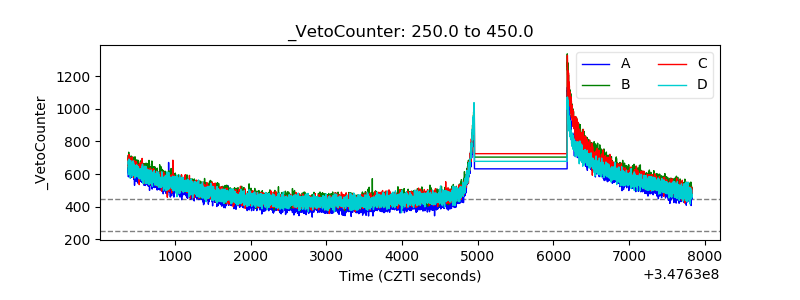 |