| Param | Original file | Final file |
|---|---|---|
| Filename | modeM0/AS1A10_058T09_9000004100_28531cztM0_level2.evt | modeM0/AS1A10_058T09_9000004100_28531cztM0_level2_quad_clean.evt |
| Size (bytes) | 637,689,600 | 93,041,280 |
| Size | 608.1 MB | 88.7 MB |
| Events in quadrant A | 3,558,511 | 629,324 |
| Events in quadrant B | 4,317,963 | 613,540 |
| Events in quadrant C | 3,365,133 | 599,382 |
| Events in quadrant D | 7,638,000 | 528,274 |
| Mode SS | |||
|---|---|---|---|
| Quadrant | BADHDUFLAG | Total packets | Discarded packets |
| A | 0 | 130 | 0 |
| B | 0 | 130 | 0 |
| C | 0 | 130 | 0 |
| D | 0 | 130 | 0 |
| Mode M9 | |||
|---|---|---|---|
| Quadrant | BADHDUFLAG | Total packets | Discarded packets |
| A | 0 | 14 | 0 |
| B | 0 | 15 | 0 |
| C | 0 | 15 | 0 |
| D | 0 | 15 | 0 |
| Mode M0 | |||
|---|---|---|---|
| Quadrant | BADHDUFLAG | Total packets | Discarded packets |
| A | 0 | 14588 | 2 |
| B | 0 | 16904 | 2 |
| C | 0 | 13924 | 2 |
| D | 0 | 27285 | 2 |
| Quadrant | Total seconds | Saturated seconds | Saturation percentage |
|---|---|---|---|
| A | 6402 | 107 | 1.671353% |
| B | 6402 | 405 | 6.326148% |
| C | 6402 | 97 | 1.515152% |
| D | 6402 | 1029 | 16.073102% |
Noise dominated data is calculated using 1-second bins in cleaned event files. If a bin has >2000 counts, and if more than 50% of those come from <1% of pixels, then it is considered to be noise-dominated and hence unusable.
| Quadrant | # 1 sec bins | Bins with >0 counts | Bins with >2000 counts | High rate bins dominated by noise | Noise dominated (total time) | Noise dominated (detector-on time) | Marked lightcurve |
|---|---|---|---|---|---|---|---|
| A | 7678 | 6403 | 30 | 30 | 0.39% | 0.47% | 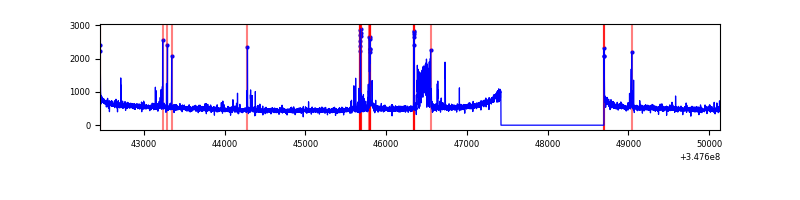 |
| B | 7678 | 6402 | 305 | 305 | 3.97% | 4.76% | 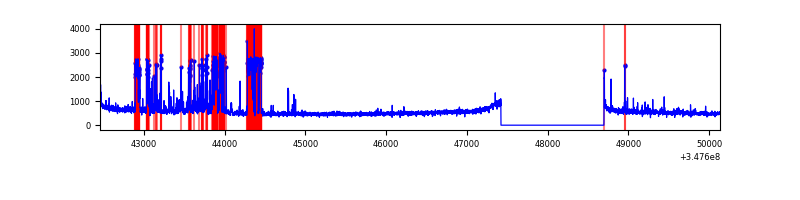 |
| C | 7678 | 6403 | 0 | 0 | 0.00% | 0.00% | 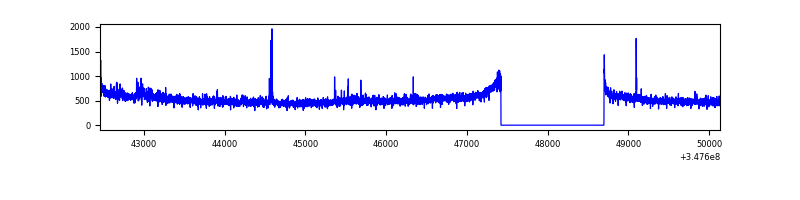 |
| D | 7678 | 6403 | 1099 | 1099 | 14.31% | 17.16% | 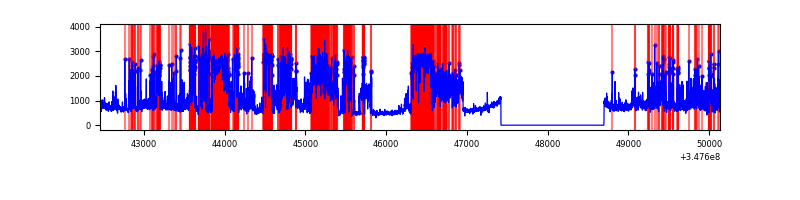 |
Top three noisy pixels from each quadrant. If the there are fewer than three noisy pixels in the level2.evt file, extra rows are filled as -1
| Pixel properties | Quadrant properties | ||||||
|---|---|---|---|---|---|---|---|
| Quadrant | DetID | PixID | Counts | Sigma | Mean | Median | Sigma |
| A | 15 | 174 | 292792 | 1746.7 | 842 | 828 | 167.2 |
| A | 8 | 192 | 14287 | 80.52 | 842 | 828 | 167.2 |
| A | 13 | 254 | 13260 | 74.38 | 842 | 828 | 167.2 |
| B | 10 | 245 | 970106 | 6218.88 | 824 | 807 | 155.9 |
| B | 0 | 230 | 48659 | 307.01 | 824 | 807 | 155.9 |
| B | 5 | 255 | 34799 | 218.09 | 824 | 807 | 155.9 |
| C | 14 | 238 | 132000 | 707.57 | 797 | 804 | 185.4 |
| C | 3 | 233 | 86737 | 463.45 | 797 | 804 | 185.4 |
| C | 7 | 247 | 33661 | 177.2 | 797 | 804 | 185.4 |
| D | 1 | 52 | 2927206 | 16507.94 | 745 | 727 | 177.3 |
| D | 8 | 195 | 1545200 | 8712.2 | 745 | 727 | 177.3 |
| D | 6 | 112 | 101868 | 570.53 | 745 | 727 | 177.3 |
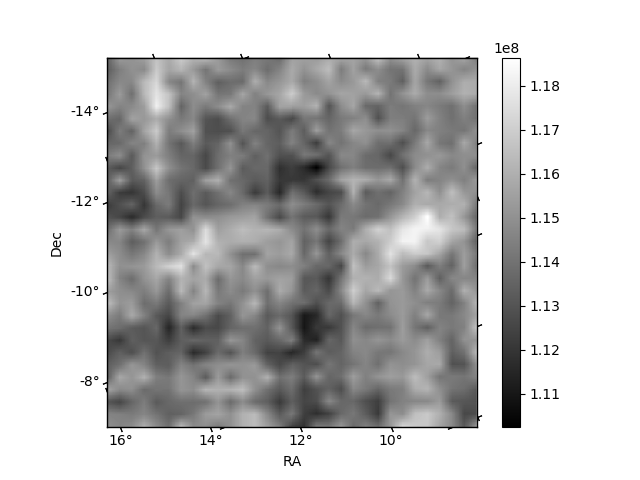
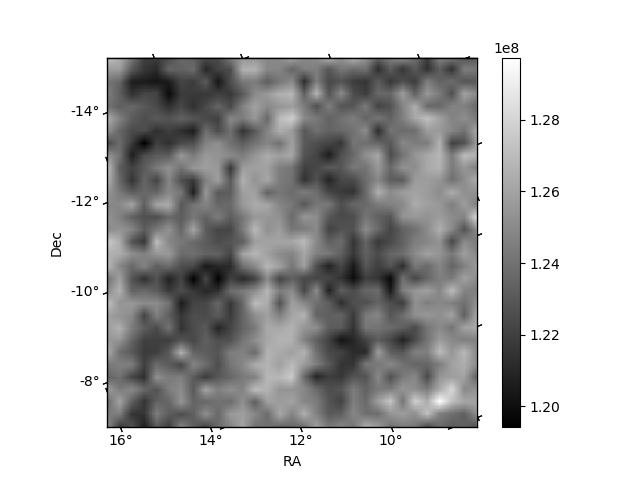
Histogram calculated using DETX and DETY for each event in the final _common_clean file
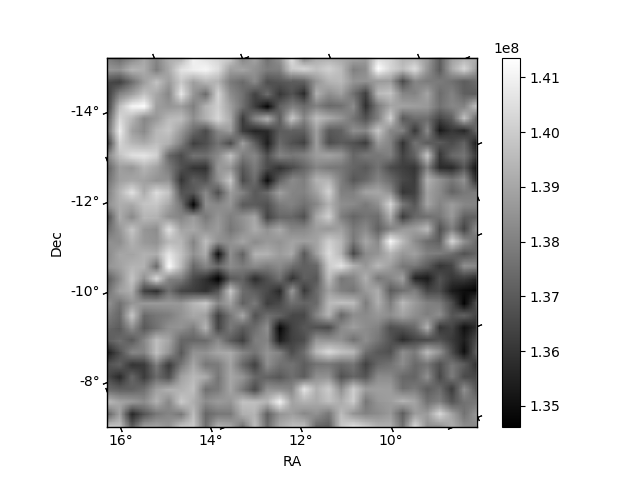
| Quadrant A | 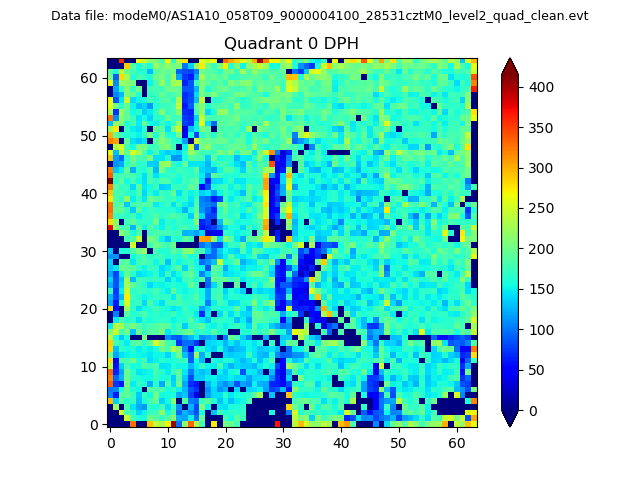 |
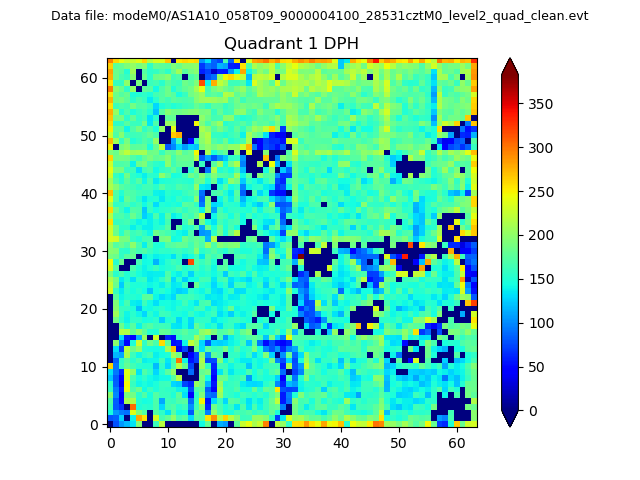 |
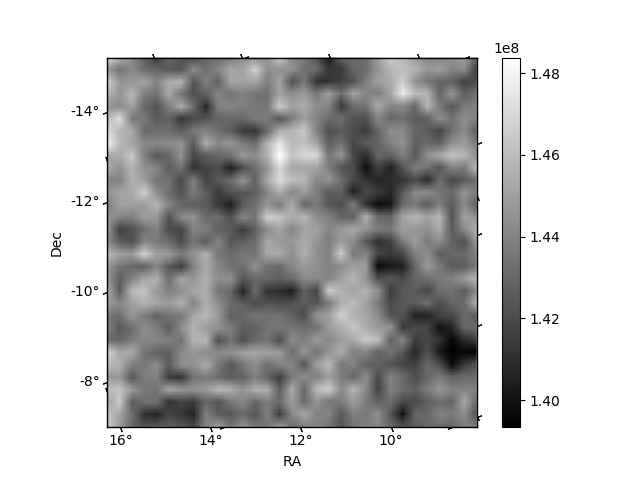
Quadrant B |
|---|---|---|---|
| Quadrant D | 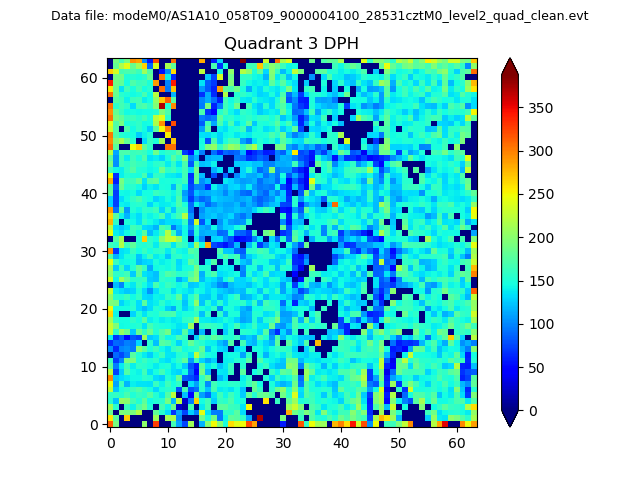 |
 |
Quadrant C |
| Plot type | Count rate plots | Images |
|---|---|---|
| Comparison with Poisson distribution Blue bars denote a histogram of data divided into 1 sec bins. Red curve is a Poisson curve with rate = median count rate of data. |
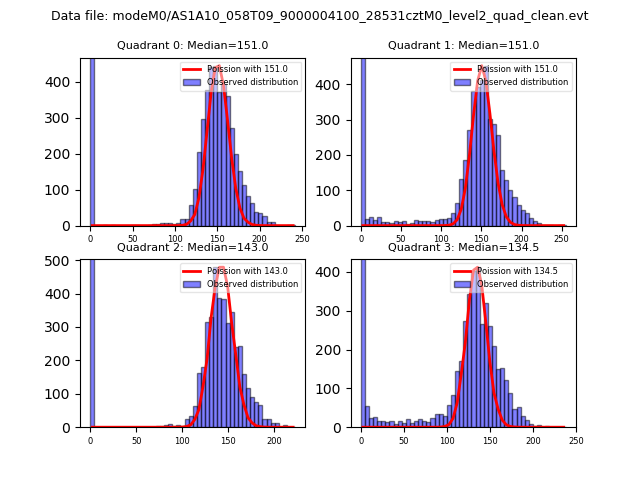 |
 |
| Quadrant-wise count rates Data is divided into 100 sec bins |
 |
|
| Module-wise count rates for Quadrant A Data is divided into 100 sec bins |
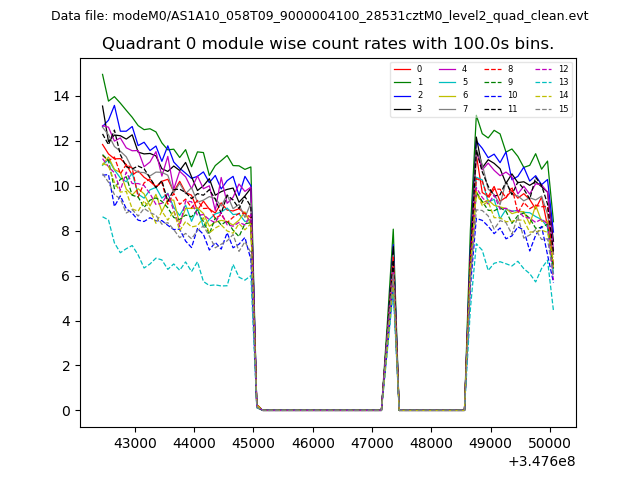 |
 |
| Module-wise count rates for Quadrant B Data is divided into 100 sec bins |
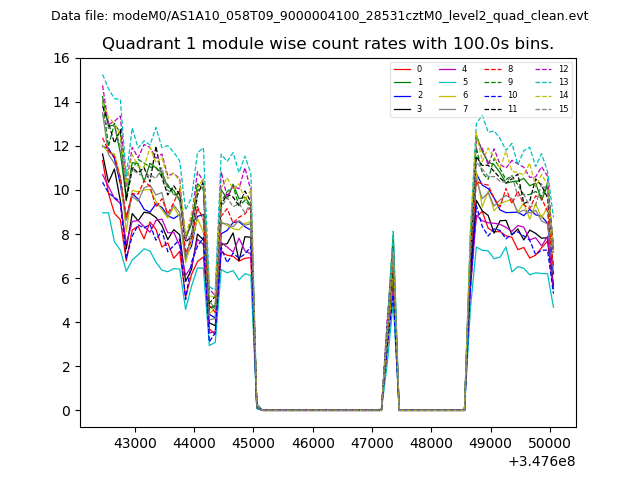 |
 |
| Module-wise count rates for Quadrant C Data is divided into 100 sec bins |
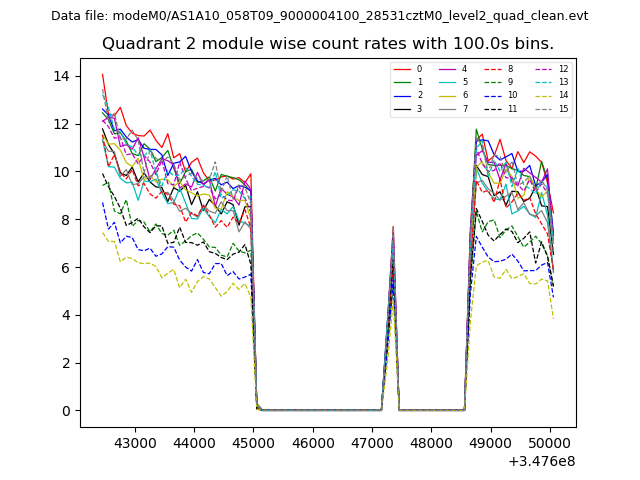 |
 |
| Module-wise count rates for Quadrant D Data is divided into 100 sec bins |
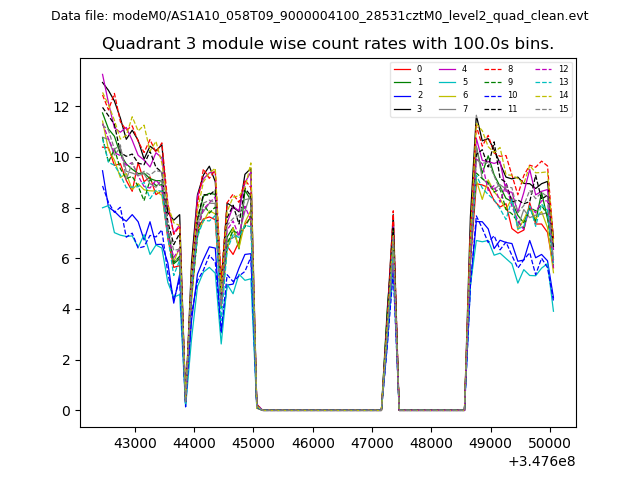 |
 |
| Parameter | Plot |
|---|---|
| CZT HV Monitor |  |
| D_VDD | 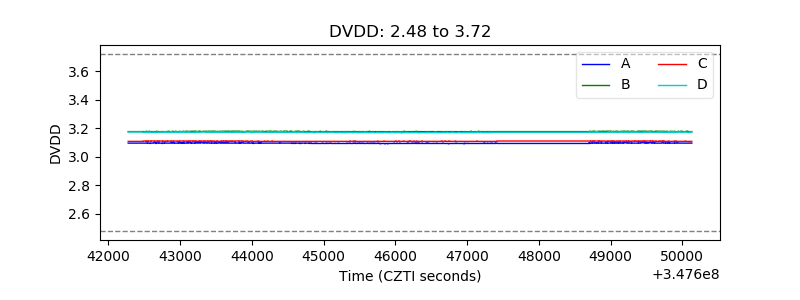 |
| Temperature 1 | 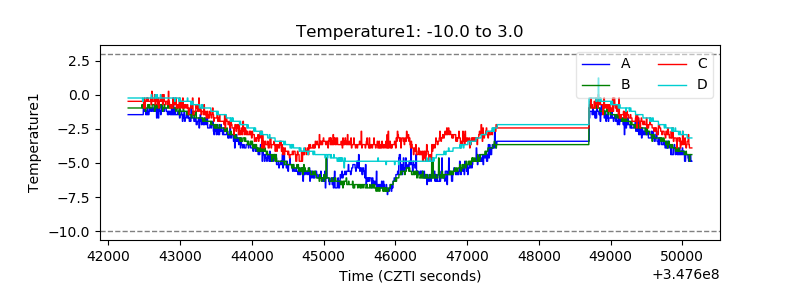 |
| Veto HV Monitor | 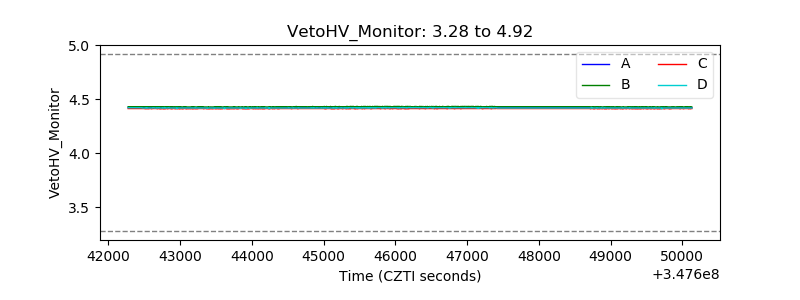 |
| Veto LLD | 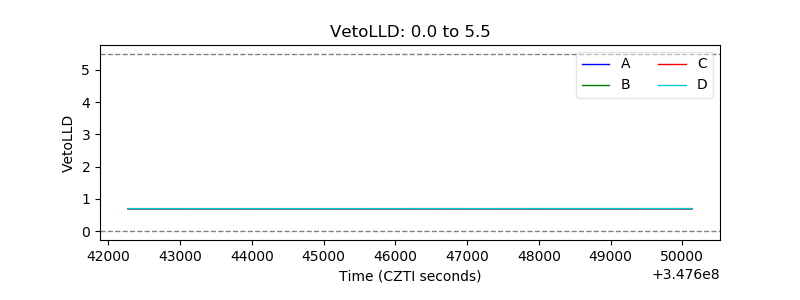 |
| Alpha Counter | 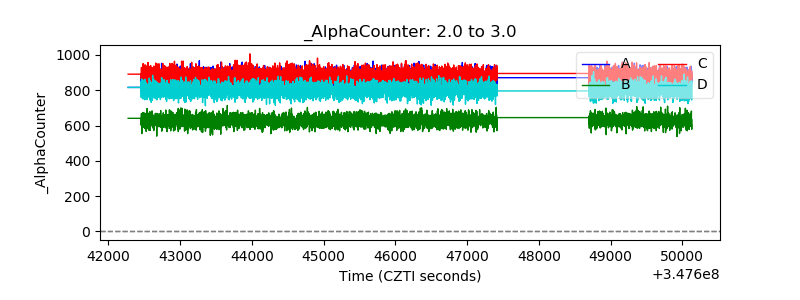 |
| _CPM_Rate | 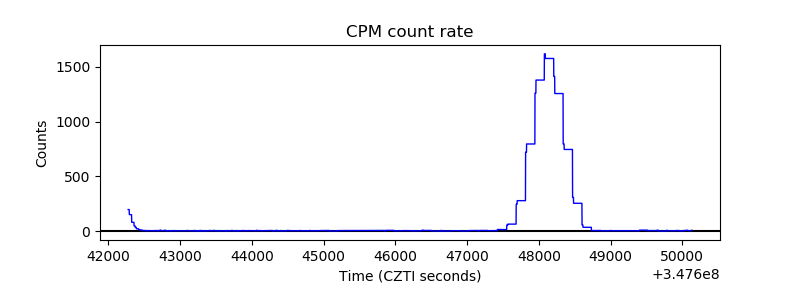 |
| CZT Counter | 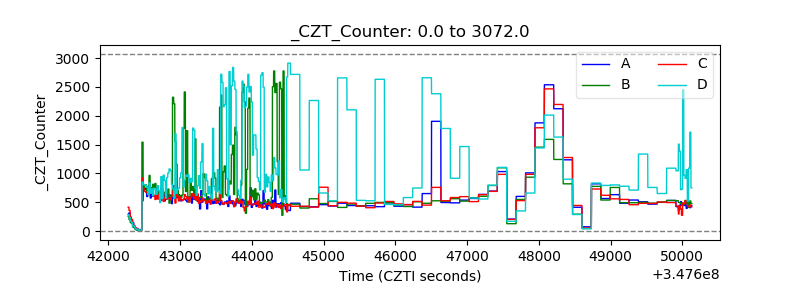 |
| +2.5 Volts monitor |  |
| +5 Volts monitor | 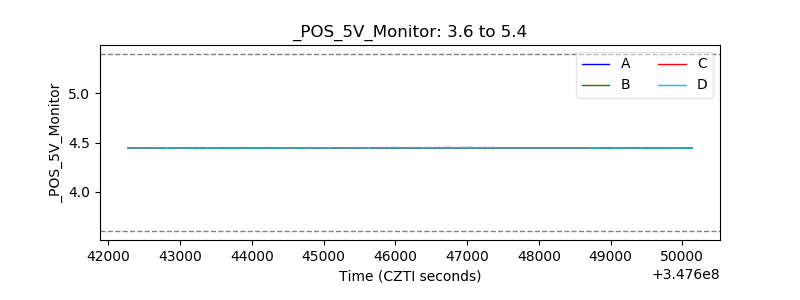 |
| _ROLL_ROT | 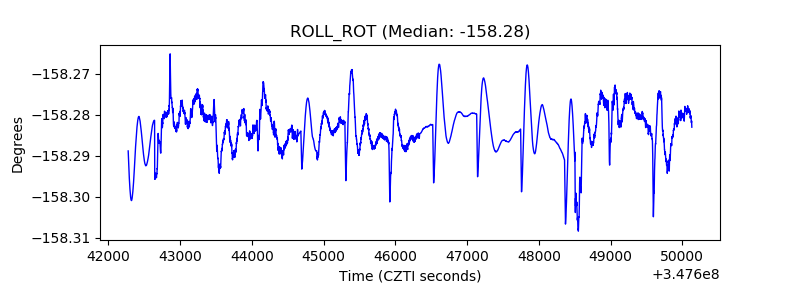 |
| _Roll_DEC | 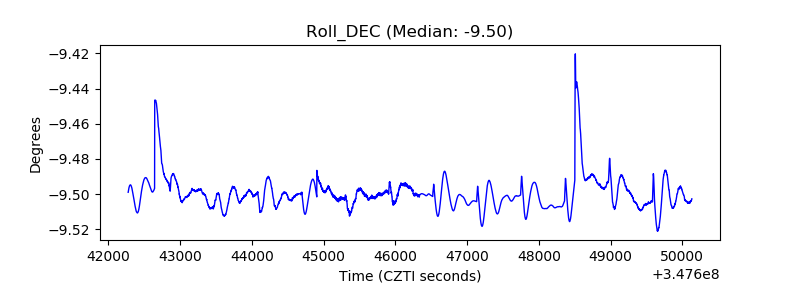 |
| _Roll_RA |  |
| Veto Counter | 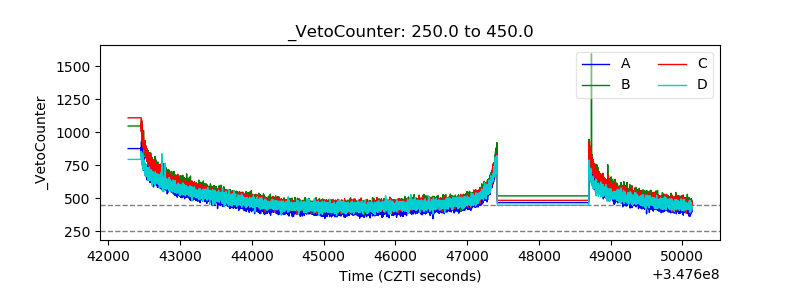 |