| Param | Original file | Final file |
|---|---|---|
| Filename | modeM0/AS1A10_058T09_9000004100_28533cztM0_level2.evt | modeM0/AS1A10_058T09_9000004100_28533cztM0_level2_quad_clean.evt |
| Size (bytes) | 617,376,960 | 92,246,400 |
| Size | 588.8 MB | 88.0 MB |
| Events in quadrant A | 3,518,252 | 612,531 |
| Events in quadrant B | 5,308,498 | 569,732 |
| Events in quadrant C | 3,395,777 | 587,244 |
| Events in quadrant D | 6,012,004 | 547,248 |
| Mode SS | |||
|---|---|---|---|
| Quadrant | BADHDUFLAG | Total packets | Discarded packets |
| A | 0 | 140 | 0 |
| B | 0 | 140 | 0 |
| C | 0 | 140 | 0 |
| D | 0 | 140 | 0 |
| Mode M9 | |||
|---|---|---|---|
| Quadrant | BADHDUFLAG | Total packets | Discarded packets |
| A | 0 | 10 | 0 |
| B | 0 | 11 | 0 |
| C | 0 | 11 | 0 |
| D | 0 | 11 | 0 |
| Mode M0 | |||
|---|---|---|---|
| Quadrant | BADHDUFLAG | Total packets | Discarded packets |
| A | 0 | 14797 | 3 |
| B | 0 | 20148 | 2 |
| C | 0 | 14359 | 2 |
| D | 0 | 22523 | 2 |
| Quadrant | Total seconds | Saturated seconds | Saturation percentage |
|---|---|---|---|
| A | 6828 | 69 | 1.010545% |
| B | 6828 | 870 | 12.741652% |
| C | 6828 | 145 | 2.123609% |
| D | 6828 | 519 | 7.601054% |
Noise dominated data is calculated using 1-second bins in cleaned event files. If a bin has >2000 counts, and if more than 50% of those come from <1% of pixels, then it is considered to be noise-dominated and hence unusable.
| Quadrant | # 1 sec bins | Bins with >0 counts | Bins with >2000 counts | High rate bins dominated by noise | Noise dominated (total time) | Noise dominated (detector-on time) | Marked lightcurve |
|---|---|---|---|---|---|---|---|
| A | 7563 | 6829 | 46 | 46 | 0.61% | 0.67% | 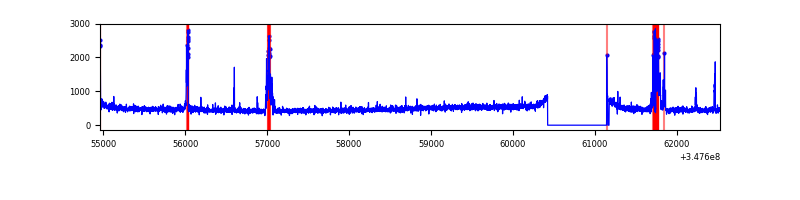 |
| B | 7563 | 6828 | 603 | 603 | 7.97% | 8.83% | 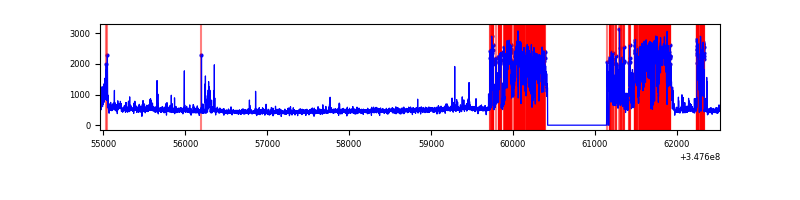 |
| C | 7563 | 6829 | 5 | 5 | 0.07% | 0.07% | 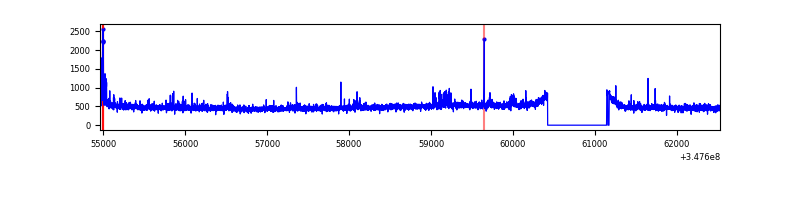 |
| D | 7562 | 6828 | 548 | 548 | 7.25% | 8.03% | 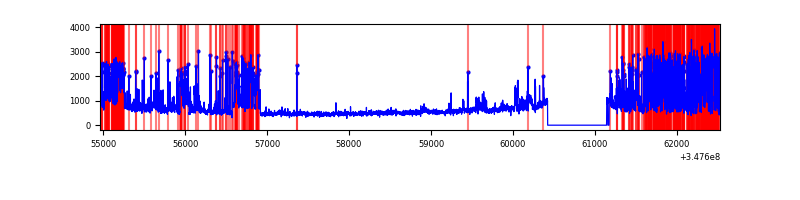 |
Top three noisy pixels from each quadrant. If the there are fewer than three noisy pixels in the level2.evt file, extra rows are filled as -1
| Pixel properties | Quadrant properties | ||||||
|---|---|---|---|---|---|---|---|
| Quadrant | DetID | PixID | Counts | Sigma | Mean | Median | Sigma |
| A | 15 | 174 | 271254 | 1605.8 | 836 | 820 | 168.4 |
| A | 8 | 192 | 14308 | 80.09 | 836 | 820 | 168.4 |
| A | 13 | 254 | 13969 | 78.08 | 836 | 820 | 168.4 |
| B | 10 | 245 | 1968585 | 13053.19 | 793 | 773 | 150.8 |
| B | 5 | 172 | 46996 | 306.61 | 793 | 773 | 150.8 |
| B | 5 | 255 | 46748 | 304.97 | 793 | 773 | 150.8 |
| C | 14 | 238 | 158057 | 835.92 | 796 | 801 | 188.1 |
| C | 3 | 233 | 48689 | 254.56 | 796 | 801 | 188.1 |
| C | 14 | 254 | 44444 | 231.99 | 796 | 801 | 188.1 |
| D | 1 | 52 | 1649981 | 8767.98 | 785 | 764 | 188.1 |
| D | 8 | 195 | 1184626 | 6293.95 | 785 | 764 | 188.1 |
| D | 2 | 250 | 54434 | 285.33 | 785 | 764 | 188.1 |
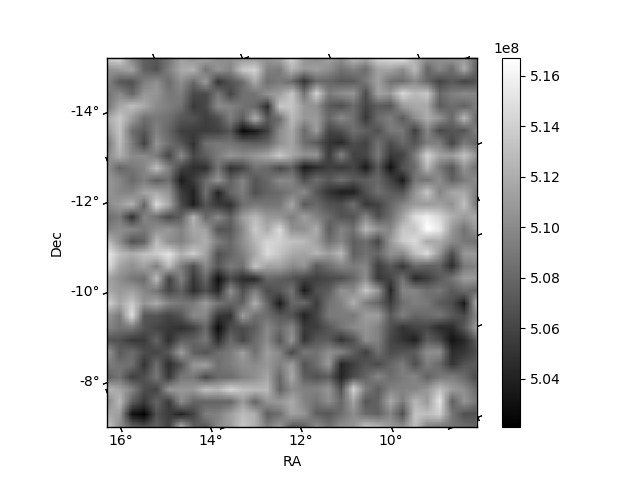
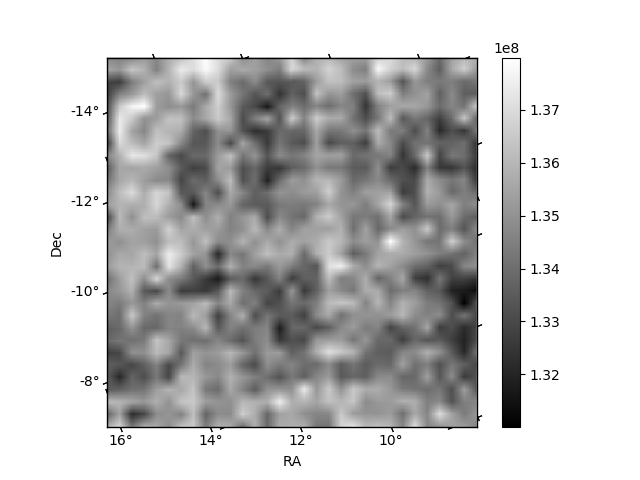
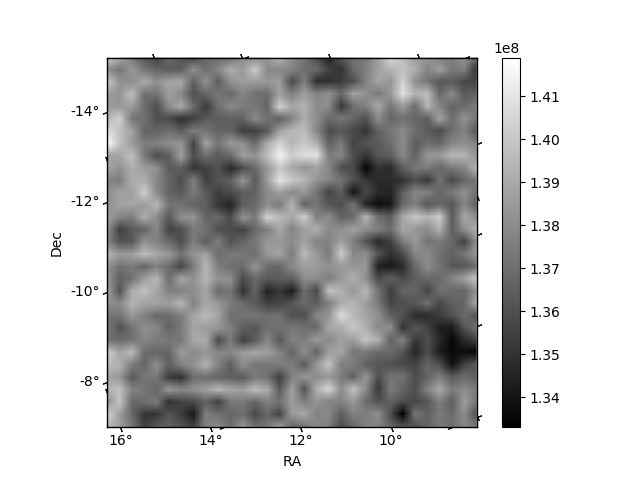
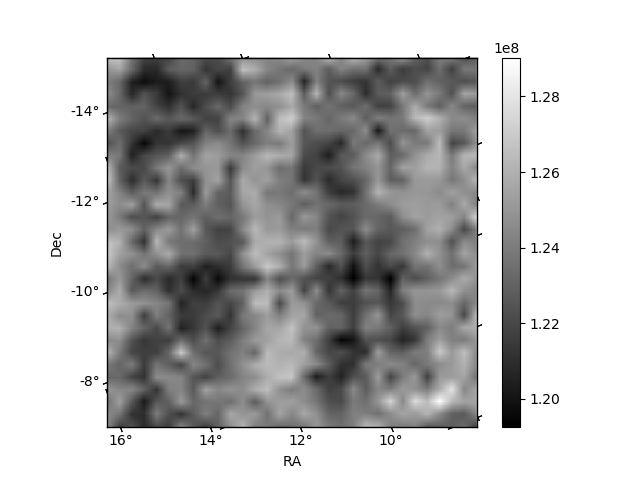
Histogram calculated using DETX and DETY for each event in the final _common_clean file
| Quadrant A | 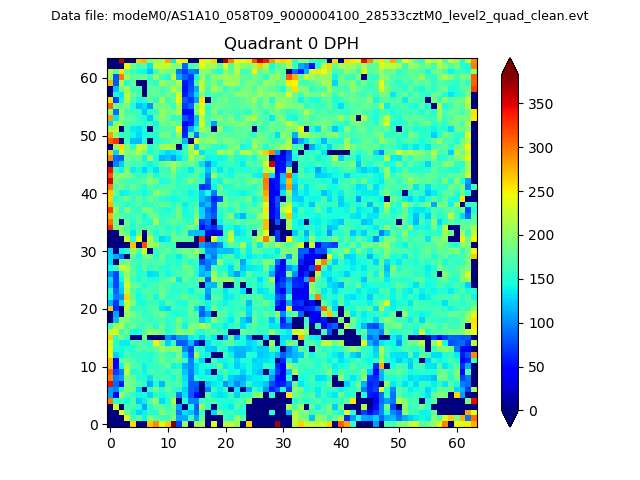 |
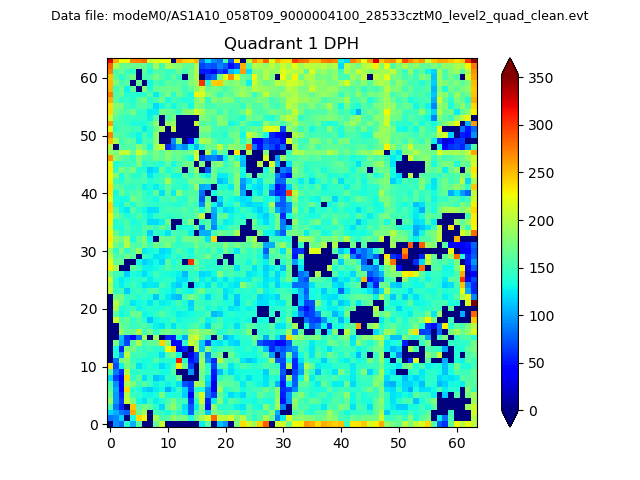 |
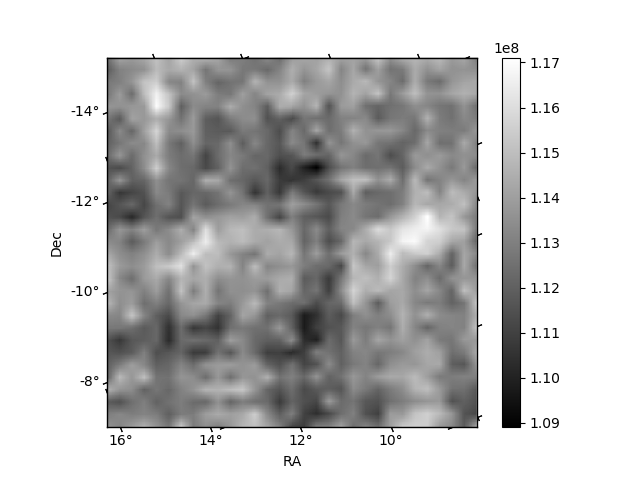
Quadrant B |
|---|---|---|---|
| Quadrant D | 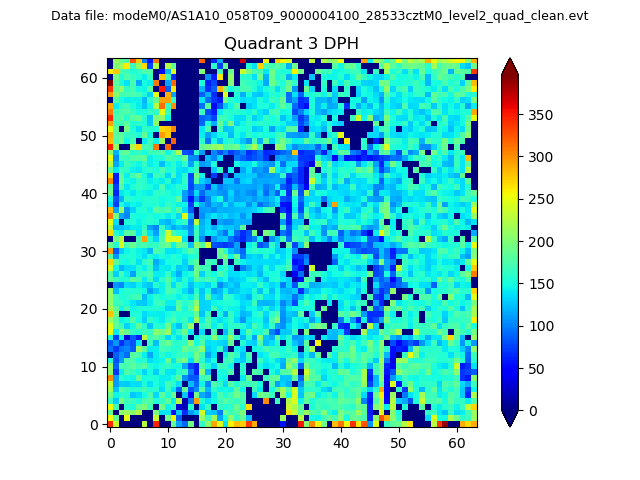 |
 |
Quadrant C |
| Plot type | Count rate plots | Images |
|---|---|---|
| Comparison with Poisson distribution Blue bars denote a histogram of data divided into 1 sec bins. Red curve is a Poisson curve with rate = median count rate of data. |
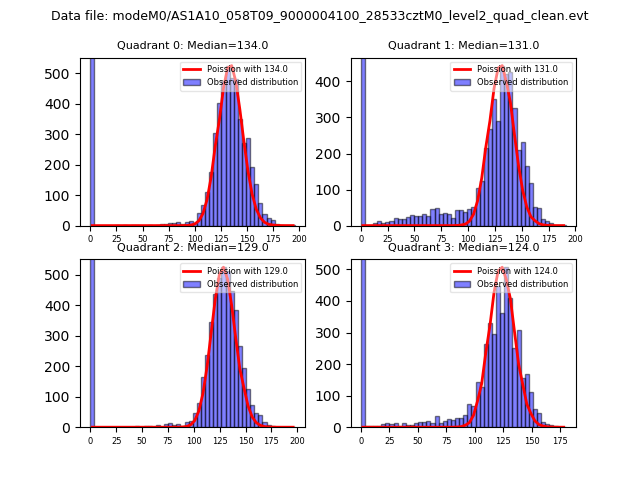 |
 |
| Quadrant-wise count rates Data is divided into 100 sec bins |
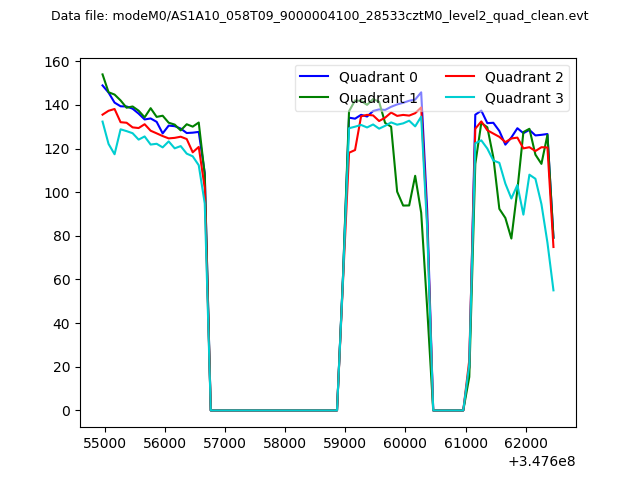 |
|
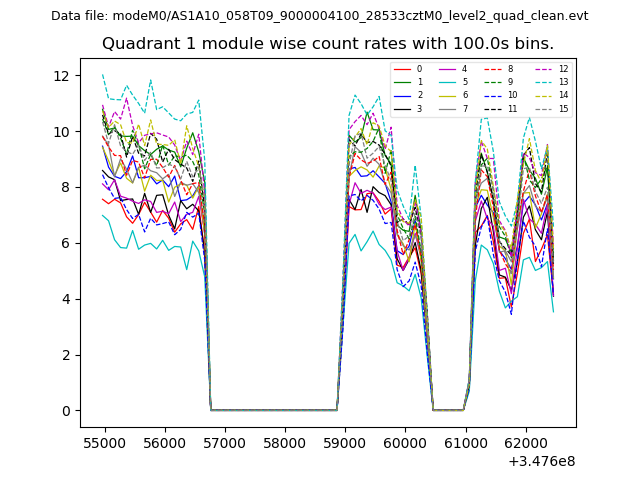
| Module-wise count rates for Quadrant A Data is divided into 100 sec bins |
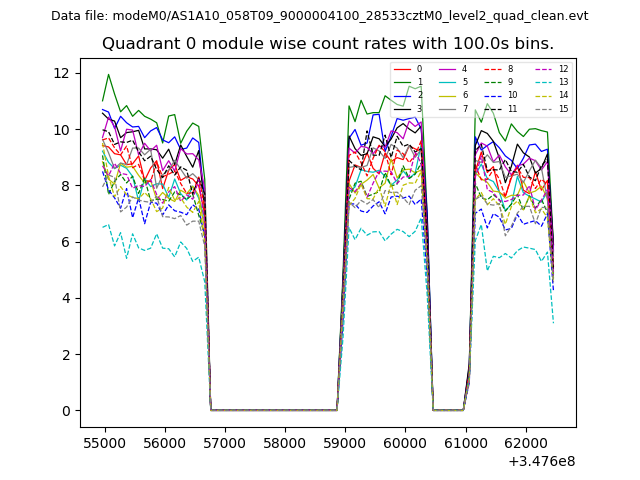 |
 |
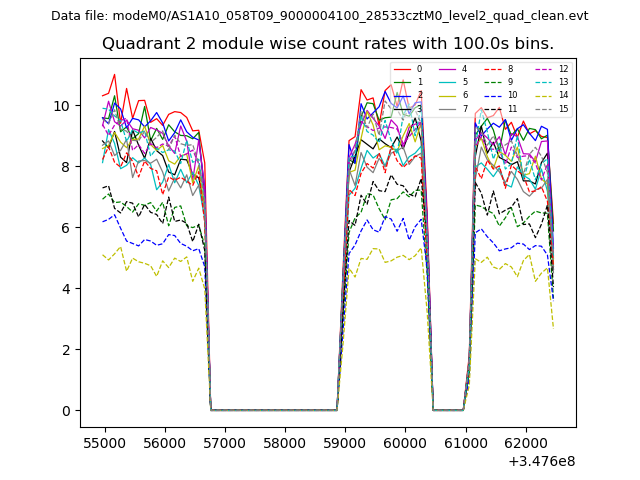
| Module-wise count rates for Quadrant B Data is divided into 100 sec bins |
 |
 |
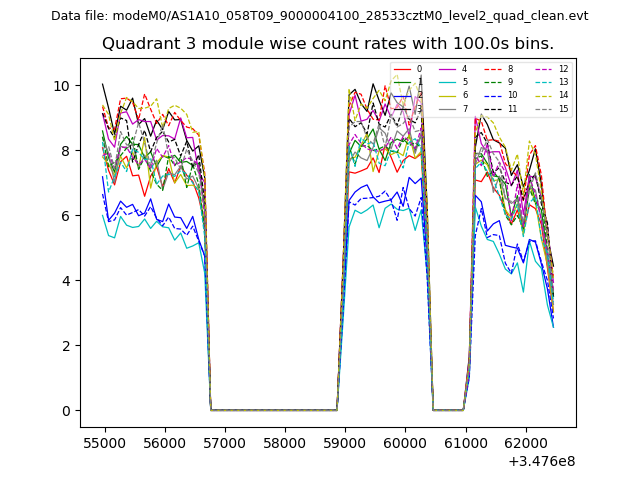
| Module-wise count rates for Quadrant C Data is divided into 100 sec bins |
 |
 |
| Module-wise count rates for Quadrant D Data is divided into 100 sec bins |
 |
 |
| Parameter | Plot |
|---|---|
| CZT HV Monitor | 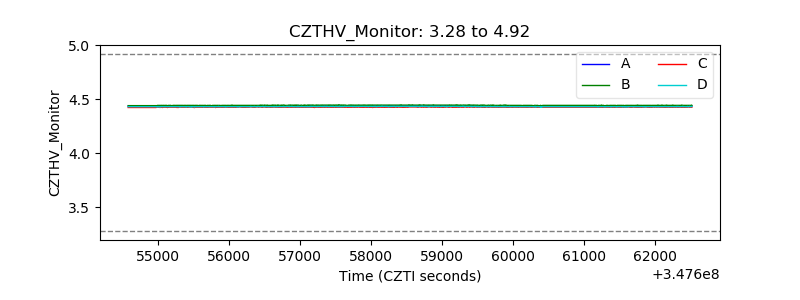 |
| D_VDD | 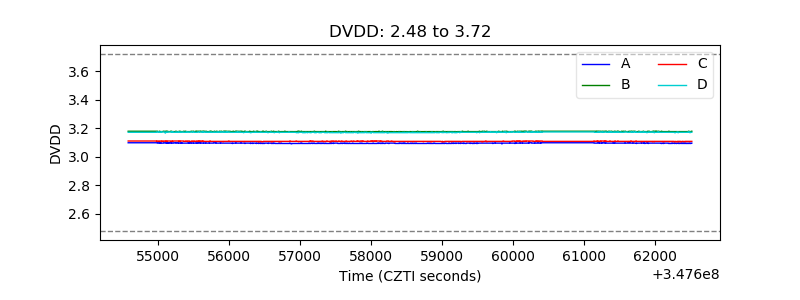 |
| Temperature 1 |  |
| Veto HV Monitor |  |
| Veto LLD |  |
| Alpha Counter | 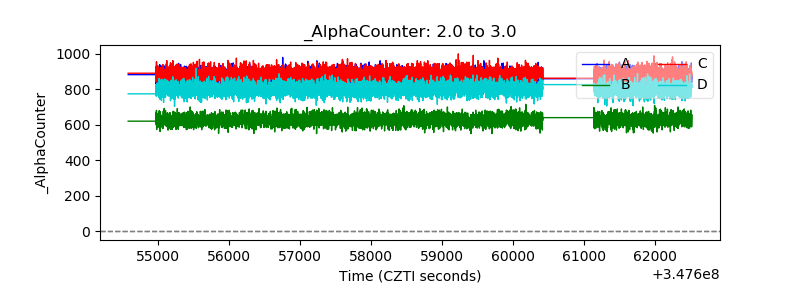 |
| _CPM_Rate | 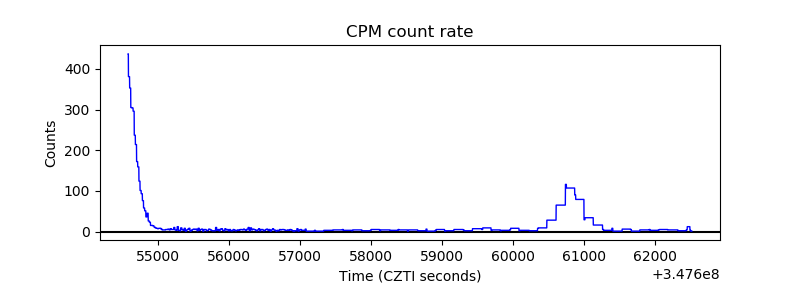 |
| CZT Counter |  |
| +2.5 Volts monitor |  |
| +5 Volts monitor | 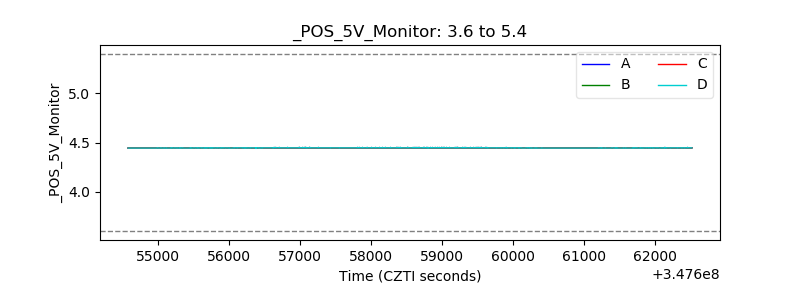 |
| _ROLL_ROT | 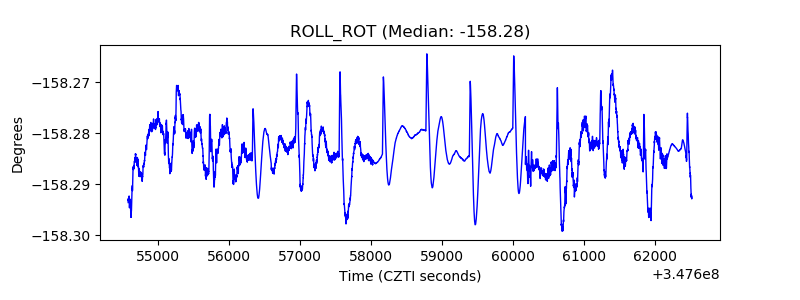 |
| _Roll_DEC | 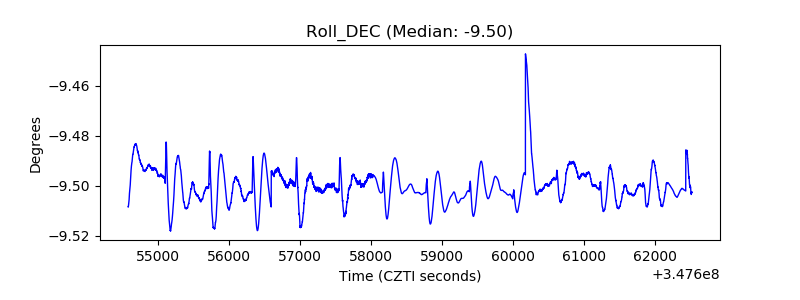 |
| _Roll_RA | 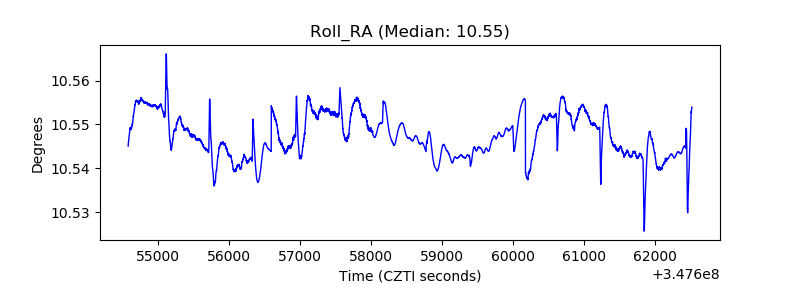 |
| Veto Counter | 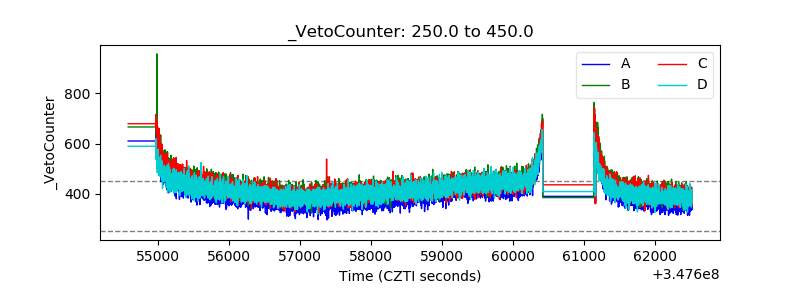 |