| Param | Original file | Final file |
|---|---|---|
| Filename | modeM0/AS1A10_058T09_9000004100_28534cztM0_level2.evt | modeM0/AS1A10_058T09_9000004100_28534cztM0_level2_quad_clean.evt |
| Size (bytes) | 785,534,400 | 97,980,480 |
| Size | 749.1 MB | 93.4 MB |
| Events in quadrant A | 4,428,695 | 640,870 |
| Events in quadrant B | 5,648,592 | 608,711 |
| Events in quadrant C | 3,795,789 | 624,041 |
| Events in quadrant D | 9,390,555 | 550,875 |
| Mode SS | |||
|---|---|---|---|
| Quadrant | BADHDUFLAG | Total packets | Discarded packets |
| A | 0 | 162 | 0 |
| B | 0 | 162 | 0 |
| C | 0 | 162 | 0 |
| D | 0 | 162 | 0 |
| Mode M9 | |||
|---|---|---|---|
| Quadrant | BADHDUFLAG | Total packets | Discarded packets |
| A | 0 | 10 | 0 |
| B | 0 | 10 | 0 |
| C | 0 | 10 | 0 |
| D | 0 | 10 | 0 |
| Mode M0 | |||
|---|---|---|---|
| Quadrant | BADHDUFLAG | Total packets | Discarded packets |
| A | 0 | 18170 | 3 |
| B | 0 | 21795 | 3 |
| C | 0 | 16179 | 3 |
| D | 0 | 33335 | 3 |
| Quadrant | Total seconds | Saturated seconds | Saturation percentage |
|---|---|---|---|
| A | 7783 | 188 | 2.415521% |
| B | 7784 | 800 | 10.277492% |
| C | 7784 | 99 | 1.271840% |
| D | 7784 | 1412 | 18.139774% |
Noise dominated data is calculated using 1-second bins in cleaned event files. If a bin has >2000 counts, and if more than 50% of those come from <1% of pixels, then it is considered to be noise-dominated and hence unusable.
| Quadrant | # 1 sec bins | Bins with >0 counts | Bins with >2000 counts | High rate bins dominated by noise | Noise dominated (total time) | Noise dominated (detector-on time) | Marked lightcurve |
|---|---|---|---|---|---|---|---|
| A | 8928 | 7786 | 127 | 127 | 1.42% | 1.63% | 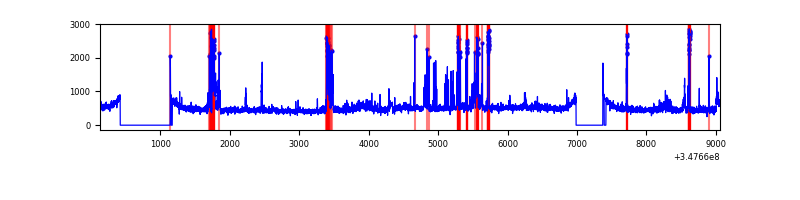 |
| B | 8929 | 7785 | 524 | 524 | 5.87% | 6.73% | 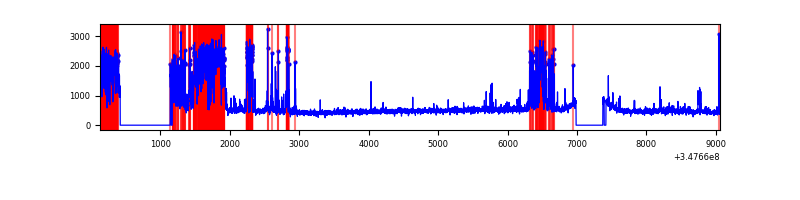 |
| C | 8929 | 7786 | 2 | 2 | 0.02% | 0.03% | 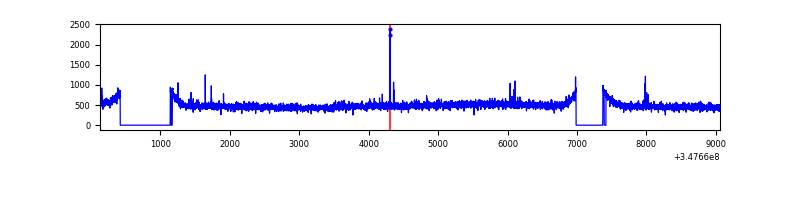 |
| D | 8929 | 7786 | 1054 | 1054 | 11.80% | 13.54% | 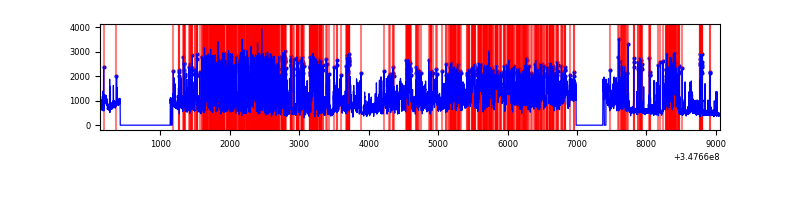 |
Top three noisy pixels from each quadrant. If the there are fewer than three noisy pixels in the level2.evt file, extra rows are filled as -1
| Pixel properties | Quadrant properties | ||||||
|---|---|---|---|---|---|---|---|
| Quadrant | DetID | PixID | Counts | Sigma | Mean | Median | Sigma |
| A | 15 | 174 | 759024 | 3951.46 | 948 | 927 | 191.9 |
| A | 13 | 254 | 15706 | 77.03 | 948 | 927 | 191.9 |
| A | 8 | 192 | 9920 | 46.87 | 948 | 927 | 191.9 |
| B | 10 | 245 | 1584062 | 9053.58 | 912 | 888 | 174.9 |
| B | 5 | 172 | 241502 | 1375.98 | 912 | 888 | 174.9 |
| B | 5 | 255 | 71173 | 401.93 | 912 | 888 | 174.9 |
| C | 14 | 238 | 148587 | 688.3 | 911 | 920 | 214.5 |
| C | 3 | 233 | 43500 | 198.47 | 911 | 920 | 214.5 |
| C | 7 | 247 | 32840 | 148.78 | 911 | 920 | 214.5 |
| D | 1 | 52 | 4913142 | 23307.07 | 860 | 835 | 210.8 |
| D | 8 | 195 | 788434 | 3736.86 | 860 | 835 | 210.8 |
| D | 2 | 250 | 233821 | 1105.43 | 860 | 835 | 210.8 |
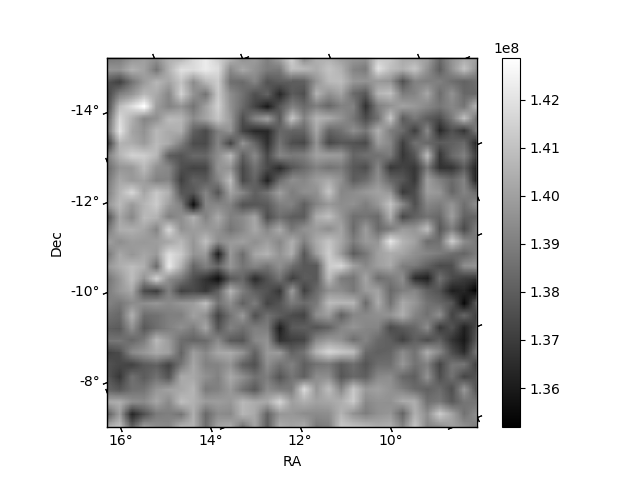
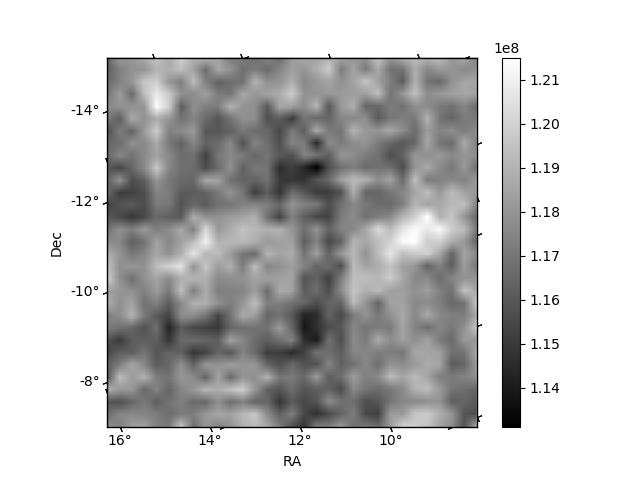
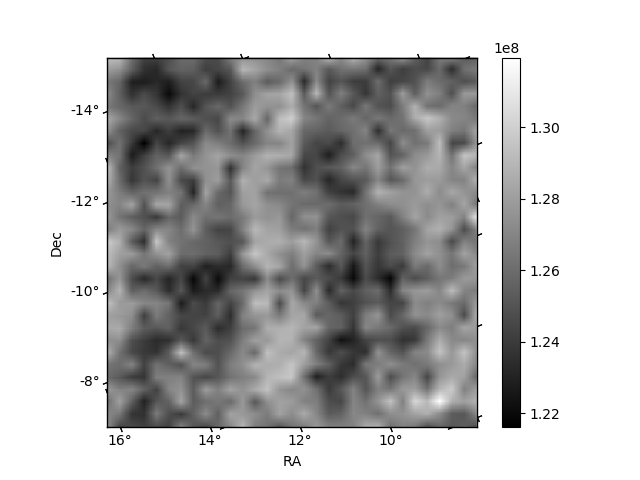
Histogram calculated using DETX and DETY for each event in the final _common_clean file
| Quadrant A |  |
 |
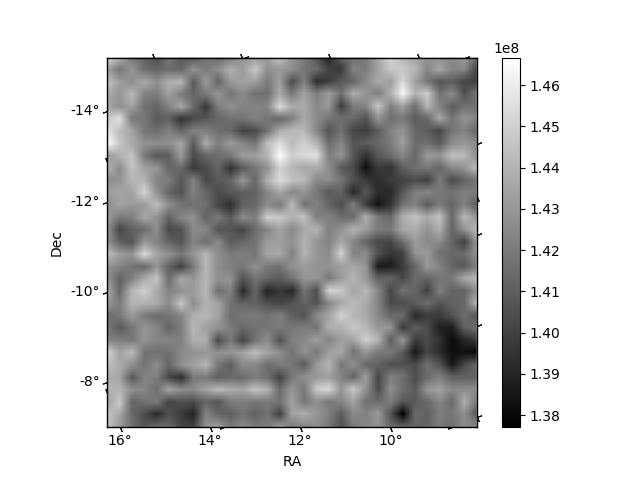
Quadrant B |
|---|---|---|---|
| Quadrant D |  |
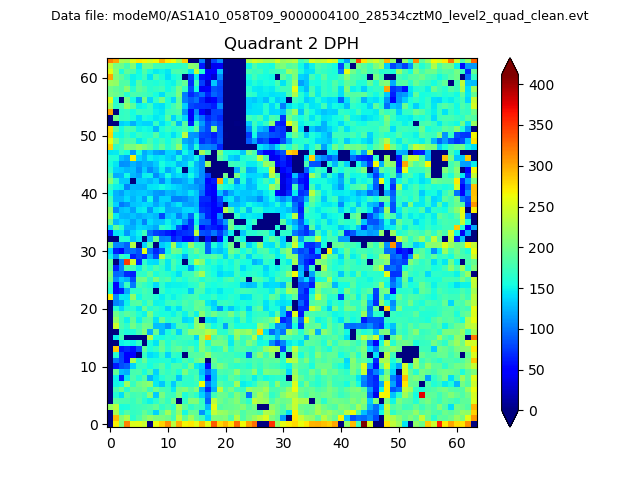 |
Quadrant C |
| Plot type | Count rate plots | Images |
|---|---|---|
| Comparison with Poisson distribution Blue bars denote a histogram of data divided into 1 sec bins. Red curve is a Poisson curve with rate = median count rate of data. |
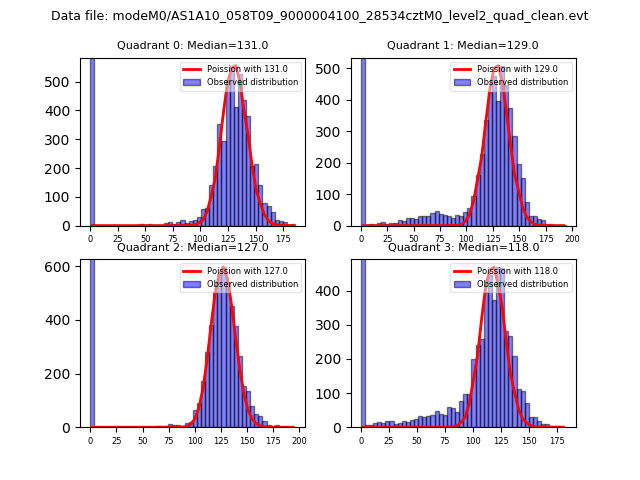 |
 |
| Quadrant-wise count rates Data is divided into 100 sec bins |
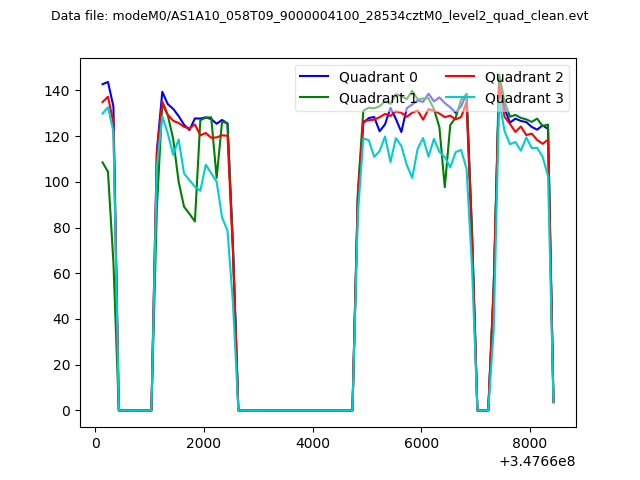 |
|
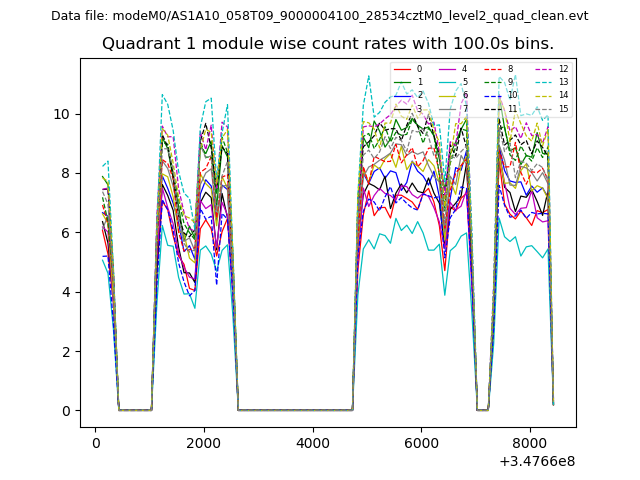
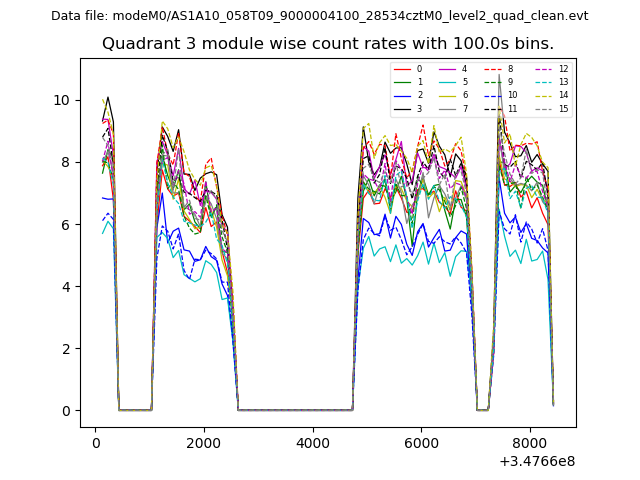
| Module-wise count rates for Quadrant A Data is divided into 100 sec bins |
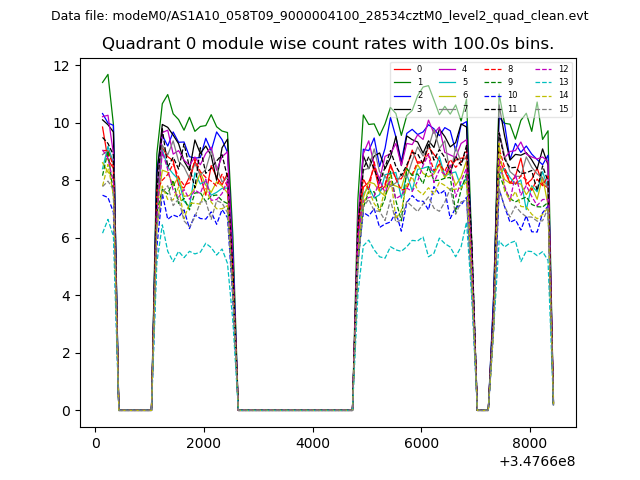 |
 |
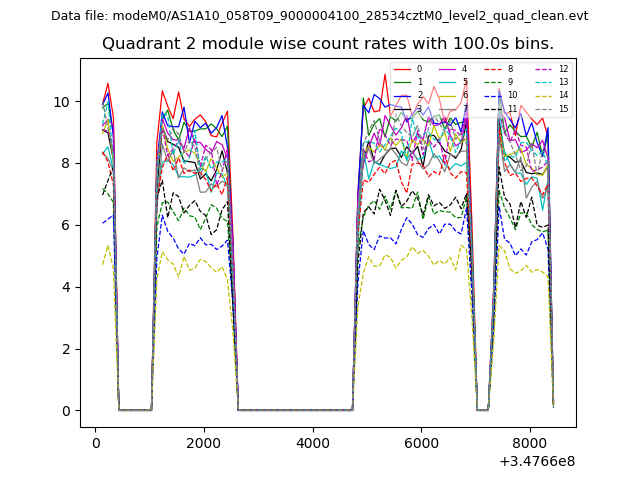
| Module-wise count rates for Quadrant B Data is divided into 100 sec bins |
 |
 |
| Module-wise count rates for Quadrant C Data is divided into 100 sec bins |
 |
 |
| Module-wise count rates for Quadrant D Data is divided into 100 sec bins |
 |
 |
| Parameter | Plot |
|---|---|
| CZT HV Monitor | 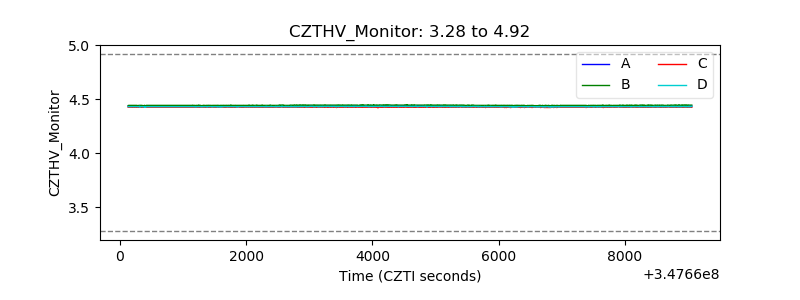 |
| D_VDD |  |
| Temperature 1 | 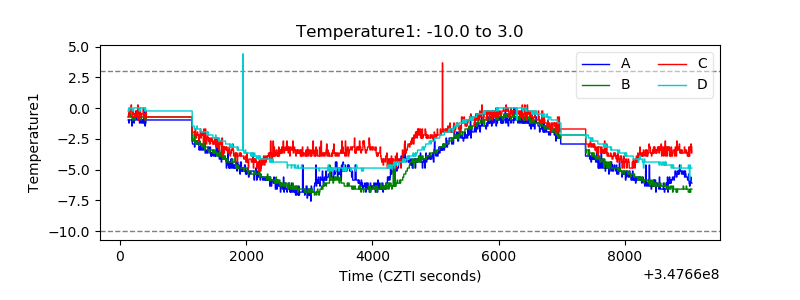 |
| Veto HV Monitor |  |
| Veto LLD |  |
| Alpha Counter | 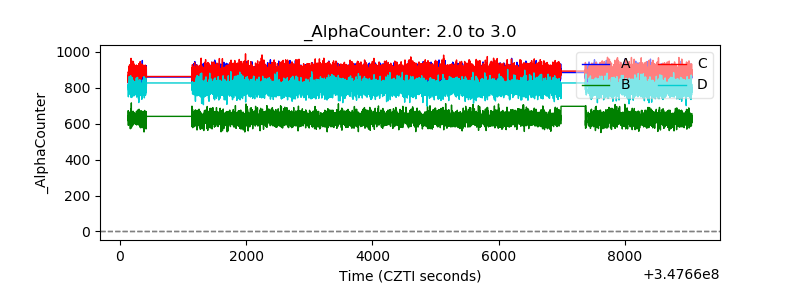 |
| _CPM_Rate | 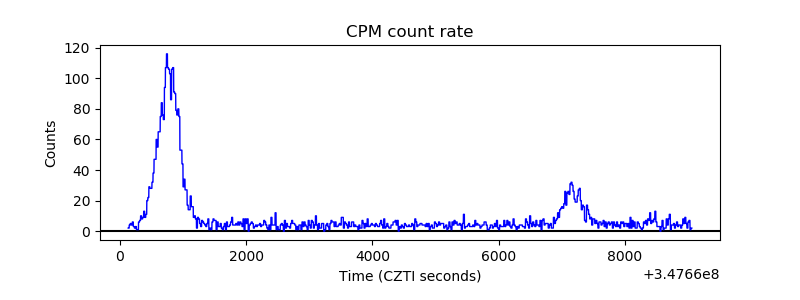 |
| CZT Counter | 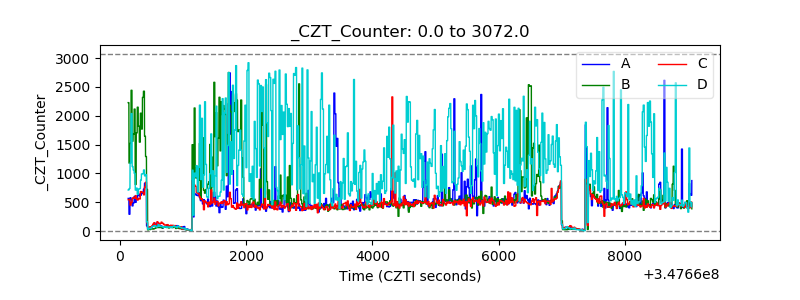 |
| +2.5 Volts monitor |  |
| +5 Volts monitor | 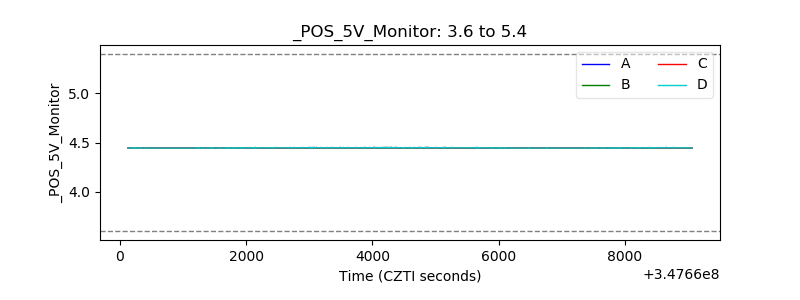 |
| _ROLL_ROT | 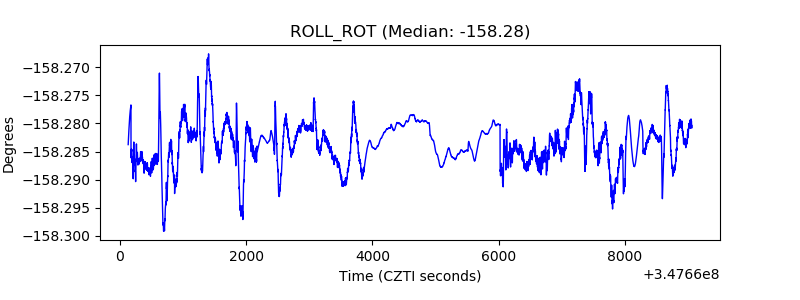 |
| _Roll_DEC | 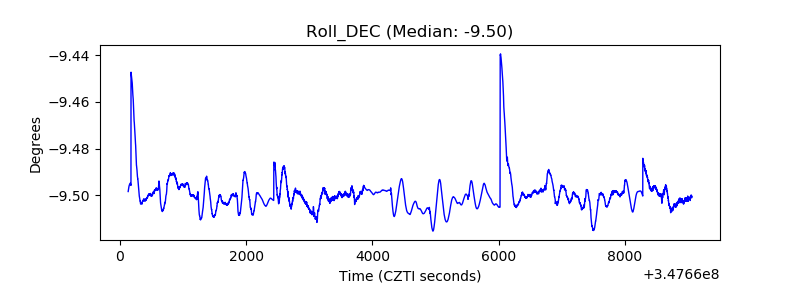 |
| _Roll_RA |  |
| Veto Counter | 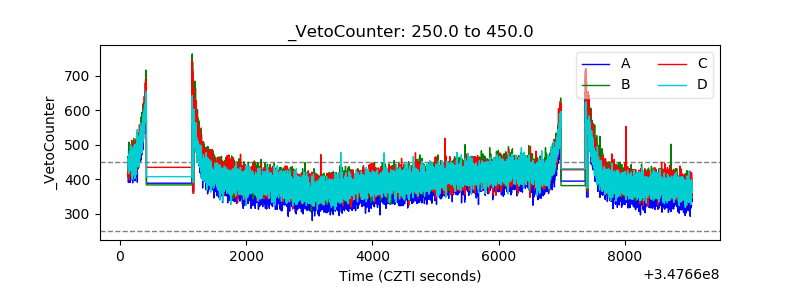 |