| Param | Original file | Final file |
|---|---|---|
| Filename | modeM0/AS1A10_058T09_9000004100_28536cztM0_level2.evt | modeM0/AS1A10_058T09_9000004100_28536cztM0_level2_quad_clean.evt |
| Size (bytes) | 540,489,600 | 85,979,520 |
| Size | 515.5 MB | 82.0 MB |
| Events in quadrant A | 3,680,459 | 541,622 |
| Events in quadrant B | 3,423,461 | 557,967 |
| Events in quadrant C | 3,515,669 | 528,600 |
| Events in quadrant D | 5,289,235 | 502,391 |
| Mode SS | |||
|---|---|---|---|
| Quadrant | BADHDUFLAG | Total packets | Discarded packets |
| A | 0 | 140 | 0 |
| B | 0 | 140 | 0 |
| C | 0 | 140 | 0 |
| D | 0 | 140 | 0 |
| Mode M9 | |||
|---|---|---|---|
| Quadrant | BADHDUFLAG | Total packets | Discarded packets |
| A | 0 | 7 | 0 |
| B | 0 | 7 | 0 |
| C | 0 | 7 | 0 |
| D | 0 | 7 | 0 |
| Mode M0 | |||
|---|---|---|---|
| Quadrant | BADHDUFLAG | Total packets | Discarded packets |
| A | 0 | 15442 | 2 |
| B | 0 | 14414 | 2 |
| C | 0 | 14670 | 2 |
| D | 0 | 20357 | 3 |
| Quadrant | Total seconds | Saturated seconds | Saturation percentage |
|---|---|---|---|
| A | 6779 | 238 | 3.510842% |
| B | 6780 | 177 | 2.610619% |
| C | 6780 | 190 | 2.802360% |
| D | 6779 | 452 | 6.667650% |
Noise dominated data is calculated using 1-second bins in cleaned event files. If a bin has >2000 counts, and if more than 50% of those come from <1% of pixels, then it is considered to be noise-dominated and hence unusable.
| Quadrant | # 1 sec bins | Bins with >0 counts | Bins with >2000 counts | High rate bins dominated by noise | Noise dominated (total time) | Noise dominated (detector-on time) | Marked lightcurve |
|---|---|---|---|---|---|---|---|
| A | 7444 | 6780 | 96 | 96 | 1.29% | 1.42% | 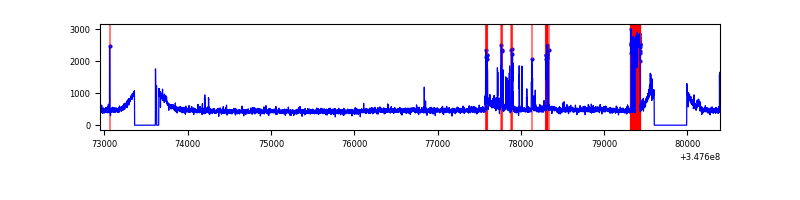 |
| B | 7445 | 6780 | 1 | 1 | 0.01% | 0.01% | 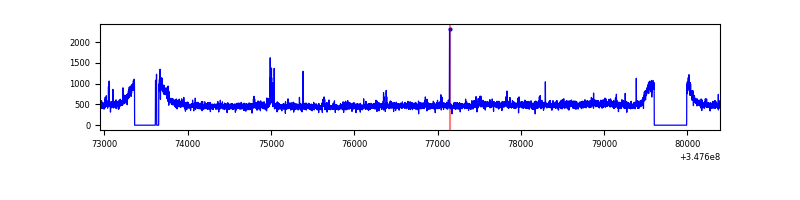 |
| C | 7445 | 6781 | 2 | 2 | 0.03% | 0.03% | 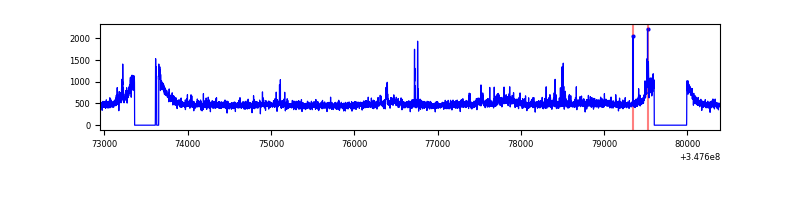 |
| D | 7444 | 6780 | 267 | 267 | 3.59% | 3.94% | 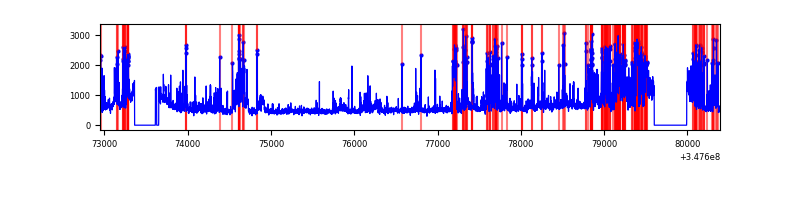 |
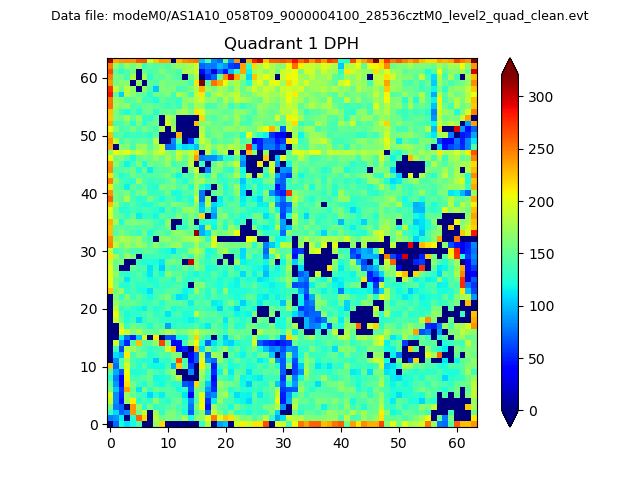
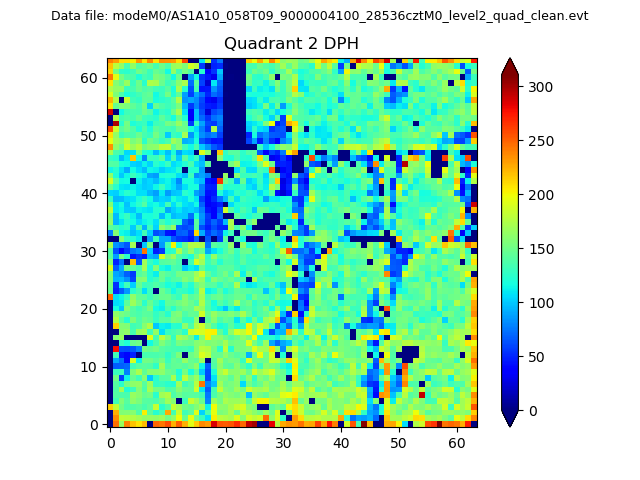
Top three noisy pixels from each quadrant. If the there are fewer than three noisy pixels in the level2.evt file, extra rows are filled as -1
| Pixel properties | Quadrant properties | ||||||
|---|---|---|---|---|---|---|---|
| Quadrant | DetID | PixID | Counts | Sigma | Mean | Median | Sigma |
| A | 15 | 174 | 423586 | 2454.91 | 840 | 820 | 172.2 |
| A | 13 | 254 | 13214 | 71.97 | 840 | 820 | 172.2 |
| A | 3 | 137 | 8510 | 44.65 | 840 | 820 | 172.2 |
| B | 10 | 245 | 48535 | 291.32 | 840 | 819 | 163.8 |
| B | 0 | 230 | 43062 | 257.91 | 840 | 819 | 163.8 |
| B | 12 | 111 | 20944 | 122.87 | 840 | 819 | 163.8 |
| C | 14 | 238 | 126210 | 645.74 | 809 | 813 | 194.2 |
| C | 3 | 233 | 123747 | 633.06 | 809 | 813 | 194.2 |
| C | 7 | 247 | 85888 | 438.1 | 809 | 813 | 194.2 |
| D | 1 | 52 | 1171346 | 6013.39 | 800 | 776 | 194.7 |
| D | 8 | 195 | 785392 | 4030.69 | 800 | 776 | 194.7 |
| D | 2 | 250 | 169519 | 866.86 | 800 | 776 | 194.7 |
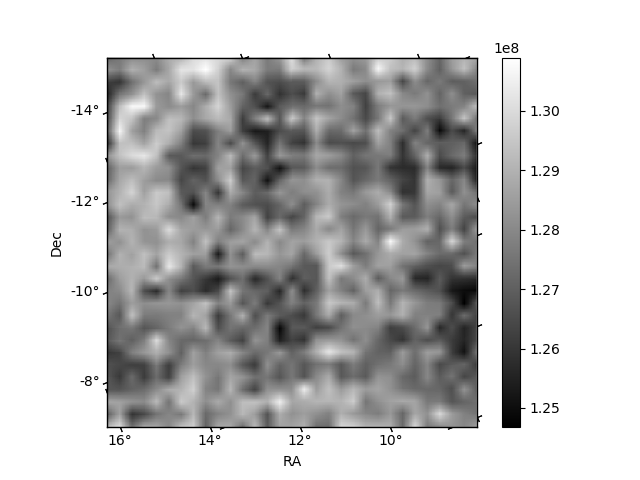
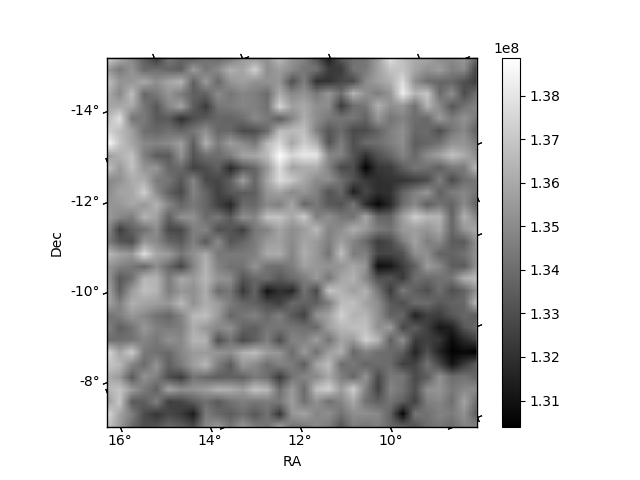
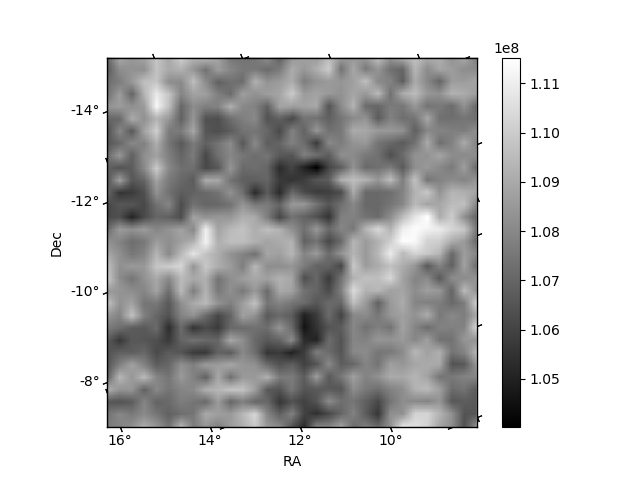
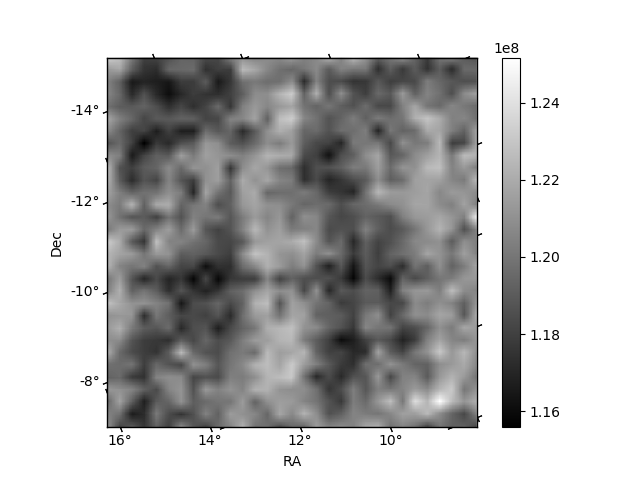
Histogram calculated using DETX and DETY for each event in the final _common_clean file
| Quadrant A | 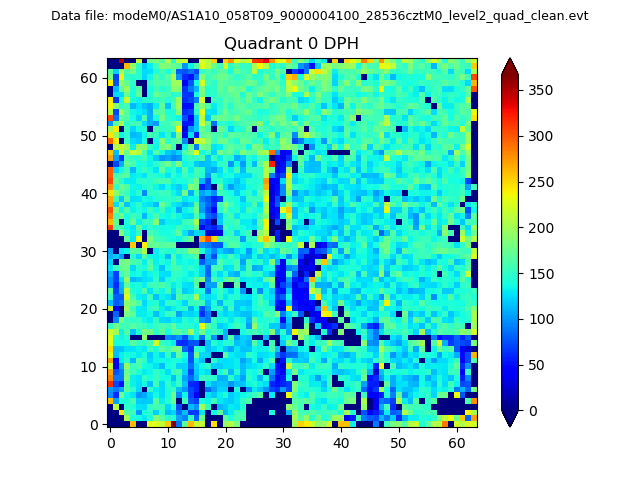 |
 |
Quadrant B |
|---|---|---|---|
| Quadrant D | 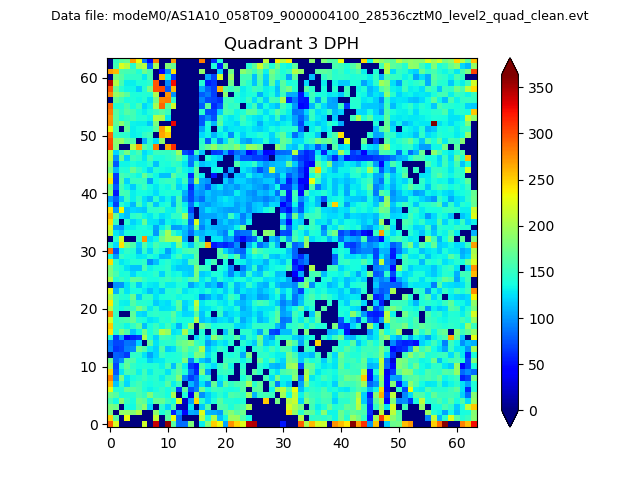 |
 |
Quadrant C |
| Plot type | Count rate plots | Images |
|---|---|---|
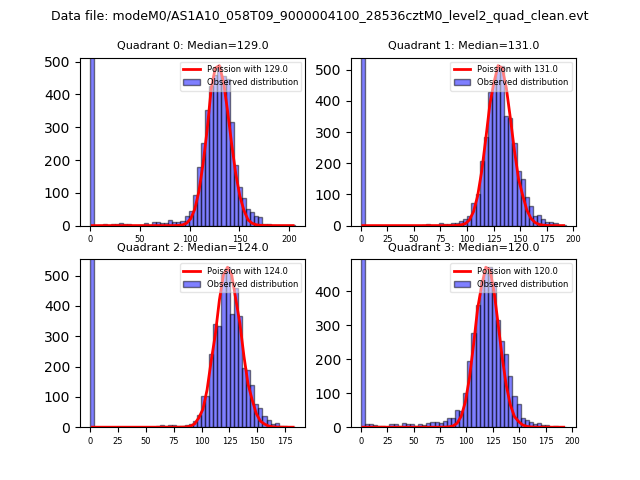
| Comparison with Poisson distribution Blue bars denote a histogram of data divided into 1 sec bins. Red curve is a Poisson curve with rate = median count rate of data. |
 |
 |
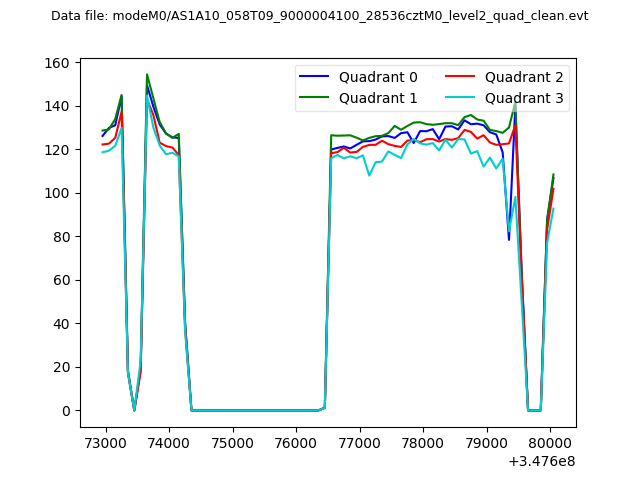
| Quadrant-wise count rates Data is divided into 100 sec bins |
 |
|
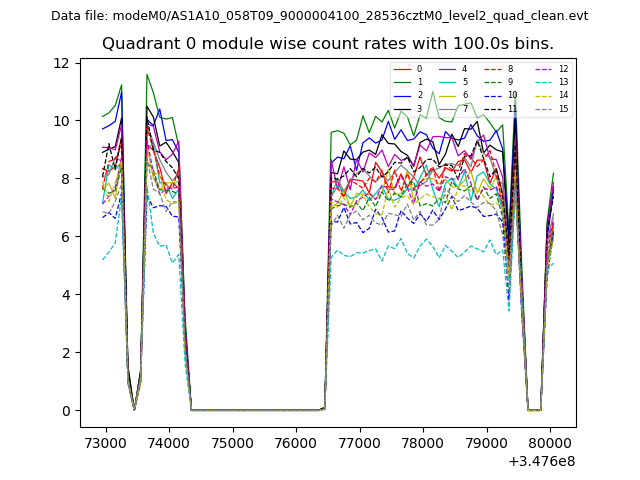
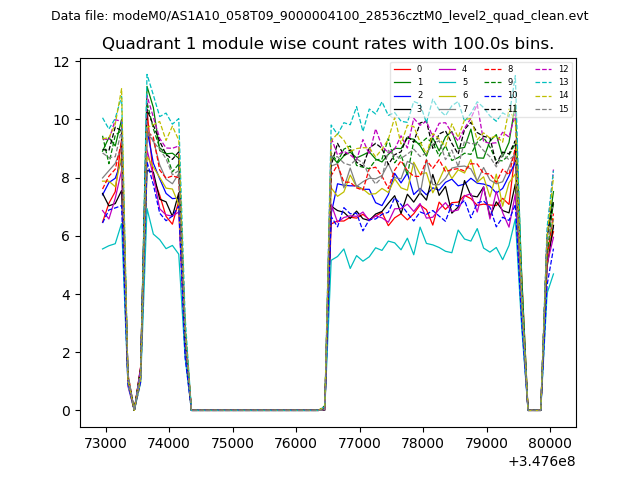
| Module-wise count rates for Quadrant A Data is divided into 100 sec bins |
 |
 |
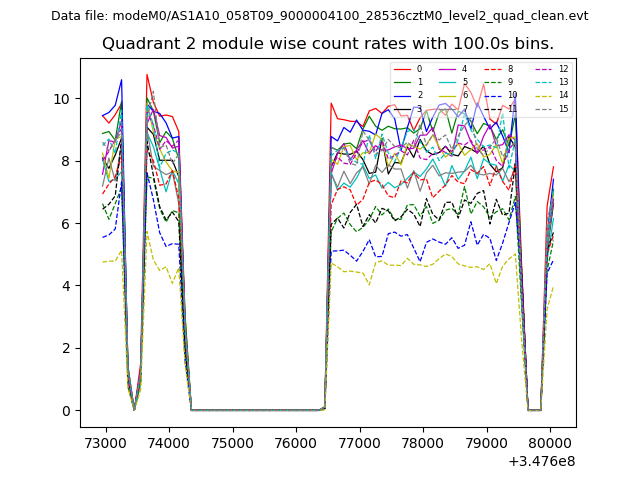
| Module-wise count rates for Quadrant B Data is divided into 100 sec bins |
 |
 |
| Module-wise count rates for Quadrant C Data is divided into 100 sec bins |
 |
 |
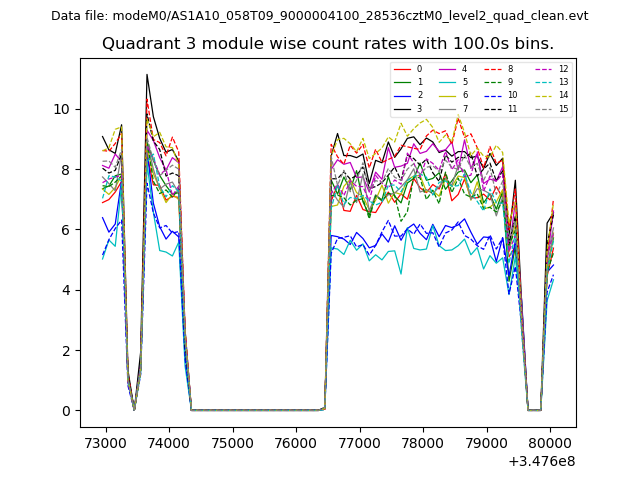
| Module-wise count rates for Quadrant D Data is divided into 100 sec bins |
 |
 |
| Parameter | Plot |
|---|---|
| CZT HV Monitor | 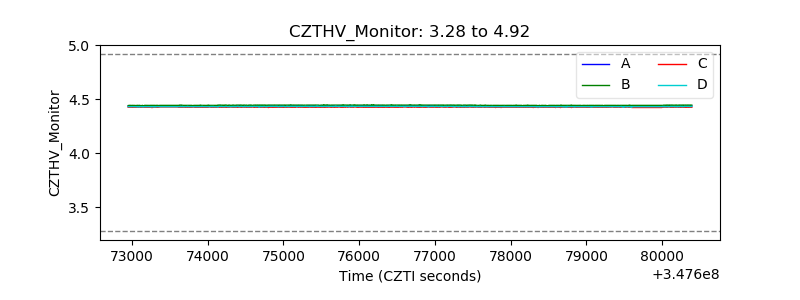 |
| D_VDD | 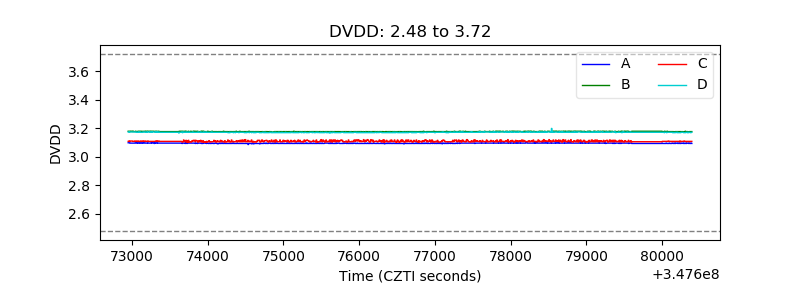 |
| Temperature 1 | 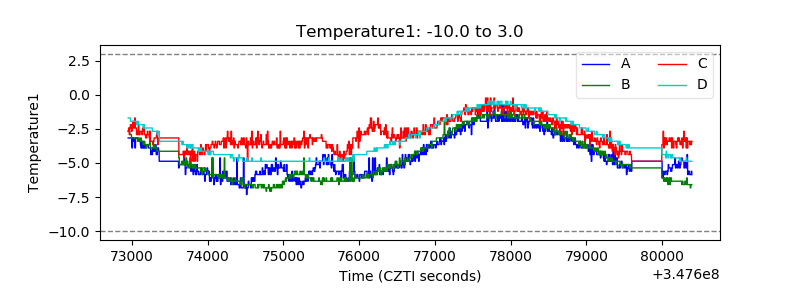 |
| Veto HV Monitor | 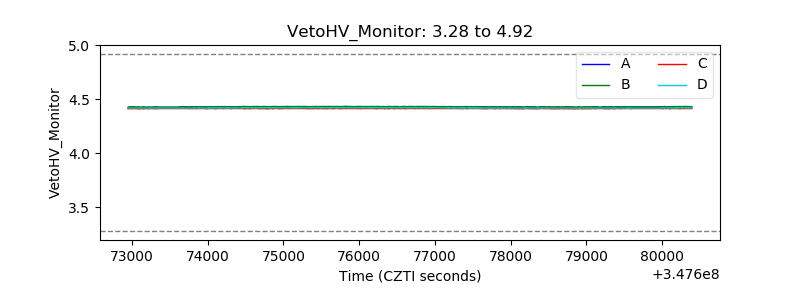 |
| Veto LLD | 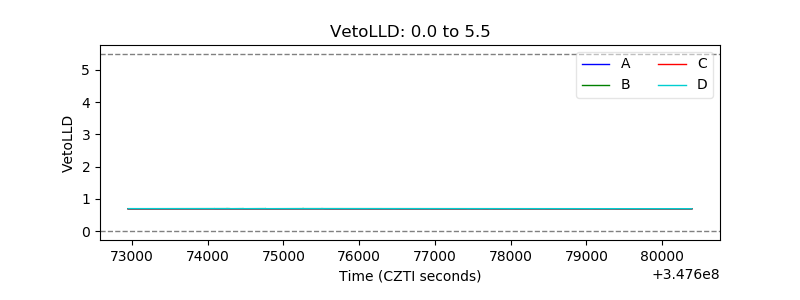 |
| Alpha Counter | 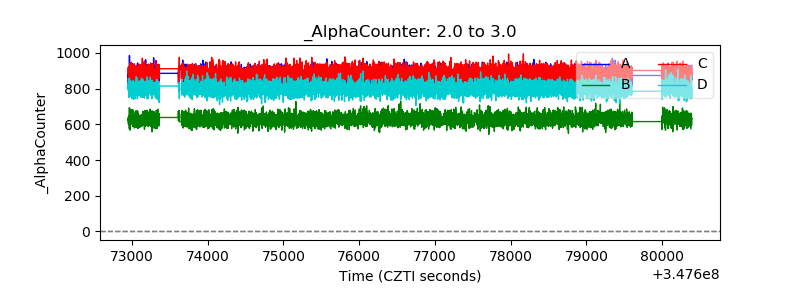 |
| _CPM_Rate | 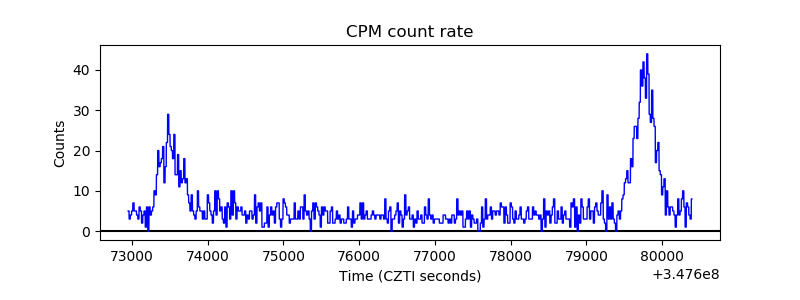 |
| CZT Counter | 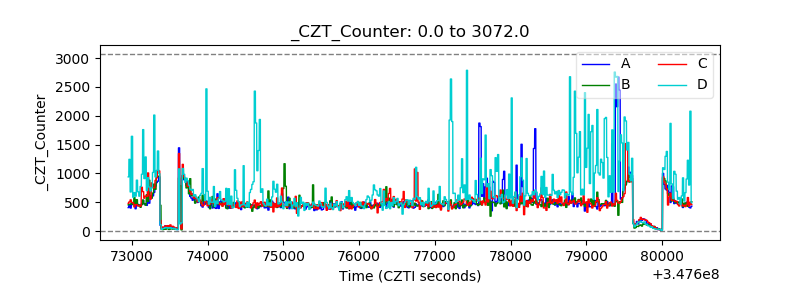 |
| +2.5 Volts monitor |  |
| +5 Volts monitor |  |
| _ROLL_ROT | 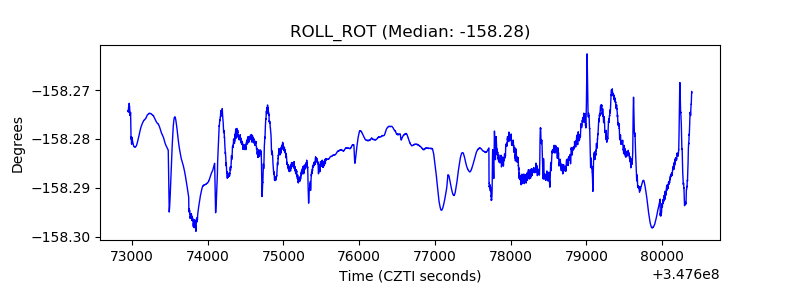 |
| _Roll_DEC | 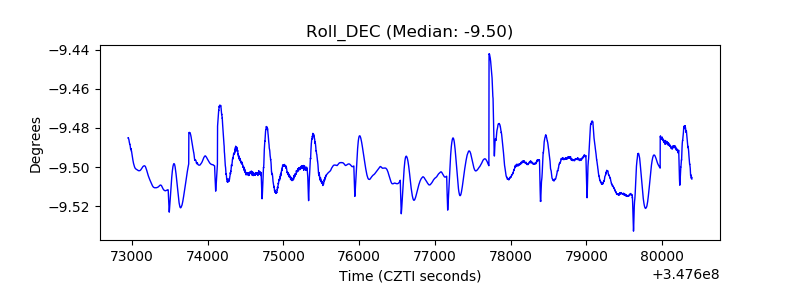 |
| _Roll_RA | 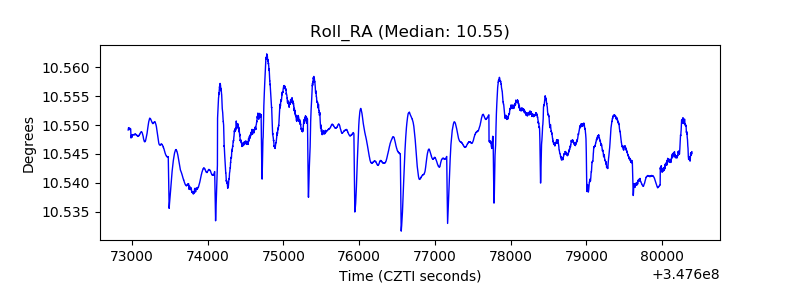 |
| Veto Counter | 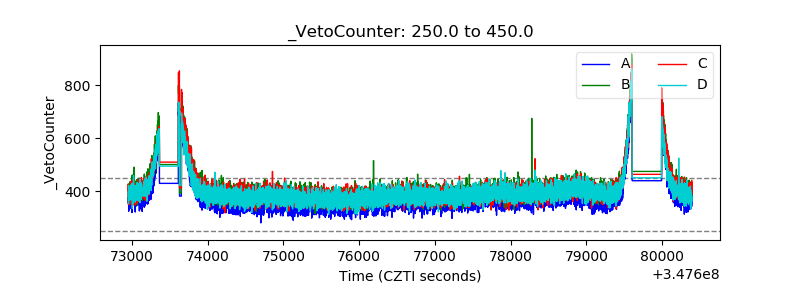 |