| Param | Original file | Final file |
|---|---|---|
| Filename | modeM0/AS1A10_058T09_9000004100_28538cztM0_level2.evt | modeM0/AS1A10_058T09_9000004100_28538cztM0_level2_quad_clean.evt |
| Size (bytes) | 1,058,034,240 | 145,411,200 |
| Size | 1009.0 MB | 138.7 MB |
| Events in quadrant A | 7,005,523 | 896,982 |
| Events in quadrant B | 6,347,289 | 914,815 |
| Events in quadrant C | 6,195,624 | 877,616 |
| Events in quadrant D | 11,623,488 | 822,865 |
| Mode SS | |||
|---|---|---|---|
| Quadrant | BADHDUFLAG | Total packets | Discarded packets |
| A | 0 | 264 | 0 |
| B | 0 | 264 | 0 |
| C | 0 | 264 | 0 |
| D | 0 | 264 | 0 |
| Mode M9 | |||
|---|---|---|---|
| Quadrant | BADHDUFLAG | Total packets | Discarded packets |
| A | 0 | 17 | 0 |
| B | 0 | 17 | 0 |
| C | 0 | 17 | 0 |
| D | 0 | 17 | 0 |
| Mode M0 | |||
|---|---|---|---|
| Quadrant | BADHDUFLAG | Total packets | Discarded packets |
| A | 0 | 29117 | 3 |
| B | 0 | 26818 | 3 |
| C | 0 | 26390 | 3 |
| D | 0 | 43030 | 3 |
| Quadrant | Total seconds | Saturated seconds | Saturation percentage |
|---|---|---|---|
| A | 12893 | 261 | 2.024354% |
| B | 12893 | 134 | 1.039324% |
| C | 12894 | 177 | 1.372732% |
| D | 12894 | 1035 | 8.026989% |
Noise dominated data is calculated using 1-second bins in cleaned event files. If a bin has >2000 counts, and if more than 50% of those come from <1% of pixels, then it is considered to be noise-dominated and hence unusable.
| Quadrant | # 1 sec bins | Bins with >0 counts | Bins with >2000 counts | High rate bins dominated by noise | Noise dominated (total time) | Noise dominated (detector-on time) | Marked lightcurve |
|---|---|---|---|---|---|---|---|
| A | 14628 | 12893 | 117 | 117 | 0.80% | 0.91% | 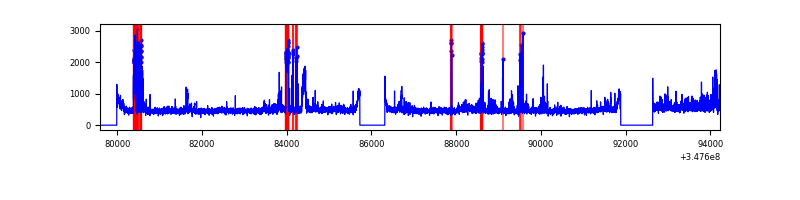 |
| B | 14628 | 12893 | 6 | 6 | 0.04% | 0.05% | 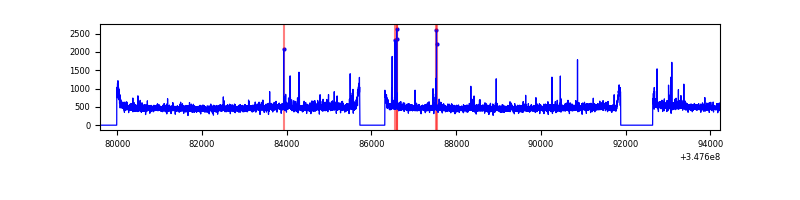 |
| C | 14629 | 12894 | 0 | 0 | 0.00% | 0.00% | 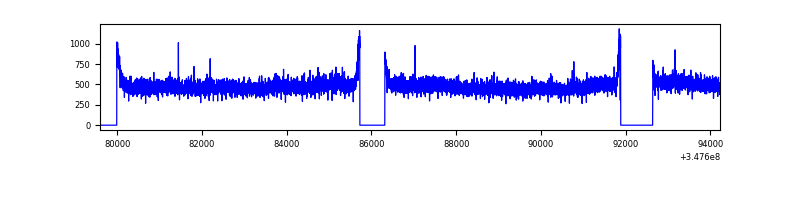 |
| D | 14629 | 12894 | 847 | 847 | 5.79% | 6.57% | 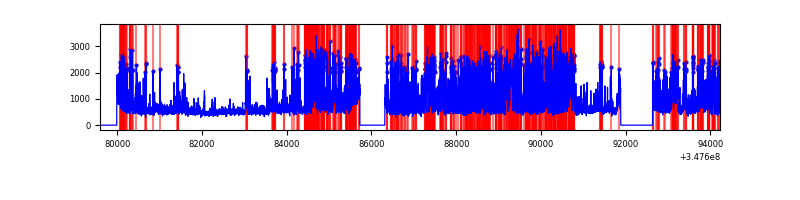 |
Top three noisy pixels from each quadrant. If the there are fewer than three noisy pixels in the level2.evt file, extra rows are filled as -1
| Pixel properties | Quadrant properties | ||||||
|---|---|---|---|---|---|---|---|
| Quadrant | DetID | PixID | Counts | Sigma | Mean | Median | Sigma |
| A | 15 | 174 | 926793 | 2961.37 | 1558 | 1526 | 312.4 |
| A | 14 | 238 | 26164 | 78.86 | 1558 | 1526 | 312.4 |
| A | 13 | 254 | 25406 | 76.43 | 1558 | 1526 | 312.4 |
| B | 0 | 230 | 82499 | 271.5 | 1556 | 1517 | 298.3 |
| B | 10 | 245 | 65272 | 213.74 | 1556 | 1517 | 298.3 |
| B | 12 | 111 | 38162 | 122.86 | 1556 | 1517 | 298.3 |
| C | 14 | 238 | 240007 | 674.15 | 1500 | 1505 | 353.8 |
| C | 3 | 233 | 48070 | 131.62 | 1500 | 1505 | 353.8 |
| C | 7 | 247 | 44242 | 120.8 | 1500 | 1505 | 353.8 |
| D | 1 | 52 | 4876026 | 13751.77 | 1475 | 1436 | 354.5 |
| D | 8 | 195 | 960562 | 2705.8 | 1475 | 1436 | 354.5 |
| D | 13 | 104 | 77485 | 214.54 | 1475 | 1436 | 354.5 |
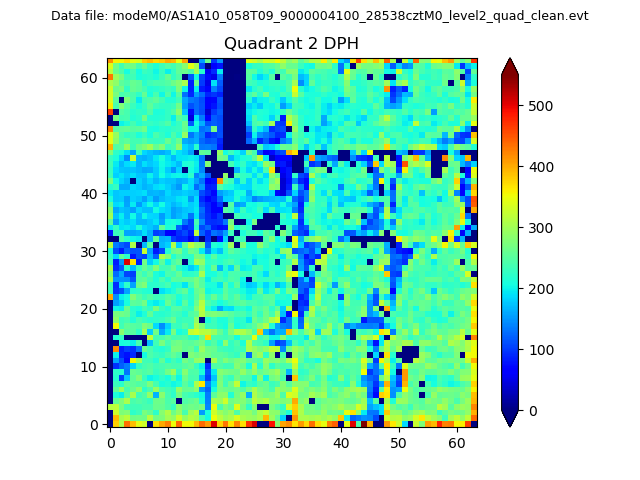
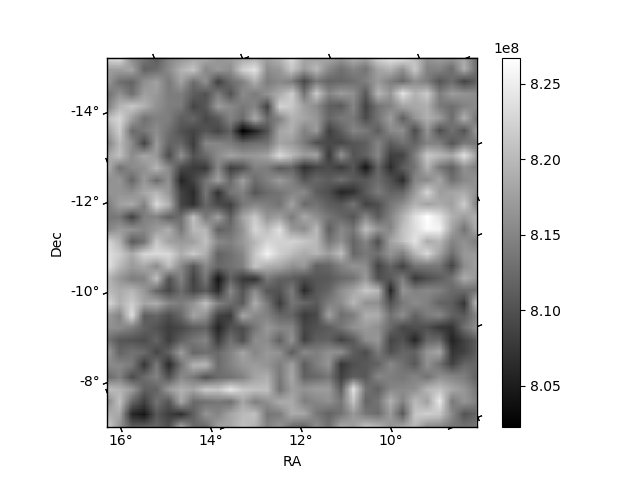
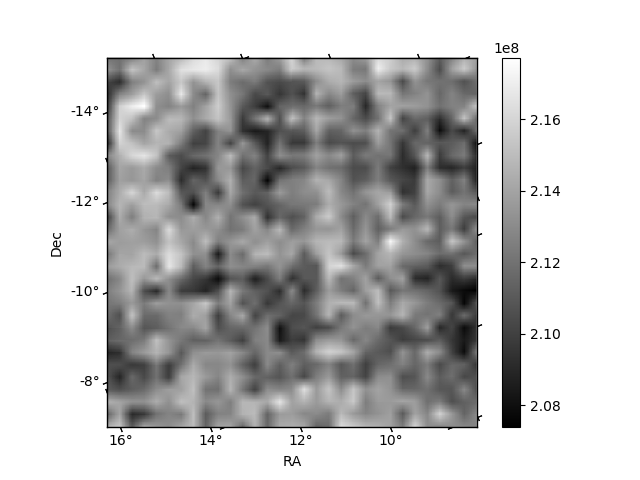
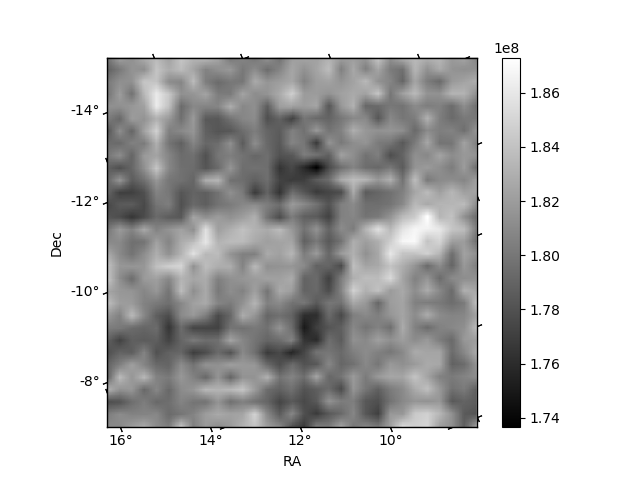
Histogram calculated using DETX and DETY for each event in the final _common_clean file
| Quadrant A | 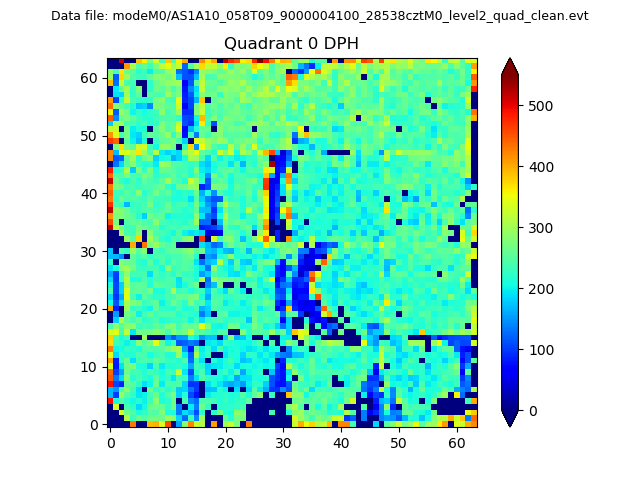 |
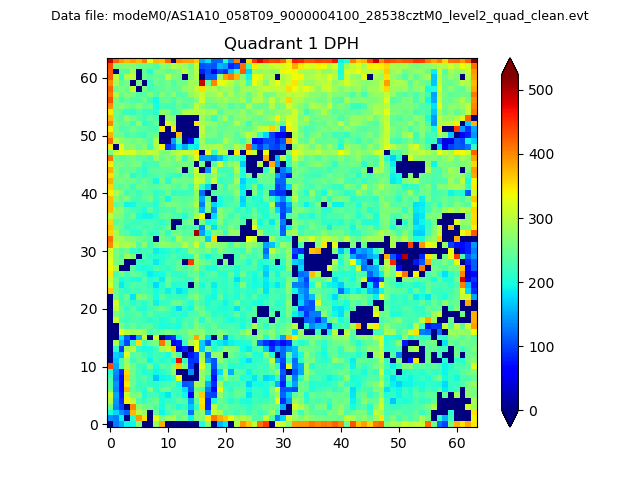 |
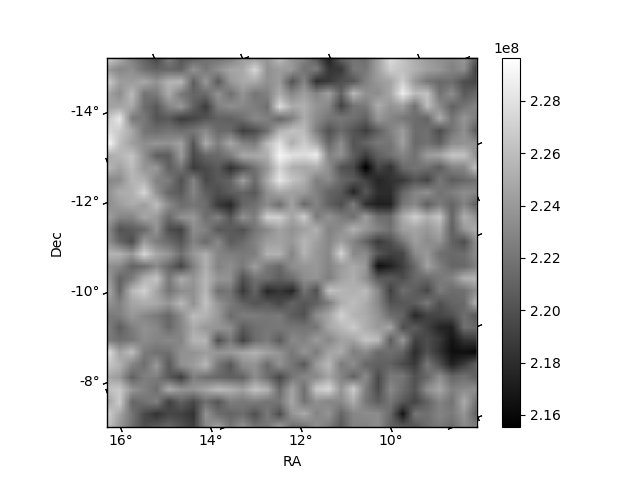
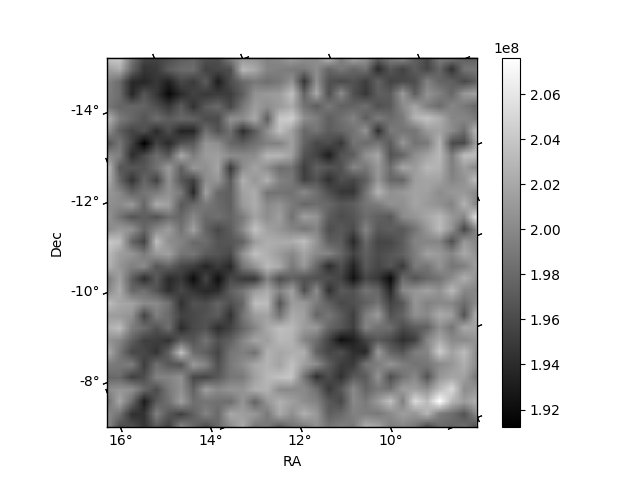
Quadrant B |
|---|---|---|---|
| Quadrant D | 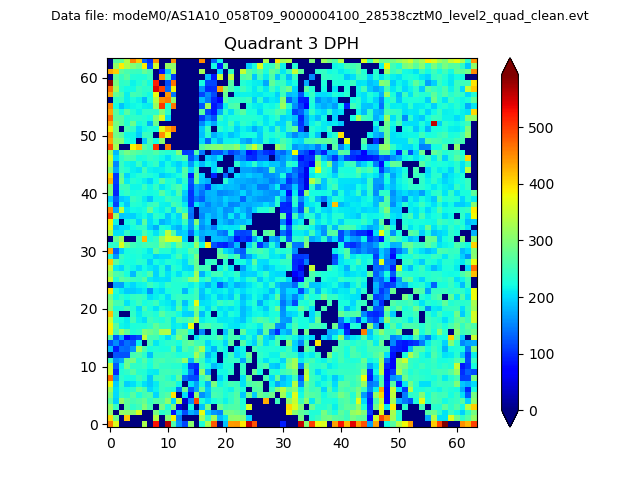 |
 |
Quadrant C |
| Plot type | Count rate plots | Images |
|---|---|---|
| Comparison with Poisson distribution Blue bars denote a histogram of data divided into 1 sec bins. Red curve is a Poisson curve with rate = median count rate of data. |
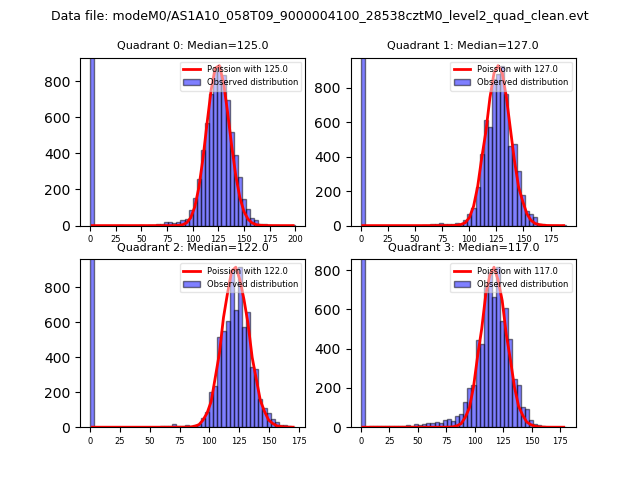 |
 |
| Quadrant-wise count rates Data is divided into 100 sec bins |
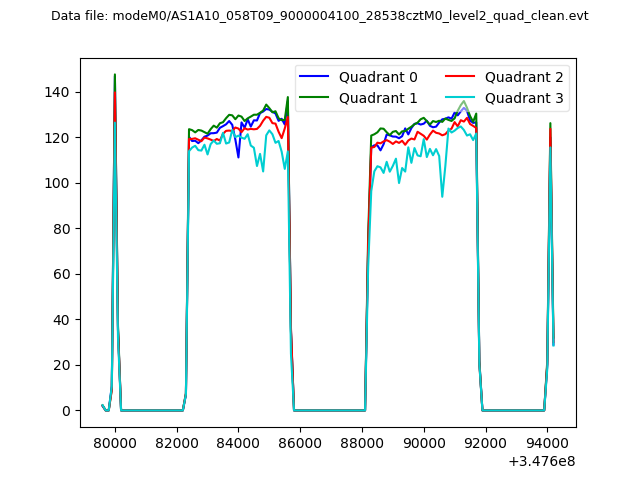 |
|
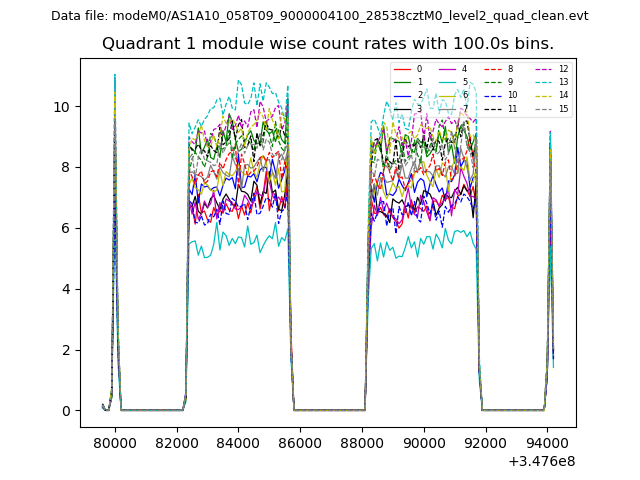
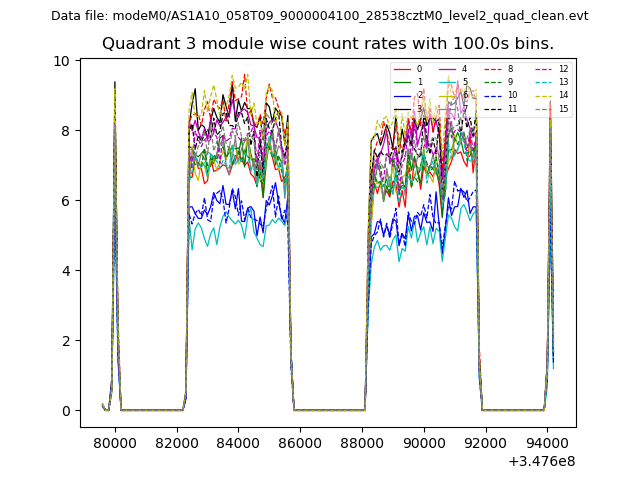
| Module-wise count rates for Quadrant A Data is divided into 100 sec bins |
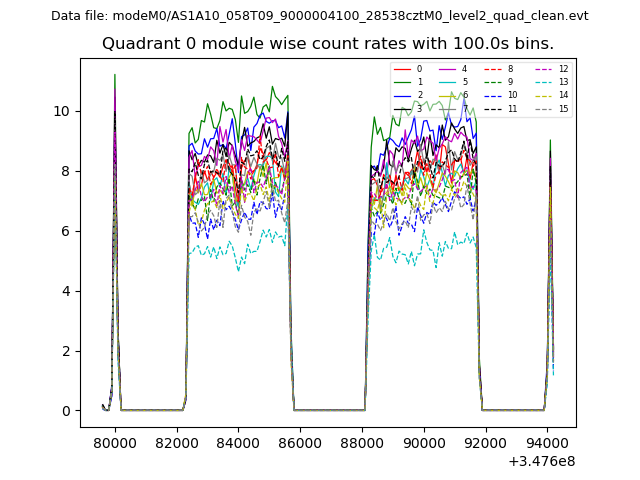 |
 |
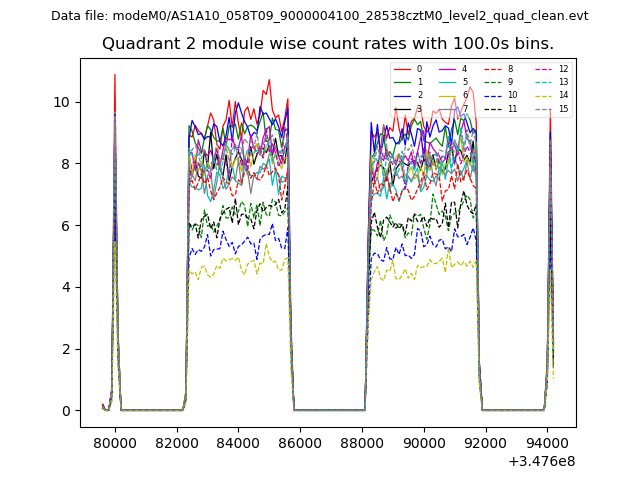
| Module-wise count rates for Quadrant B Data is divided into 100 sec bins |
 |
 |
| Module-wise count rates for Quadrant C Data is divided into 100 sec bins |
 |
 |
| Module-wise count rates for Quadrant D Data is divided into 100 sec bins |
 |
 |
| Parameter | Plot |
|---|---|
| CZT HV Monitor | 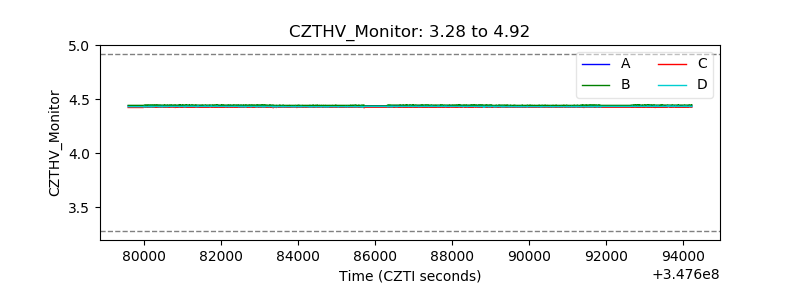 |
| D_VDD | 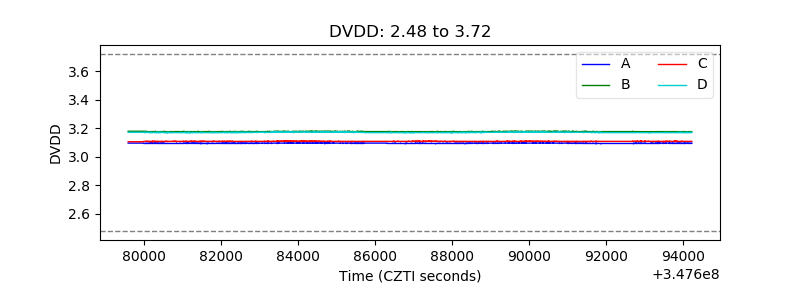 |
| Temperature 1 | 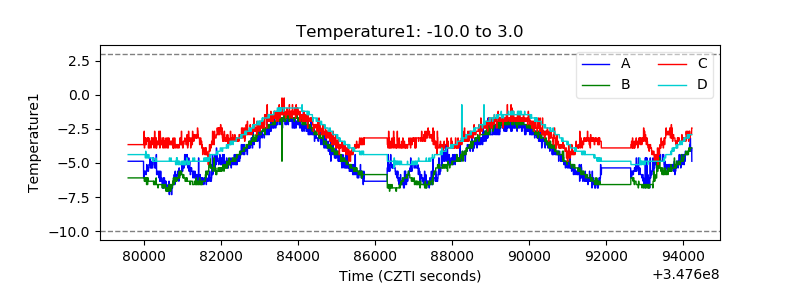 |
| Veto HV Monitor | 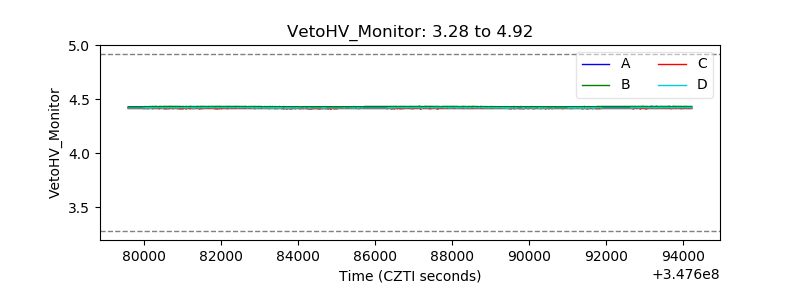 |
| Veto LLD | 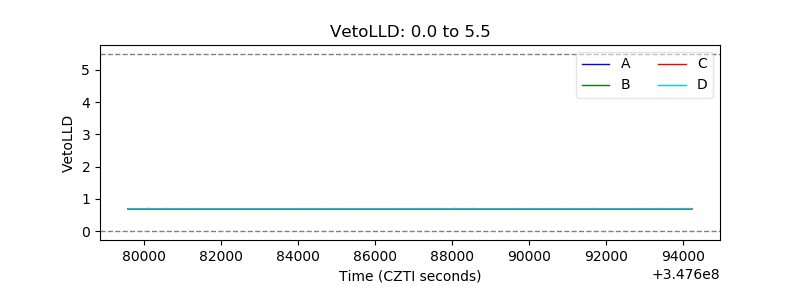 |
| Alpha Counter | 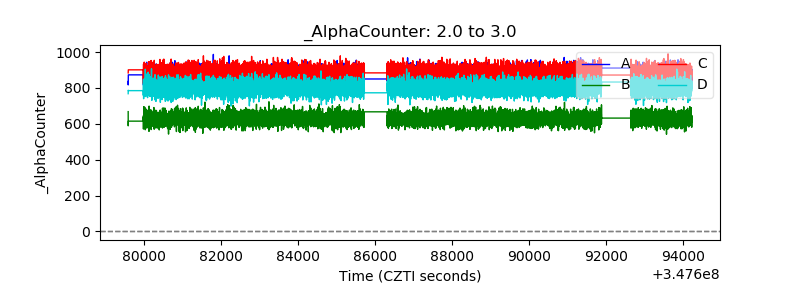 |
| _CPM_Rate | 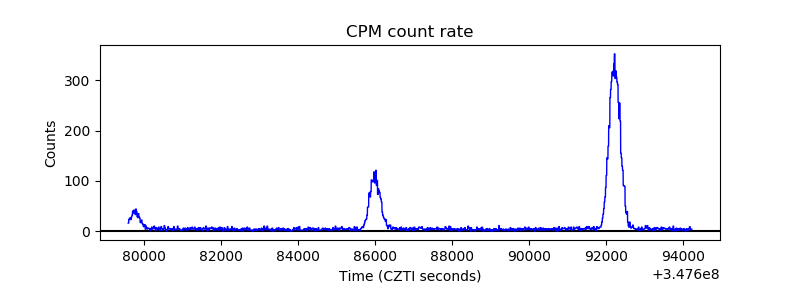 |
| CZT Counter | 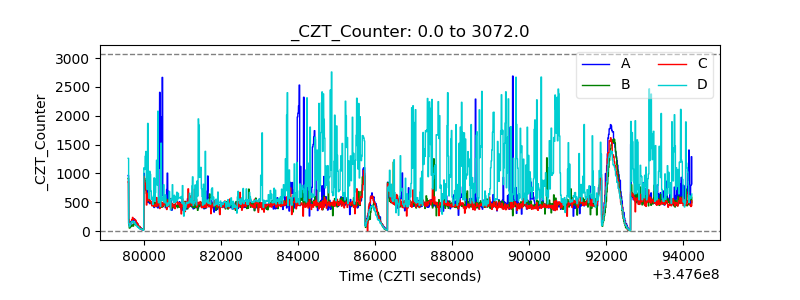 |
| +2.5 Volts monitor |  |
| +5 Volts monitor |  |
| _ROLL_ROT | 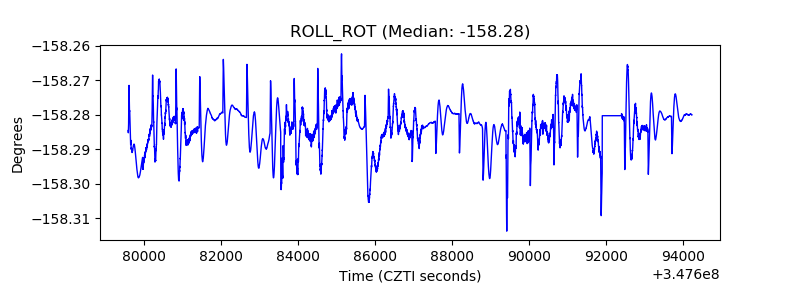 |
| _Roll_DEC | 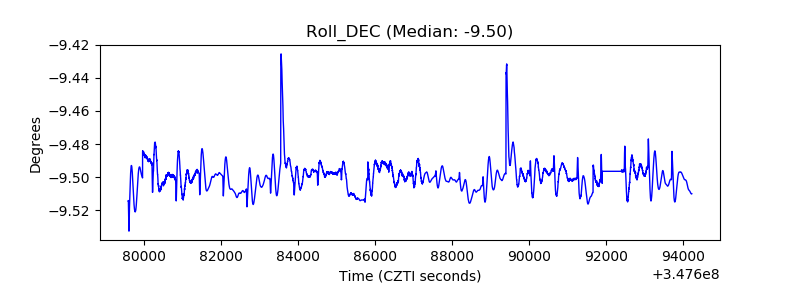 |
| _Roll_RA | 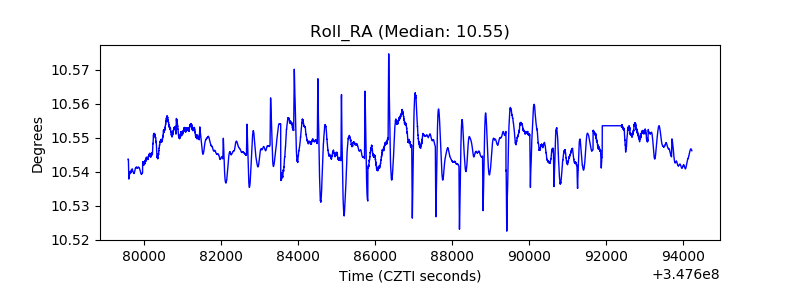 |
| Veto Counter | 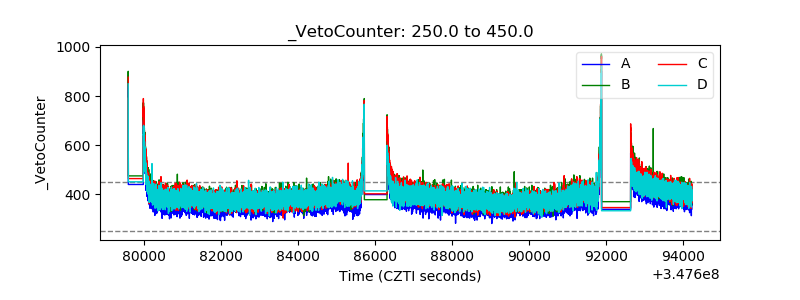 |