| Param | Original file | Final file |
|---|---|---|
| Filename | modeM0/AS1A10_058T09_9000004100_28539cztM0_level2.evt | modeM0/AS1A10_058T09_9000004100_28539cztM0_level2_quad_clean.evt |
| Size (bytes) | 582,192,000 | 80,421,120 |
| Size | 555.2 MB | 76.7 MB |
| Events in quadrant A | 4,194,830 | 500,206 |
| Events in quadrant B | 4,178,977 | 505,480 |
| Events in quadrant C | 3,226,267 | 494,423 |
| Events in quadrant D | 5,584,331 | 474,591 |
| Mode SS | |||
|---|---|---|---|
| Quadrant | BADHDUFLAG | Total packets | Discarded packets |
| A | 0 | 134 | 0 |
| B | 0 | 134 | 0 |
| C | 0 | 134 | 0 |
| D | 0 | 134 | 0 |
| Mode M9 | |||
|---|---|---|---|
| Quadrant | BADHDUFLAG | Total packets | Discarded packets |
| A | 0 | 9 | 0 |
| B | 0 | 9 | 0 |
| C | 0 | 9 | 0 |
| D | 0 | 9 | 0 |
| Mode M0 | |||
|---|---|---|---|
| Quadrant | BADHDUFLAG | Total packets | Discarded packets |
| A | 0 | 16623 | 1 |
| B | 0 | 16725 | 1 |
| C | 0 | 13719 | 1 |
| D | 0 | 21182 | 1 |
| Quadrant | Total seconds | Saturated seconds | Saturation percentage |
|---|---|---|---|
| A | 6601 | 135 | 2.045145% |
| B | 6602 | 483 | 7.315965% |
| C | 6602 | 125 | 1.893366% |
| D | 6602 | 379 | 5.740685% |
Noise dominated data is calculated using 1-second bins in cleaned event files. If a bin has >2000 counts, and if more than 50% of those come from <1% of pixels, then it is considered to be noise-dominated and hence unusable.
| Quadrant | # 1 sec bins | Bins with >0 counts | Bins with >2000 counts | High rate bins dominated by noise | Noise dominated (total time) | Noise dominated (detector-on time) | Marked lightcurve |
|---|---|---|---|---|---|---|---|
| A | 7466 | 6601 | 30 | 30 | 0.40% | 0.45% | 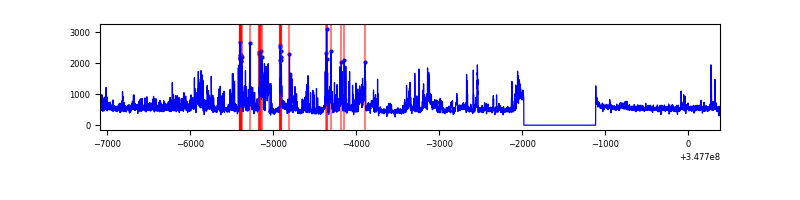 |
| B | 7467 | 6602 | 251 | 251 | 3.36% | 3.80% | 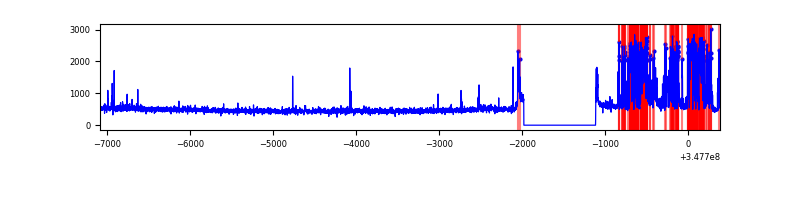 |
| C | 7467 | 6602 | 0 | 0 | 0.00% | 0.00% | 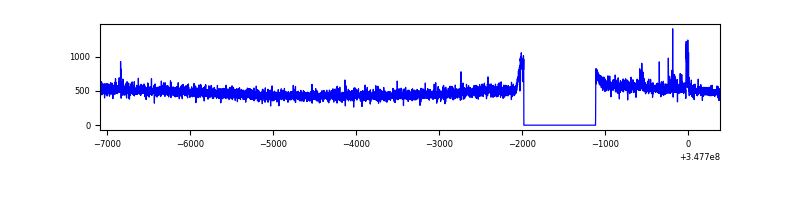 |
| D | 7467 | 6602 | 268 | 268 | 3.59% | 4.06% | 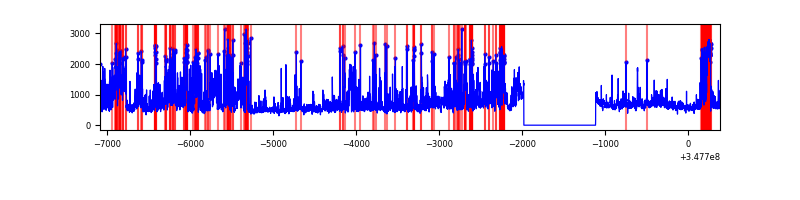 |
Top three noisy pixels from each quadrant. If the there are fewer than three noisy pixels in the level2.evt file, extra rows are filled as -1
| Pixel properties | Quadrant properties | ||||||
|---|---|---|---|---|---|---|---|
| Quadrant | DetID | PixID | Counts | Sigma | Mean | Median | Sigma |
| A | 15 | 174 | 986224 | 5938.29 | 818 | 798 | 165.9 |
| A | 1 | 113 | 42234 | 249.7 | 818 | 798 | 165.9 |
| A | 13 | 254 | 12408 | 69.96 | 818 | 798 | 165.9 |
| B | 10 | 245 | 1031526 | 6696.2 | 795 | 776 | 153.9 |
| B | 12 | 111 | 19078 | 118.9 | 795 | 776 | 153.9 |
| B | 11 | 111 | 17631 | 109.5 | 795 | 776 | 153.9 |
| C | 14 | 238 | 127819 | 687.41 | 783 | 786 | 184.8 |
| C | 7 | 247 | 42542 | 225.95 | 783 | 786 | 184.8 |
| C | 3 | 233 | 7680 | 37.3 | 783 | 786 | 184.8 |
| D | 1 | 52 | 2078520 | 11102.39 | 781 | 758 | 187.1 |
| D | 8 | 195 | 462668 | 2468.19 | 781 | 758 | 187.1 |
| D | 13 | 104 | 30790 | 160.47 | 781 | 758 | 187.1 |
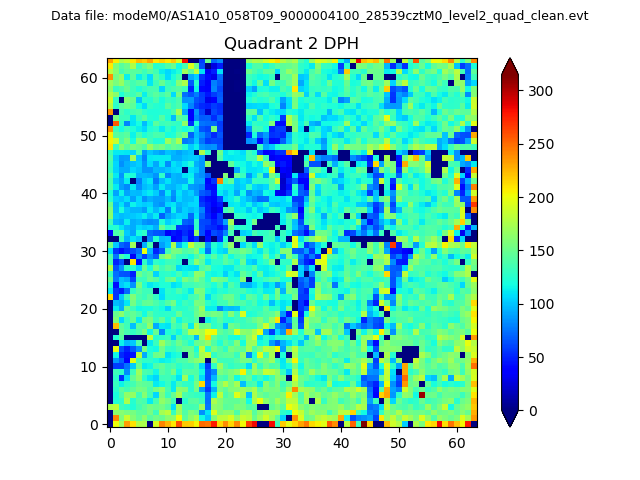
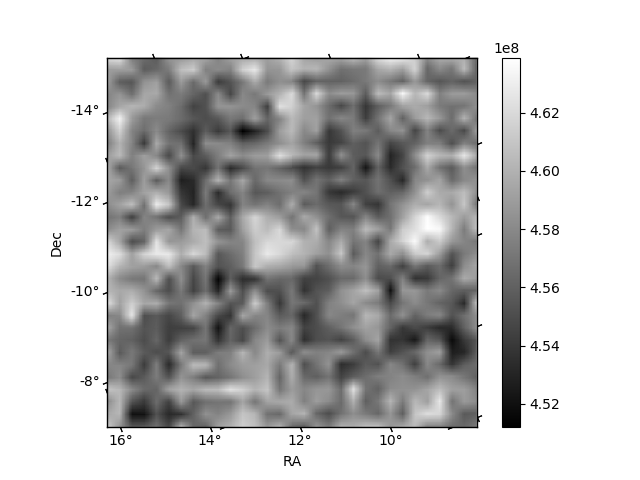
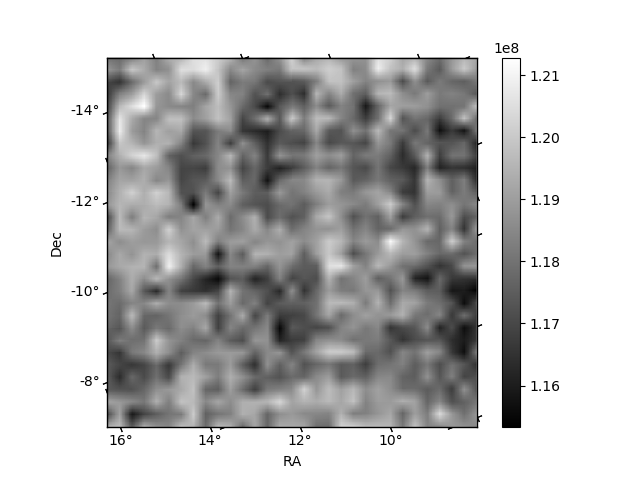
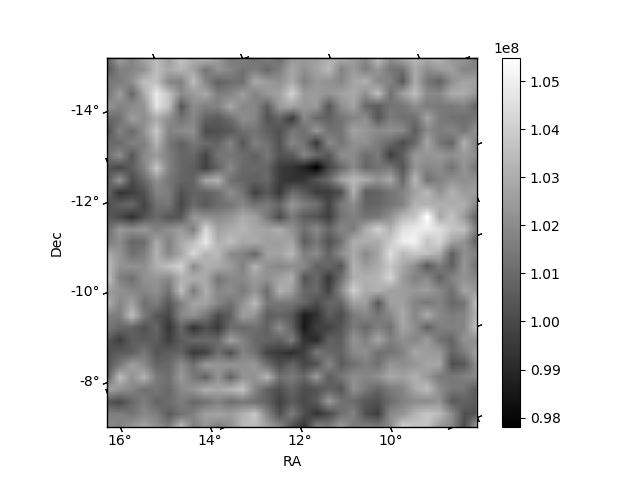
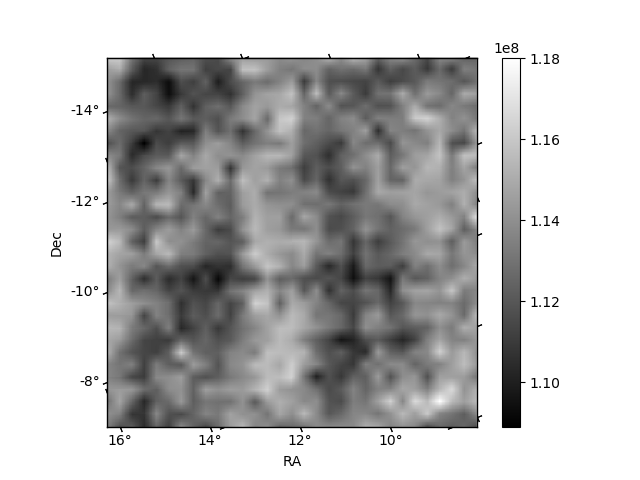
Histogram calculated using DETX and DETY for each event in the final _common_clean file
| Quadrant A | 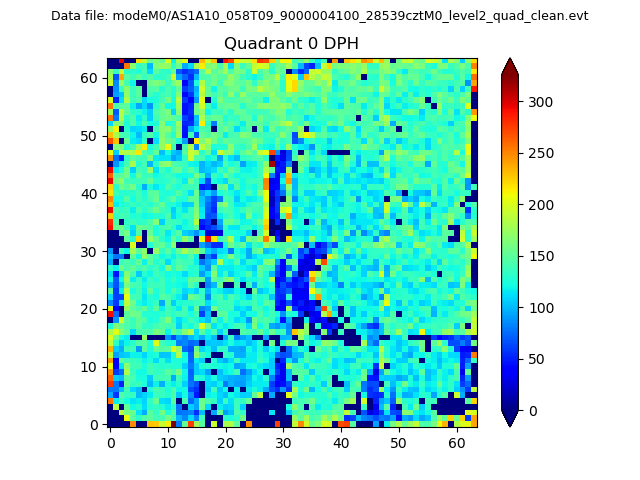 |
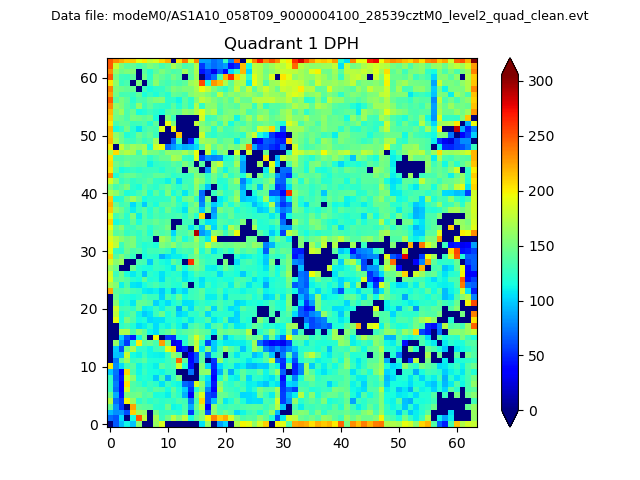 |
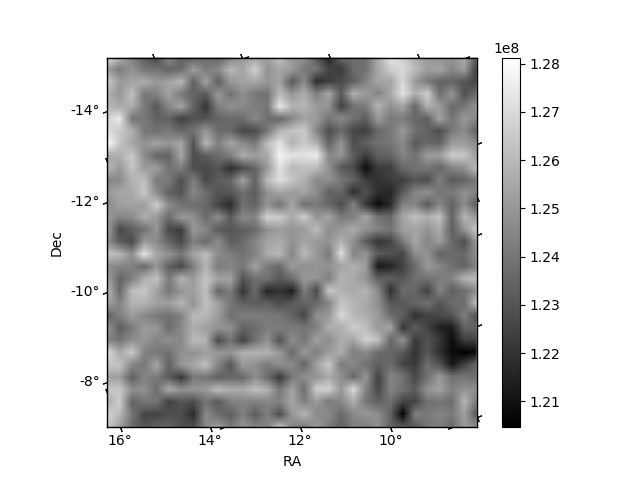
Quadrant B |
|---|---|---|---|
| Quadrant D | 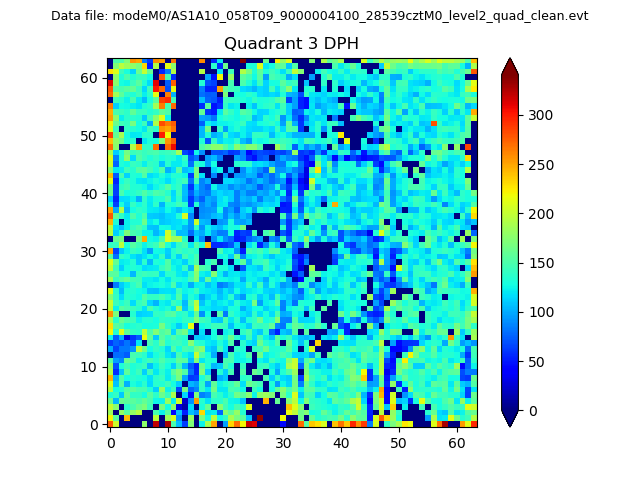 |
 |
Quadrant C |
| Plot type | Count rate plots | Images |
|---|---|---|
| Comparison with Poisson distribution Blue bars denote a histogram of data divided into 1 sec bins. Red curve is a Poisson curve with rate = median count rate of data. |
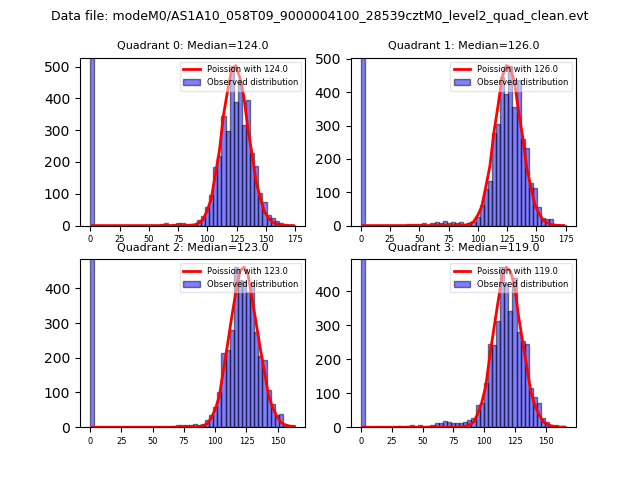 |
 |
| Quadrant-wise count rates Data is divided into 100 sec bins |
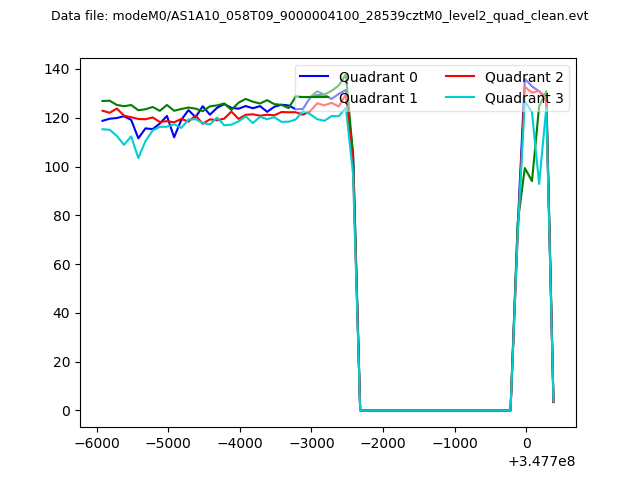 |
|
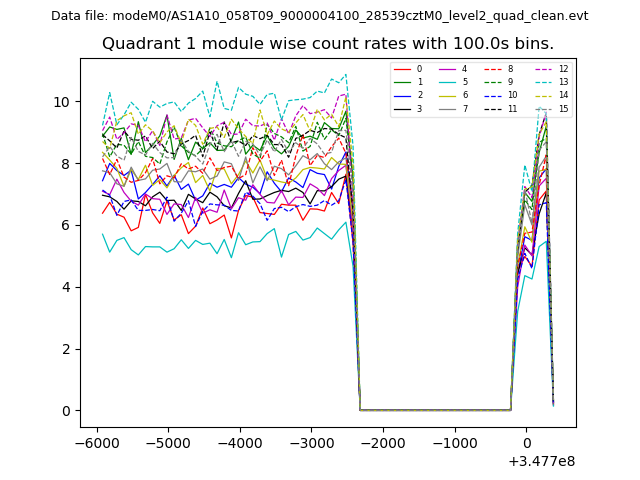
| Module-wise count rates for Quadrant A Data is divided into 100 sec bins |
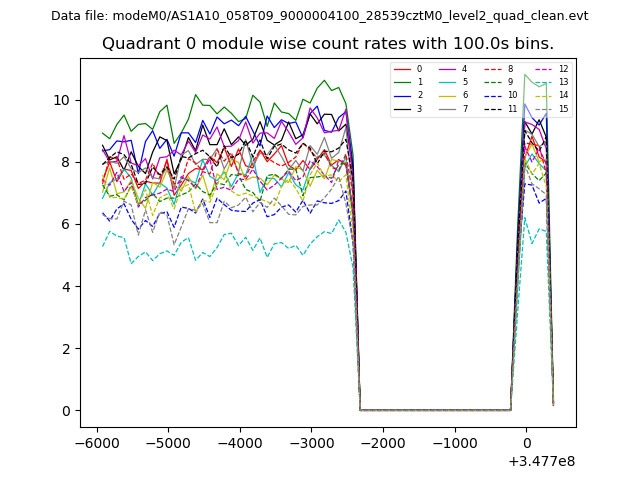 |
 |
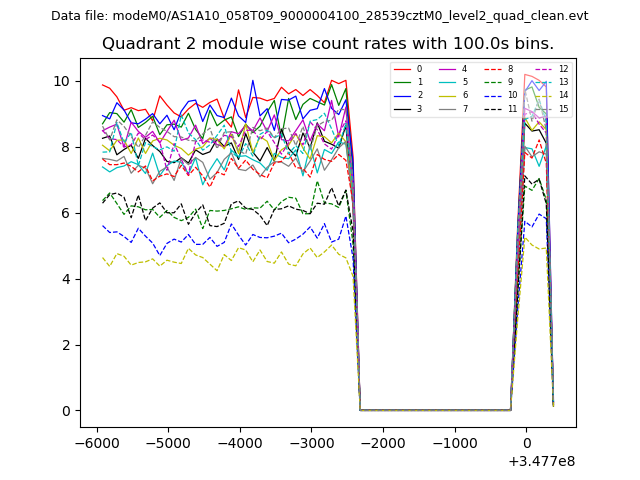
| Module-wise count rates for Quadrant B Data is divided into 100 sec bins |
 |
 |
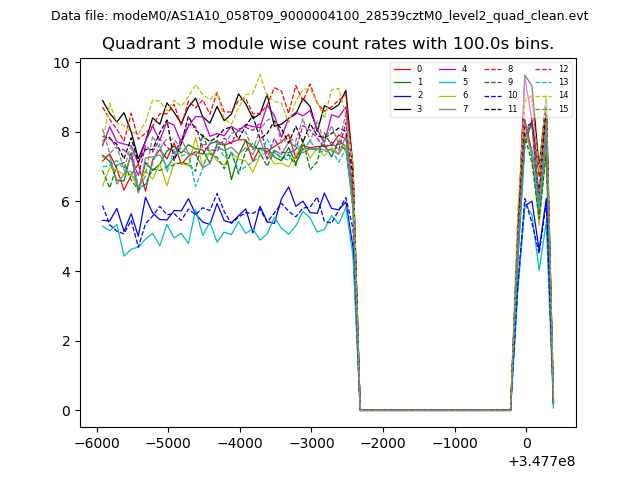
| Module-wise count rates for Quadrant C Data is divided into 100 sec bins |
 |
 |
| Module-wise count rates for Quadrant D Data is divided into 100 sec bins |
 |
 |
| Parameter | Plot |
|---|---|
| CZT HV Monitor | 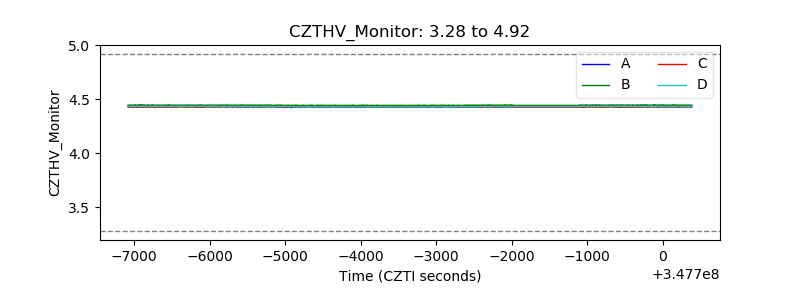 |
| D_VDD | 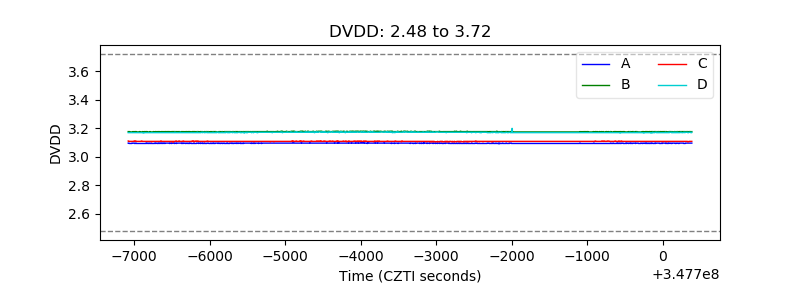 |
| Temperature 1 | 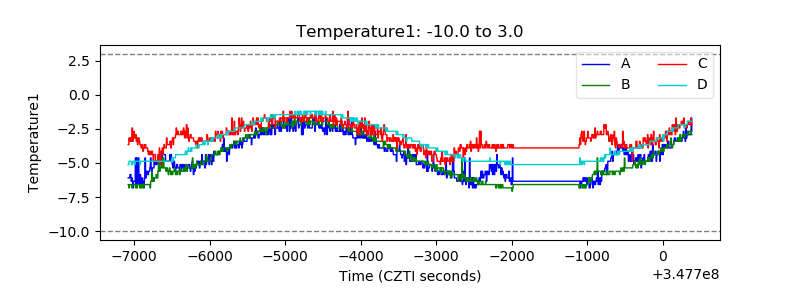 |
| Veto HV Monitor | 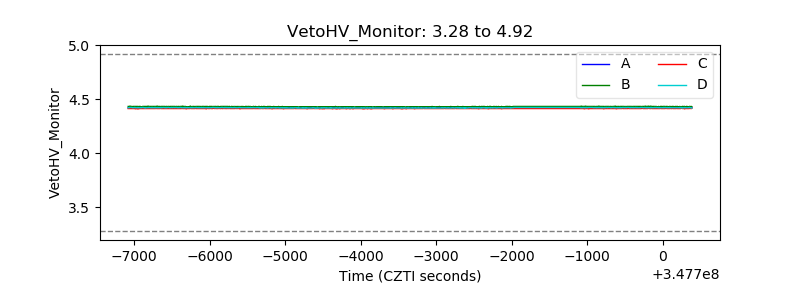 |
| Veto LLD | 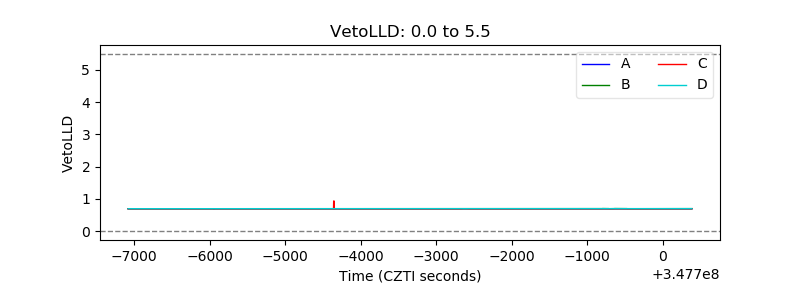 |
| Alpha Counter | 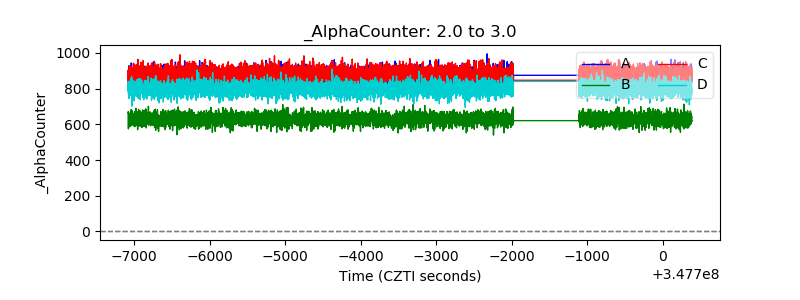 |
| _CPM_Rate | 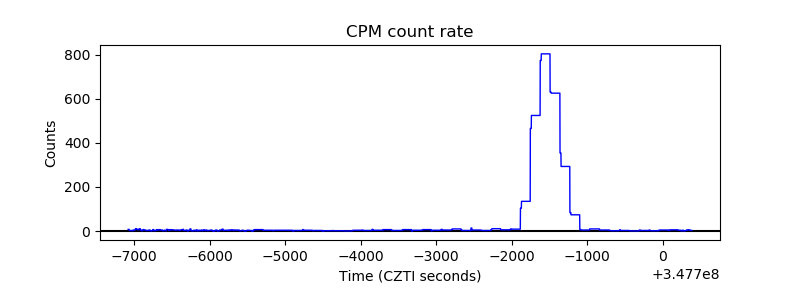 |
| CZT Counter | 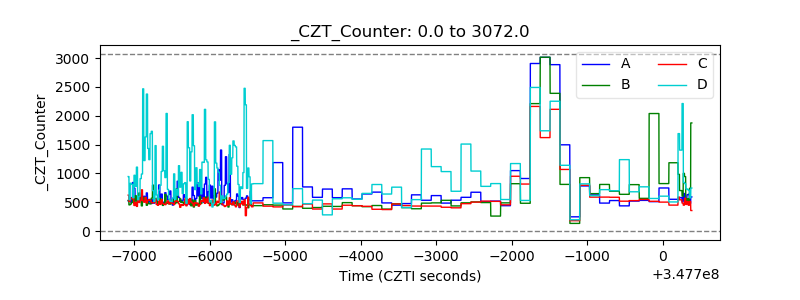 |
| +2.5 Volts monitor |  |
| +5 Volts monitor |  |
| _ROLL_ROT | 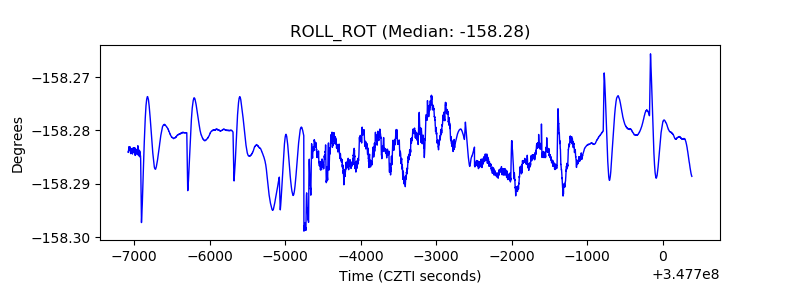 |
| _Roll_DEC | 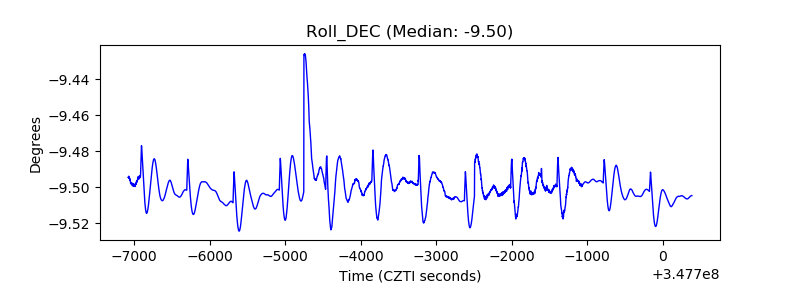 |
| _Roll_RA | 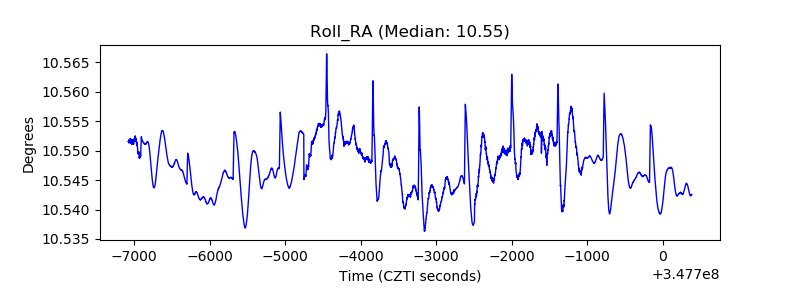 |
| Veto Counter | 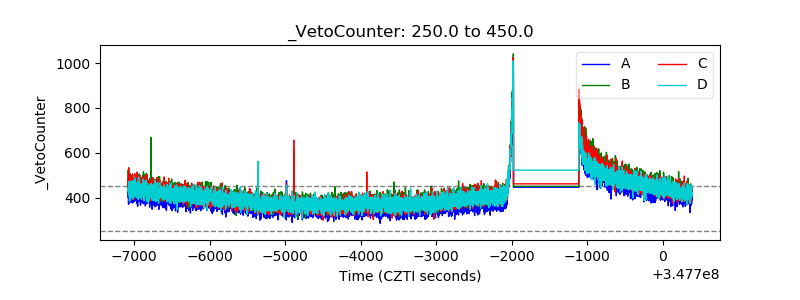 |