| Param | Original file | Final file |
|---|---|---|
| Filename | modeM0/AS1A10_058T09_9000004100_28540cztM0_level2.evt | modeM0/AS1A10_058T09_9000004100_28540cztM0_level2_quad_clean.evt |
| Size (bytes) | 607,795,200 | 88,974,720 |
| Size | 579.6 MB | 84.9 MB |
| Events in quadrant A | 3,501,111 | 580,643 |
| Events in quadrant B | 4,486,831 | 577,388 |
| Events in quadrant C | 3,437,323 | 556,971 |
| Events in quadrant D | 6,533,012 | 516,890 |
| Mode SS | |||
|---|---|---|---|
| Quadrant | BADHDUFLAG | Total packets | Discarded packets |
| A | 0 | 134 | 0 |
| B | 0 | 134 | 0 |
| C | 0 | 134 | 0 |
| D | 0 | 134 | 0 |
| Mode M9 | |||
|---|---|---|---|
| Quadrant | BADHDUFLAG | Total packets | Discarded packets |
| A | 0 | 11 | 0 |
| B | 0 | 11 | 0 |
| C | 0 | 11 | 0 |
| D | 0 | 11 | 0 |
| Mode M0 | |||
|---|---|---|---|
| Quadrant | BADHDUFLAG | Total packets | Discarded packets |
| A | 0 | 14626 | 2 |
| B | 0 | 17724 | 2 |
| C | 0 | 14429 | 2 |
| D | 0 | 24118 | 2 |
| Quadrant | Total seconds | Saturated seconds | Saturation percentage |
|---|---|---|---|
| A | 6631 | 76 | 1.146132% |
| B | 6632 | 471 | 7.101930% |
| C | 6632 | 146 | 2.201448% |
| D | 6632 | 746 | 11.248492% |
Noise dominated data is calculated using 1-second bins in cleaned event files. If a bin has >2000 counts, and if more than 50% of those come from <1% of pixels, then it is considered to be noise-dominated and hence unusable.
| Quadrant | # 1 sec bins | Bins with >0 counts | Bins with >2000 counts | High rate bins dominated by noise | Noise dominated (total time) | Noise dominated (detector-on time) | Marked lightcurve |
|---|---|---|---|---|---|---|---|
| A | 7661 | 6631 | 1 | 1 | 0.01% | 0.02% | 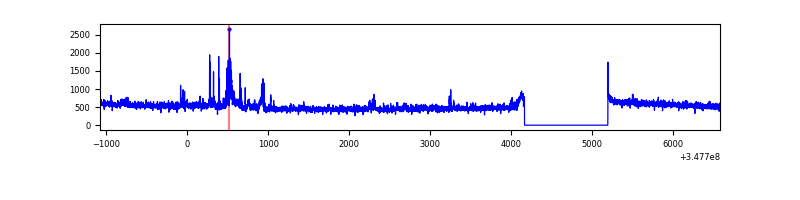 |
| B | 7662 | 6632 | 272 | 272 | 3.55% | 4.10% | 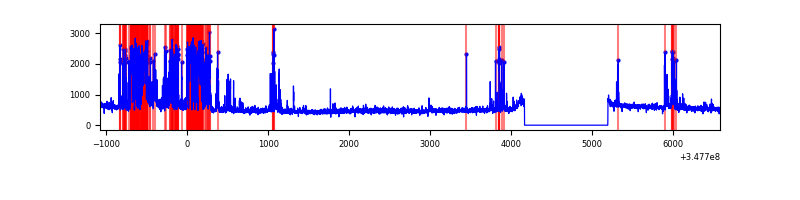 |
| C | 7662 | 6632 | 3 | 3 | 0.04% | 0.05% | 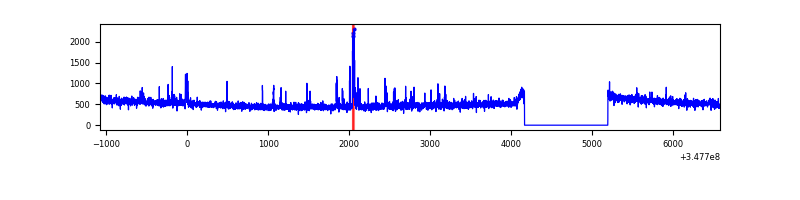 |
| D | 7662 | 6632 | 657 | 657 | 8.57% | 9.91% | 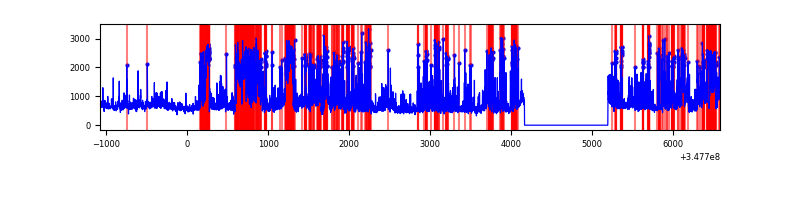 |
Top three noisy pixels from each quadrant. If the there are fewer than three noisy pixels in the level2.evt file, extra rows are filled as -1
| Pixel properties | Quadrant properties | ||||||
|---|---|---|---|---|---|---|---|
| Quadrant | DetID | PixID | Counts | Sigma | Mean | Median | Sigma |
| A | 15 | 174 | 193506 | 1126.75 | 856 | 839 | 171.0 |
| A | 13 | 254 | 12981 | 71.01 | 856 | 839 | 171.0 |
| A | 3 | 137 | 8154 | 42.78 | 856 | 839 | 171.0 |
| B | 10 | 245 | 1171594 | 7466.78 | 827 | 807 | 156.8 |
| B | 0 | 230 | 31035 | 192.78 | 827 | 807 | 156.8 |
| B | 12 | 111 | 19465 | 118.99 | 827 | 807 | 156.8 |
| C | 14 | 238 | 147819 | 778.9 | 808 | 813 | 188.7 |
| C | 7 | 247 | 105933 | 556.97 | 808 | 813 | 188.7 |
| C | 14 | 254 | 24717 | 126.65 | 808 | 813 | 188.7 |
| D | 1 | 52 | 2658305 | 13832.37 | 798 | 778 | 192.1 |
| D | 8 | 195 | 730017 | 3795.67 | 798 | 778 | 192.1 |
| D | 2 | 250 | 38962 | 198.75 | 798 | 778 | 192.1 |
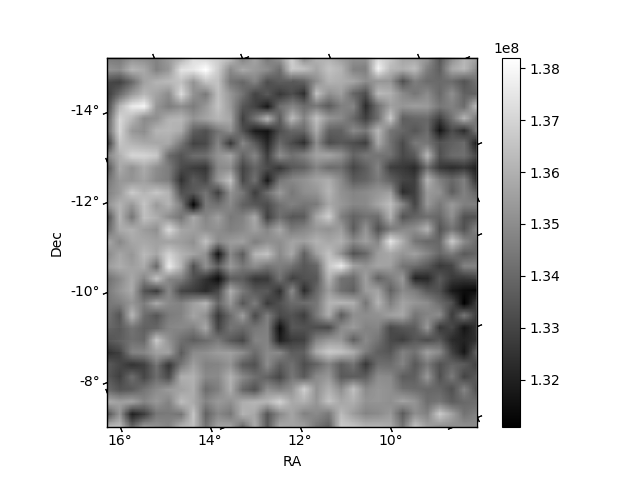
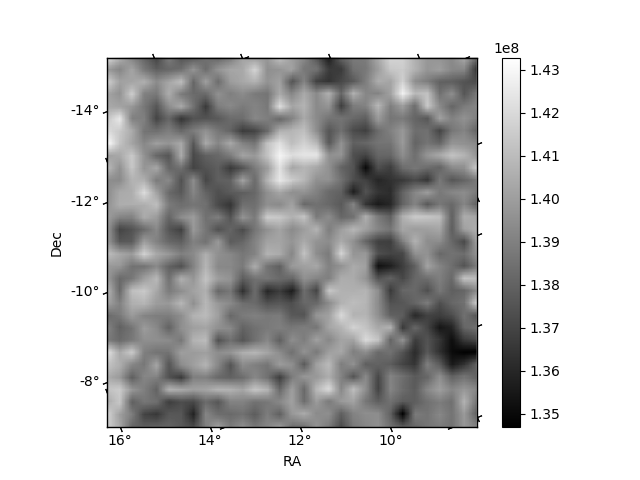
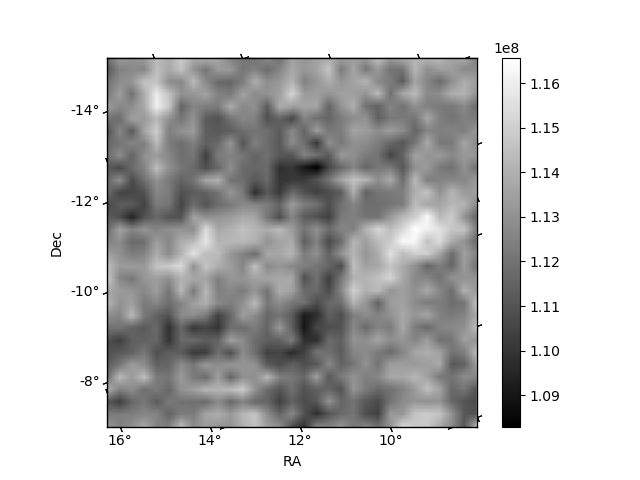
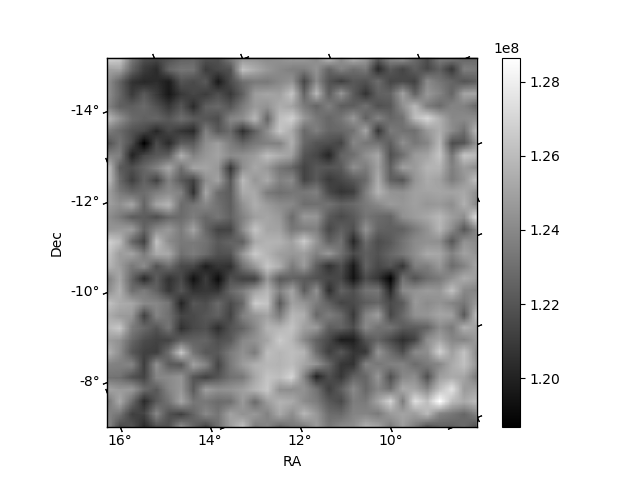
Histogram calculated using DETX and DETY for each event in the final _common_clean file
| Quadrant A |  |
 |
Quadrant B |
|---|---|---|---|
| Quadrant D |  |
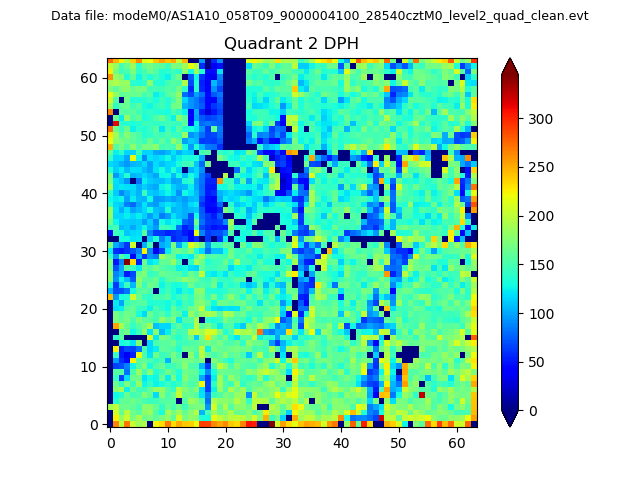 |
Quadrant C |
| Plot type | Count rate plots | Images |
|---|---|---|
| Comparison with Poisson distribution Blue bars denote a histogram of data divided into 1 sec bins. Red curve is a Poisson curve with rate = median count rate of data. |
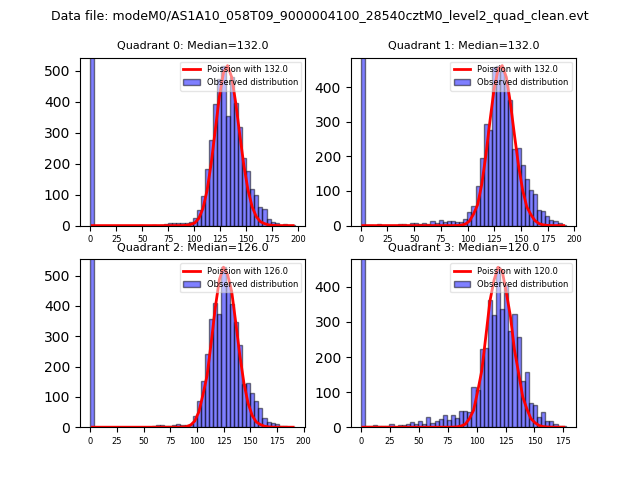 |
 |
| Quadrant-wise count rates Data is divided into 100 sec bins |
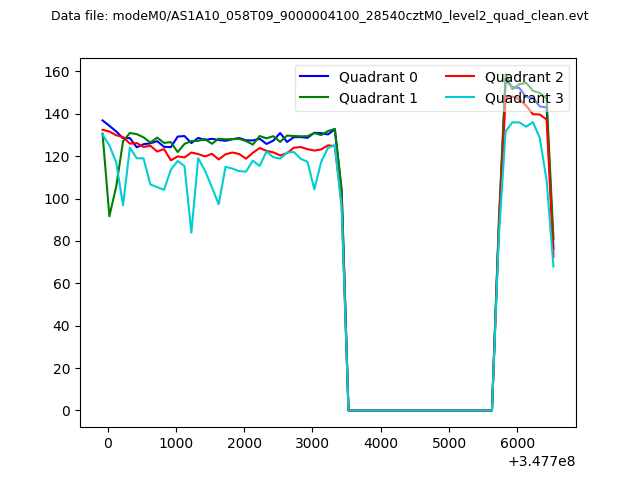 |
|
| Module-wise count rates for Quadrant A Data is divided into 100 sec bins |
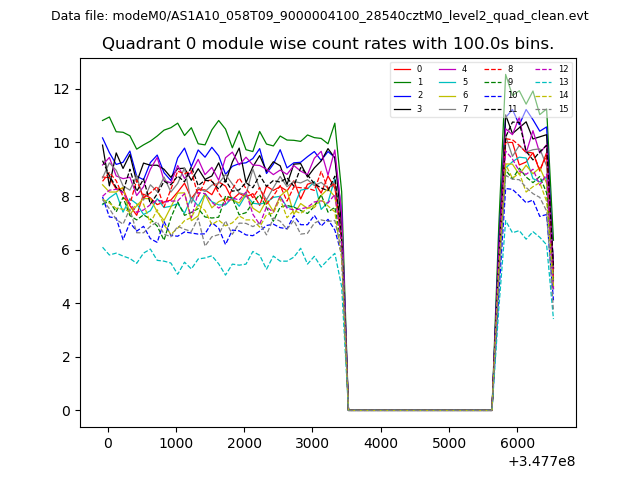 |
 |
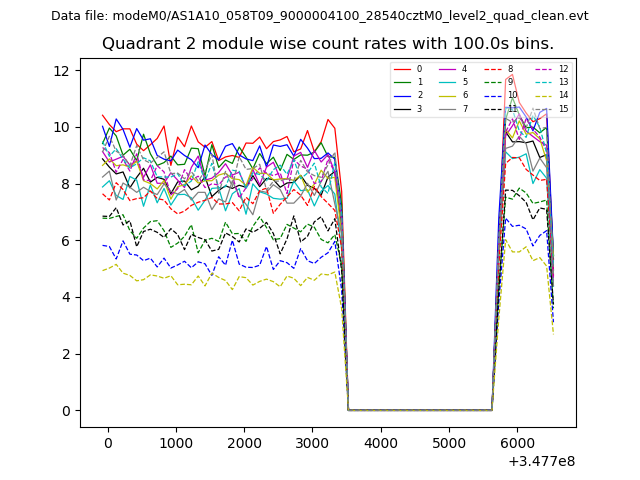
| Module-wise count rates for Quadrant B Data is divided into 100 sec bins |
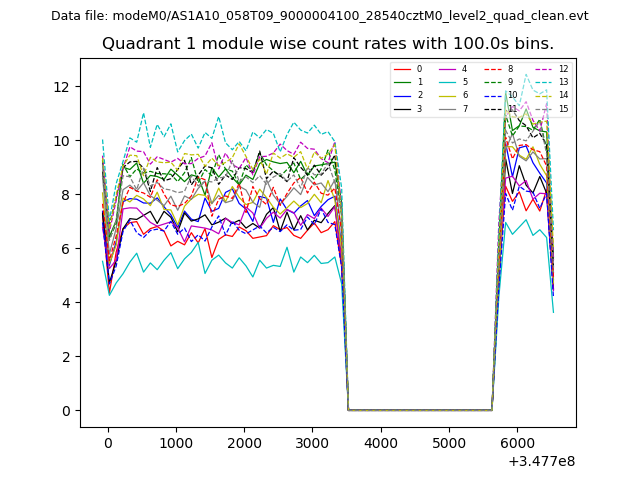 |
 |
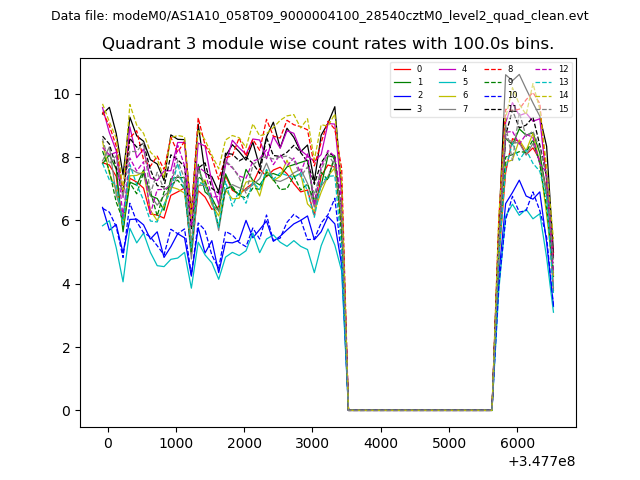
| Module-wise count rates for Quadrant C Data is divided into 100 sec bins |
 |
 |
| Module-wise count rates for Quadrant D Data is divided into 100 sec bins |
 |
 |
| Parameter | Plot |
|---|---|
| CZT HV Monitor | 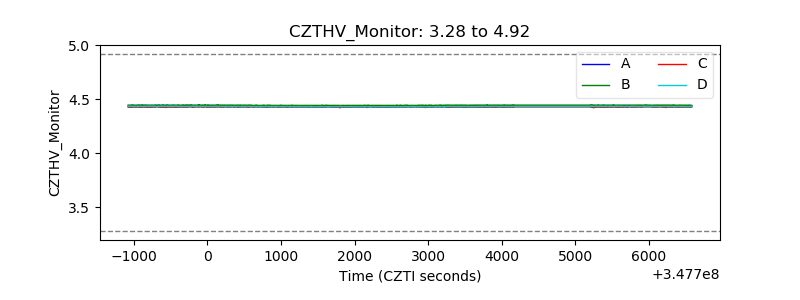 |
| D_VDD | 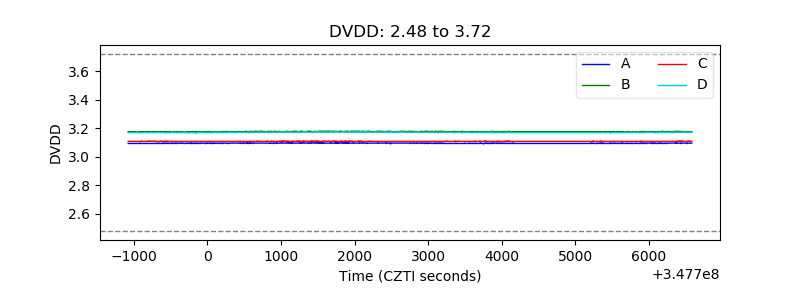 |
| Temperature 1 | 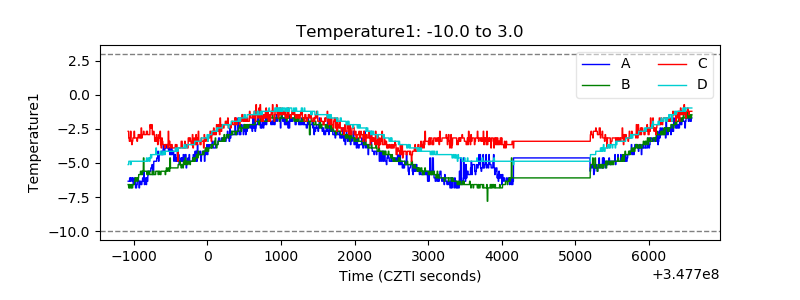 |
| Veto HV Monitor | 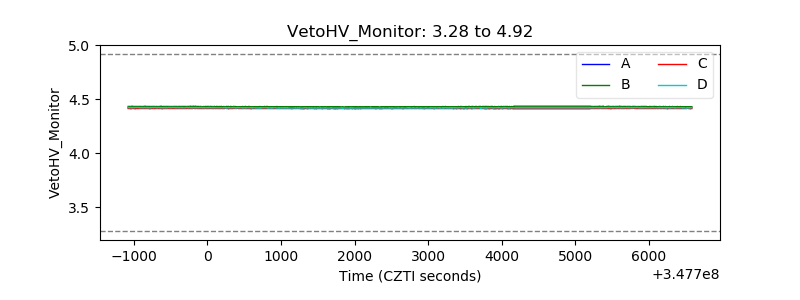 |
| Veto LLD |  |
| Alpha Counter | 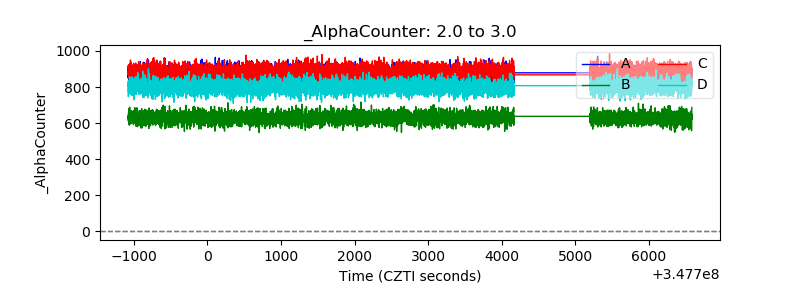 |
| _CPM_Rate | 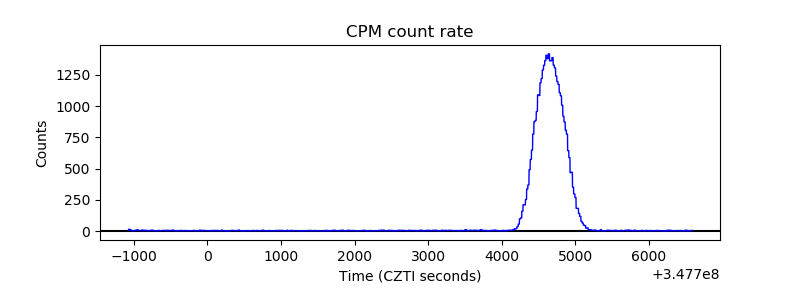 |
| CZT Counter | 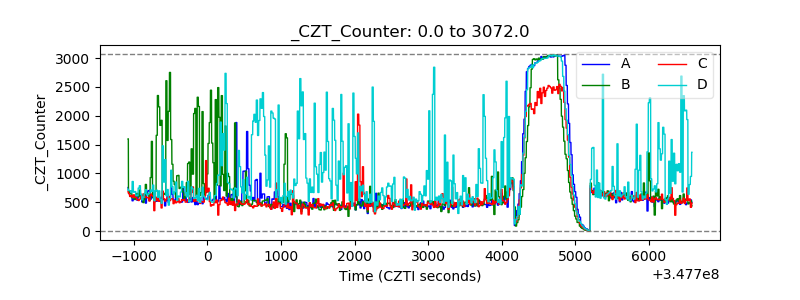 |
| +2.5 Volts monitor |  |
| +5 Volts monitor | 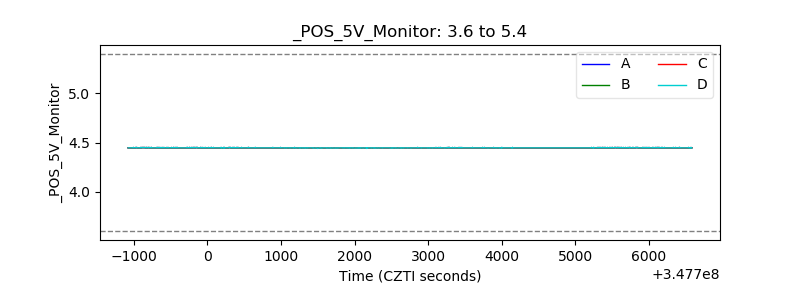 |
| _ROLL_ROT | 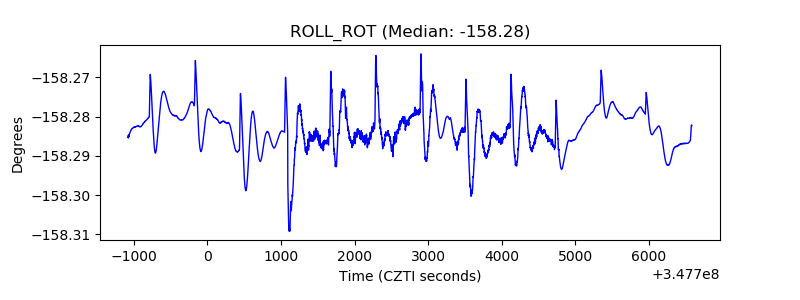 |
| _Roll_DEC | 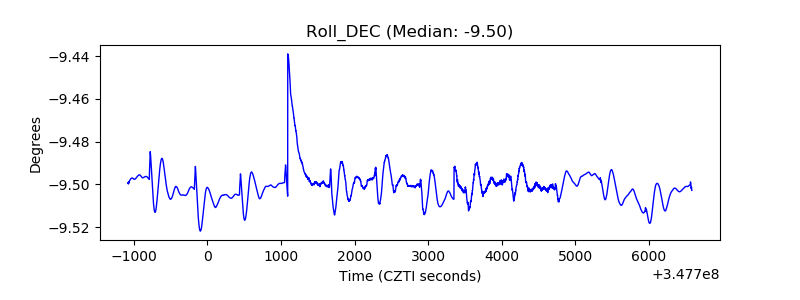 |
| _Roll_RA | 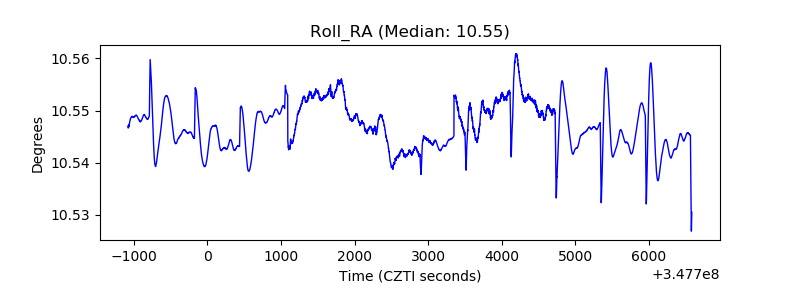 |
| Veto Counter | 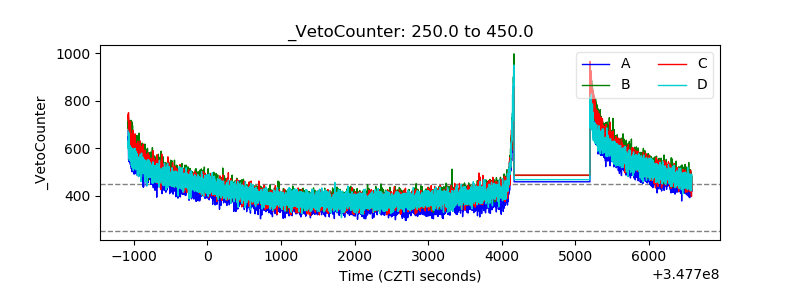 |