| Param | Original file | Final file |
|---|---|---|
| Filename | modeM0/AS1A10_058T09_9000004100_28542cztM0_level2.evt | modeM0/AS1A10_058T09_9000004100_28542cztM0_level2_quad_clean.evt |
| Size (bytes) | 575,196,480 | 102,885,120 |
| Size | 548.6 MB | 98.1 MB |
| Events in quadrant A | 3,567,604 | 692,276 |
| Events in quadrant B | 3,620,306 | 697,281 |
| Events in quadrant C | 3,372,258 | 655,958 |
| Events in quadrant D | 6,421,440 | 618,731 |
| Mode SS | |||
|---|---|---|---|
| Quadrant | BADHDUFLAG | Total packets | Discarded packets |
| A | 0 | 132 | 0 |
| B | 0 | 132 | 0 |
| C | 0 | 132 | 0 |
| D | 0 | 132 | 0 |
| Mode M9 | |||
|---|---|---|---|
| Quadrant | BADHDUFLAG | Total packets | Discarded packets |
| A | 0 | 11 | 0 |
| B | 0 | 11 | 0 |
| C | 0 | 11 | 0 |
| D | 0 | 11 | 0 |
| Mode M0 | |||
|---|---|---|---|
| Quadrant | BADHDUFLAG | Total packets | Discarded packets |
| A | 0 | 14883 | 2 |
| B | 0 | 15068 | 2 |
| C | 0 | 14260 | 2 |
| D | 0 | 23620 | 2 |
| Quadrant | Total seconds | Saturated seconds | Saturation percentage |
|---|---|---|---|
| A | 6471 | 102 | 1.576263% |
| B | 6471 | 155 | 2.395302% |
| C | 6472 | 111 | 1.715080% |
| D | 6472 | 674 | 10.414091% |
Noise dominated data is calculated using 1-second bins in cleaned event files. If a bin has >2000 counts, and if more than 50% of those come from <1% of pixels, then it is considered to be noise-dominated and hence unusable.
| Quadrant | # 1 sec bins | Bins with >0 counts | Bins with >2000 counts | High rate bins dominated by noise | Noise dominated (total time) | Noise dominated (detector-on time) | Marked lightcurve |
|---|---|---|---|---|---|---|---|
| A | 7606 | 6471 | 22 | 22 | 0.29% | 0.34% | 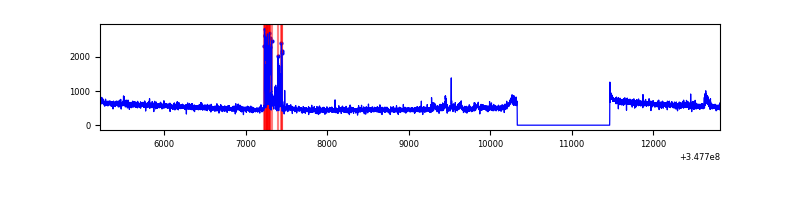 |
| B | 7606 | 6471 | 54 | 54 | 0.71% | 0.83% | 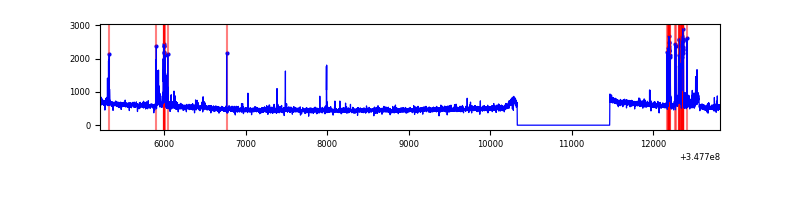 |
| C | 7607 | 6472 | 0 | 0 | 0.00% | 0.00% | 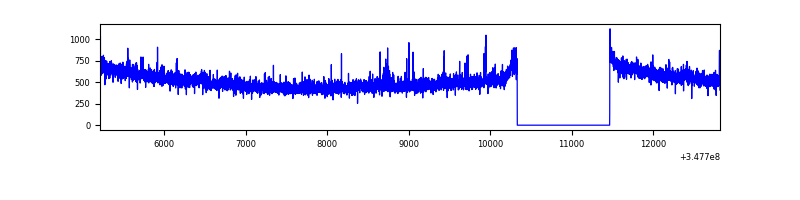 |
| D | 7607 | 6472 | 558 | 558 | 7.34% | 8.62% | 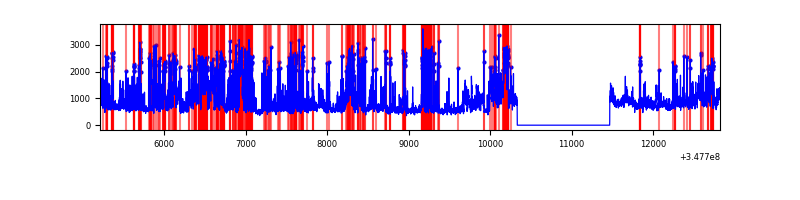 |
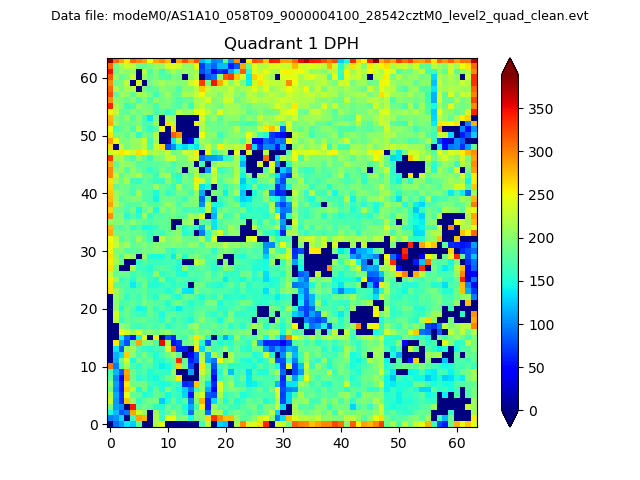
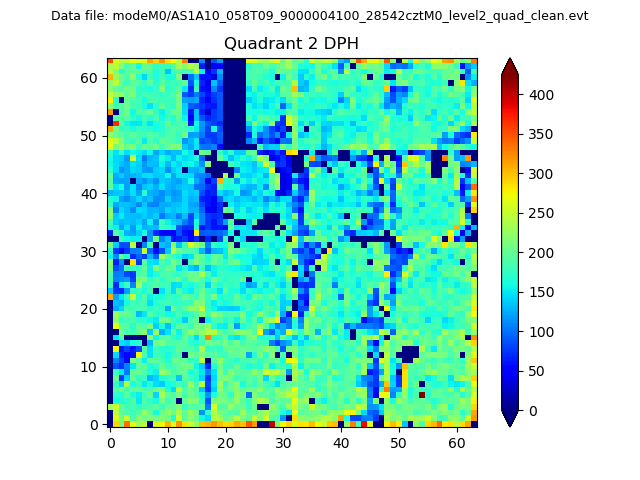
Top three noisy pixels from each quadrant. If the there are fewer than three noisy pixels in the level2.evt file, extra rows are filled as -1
| Pixel properties | Quadrant properties | ||||||
|---|---|---|---|---|---|---|---|
| Quadrant | DetID | PixID | Counts | Sigma | Mean | Median | Sigma |
| A | 15 | 174 | 211350 | 1211.97 | 870 | 853 | 173.7 |
| A | 13 | 254 | 12005 | 64.21 | 870 | 853 | 173.7 |
| A | 3 | 137 | 7953 | 40.88 | 870 | 853 | 173.7 |
| B | 10 | 245 | 203622 | 1254.81 | 852 | 833 | 161.6 |
| B | 4 | 80 | 46904 | 285.08 | 852 | 833 | 161.6 |
| B | 12 | 111 | 19397 | 114.87 | 852 | 833 | 161.6 |
| C | 14 | 238 | 139128 | 732.32 | 812 | 821 | 188.9 |
| C | 7 | 247 | 32114 | 165.69 | 812 | 821 | 188.9 |
| C | 3 | 233 | 14308 | 71.41 | 812 | 821 | 188.9 |
| D | 1 | 52 | 2802266 | 14619.84 | 802 | 781 | 191.6 |
| D | 8 | 195 | 373606 | 1945.63 | 802 | 781 | 191.6 |
| D | 10 | 199 | 48122 | 247.05 | 802 | 781 | 191.6 |
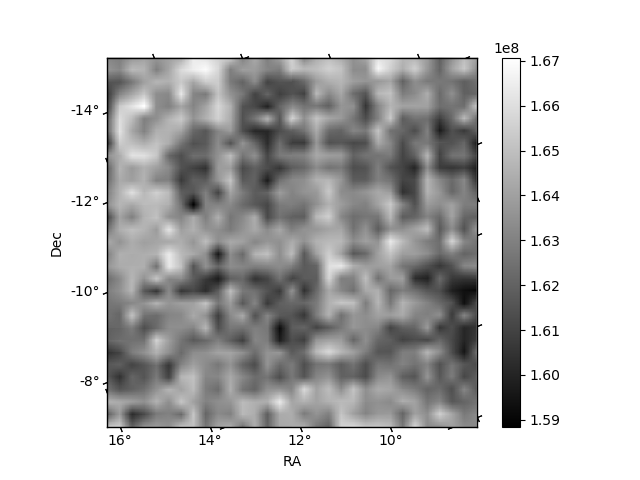
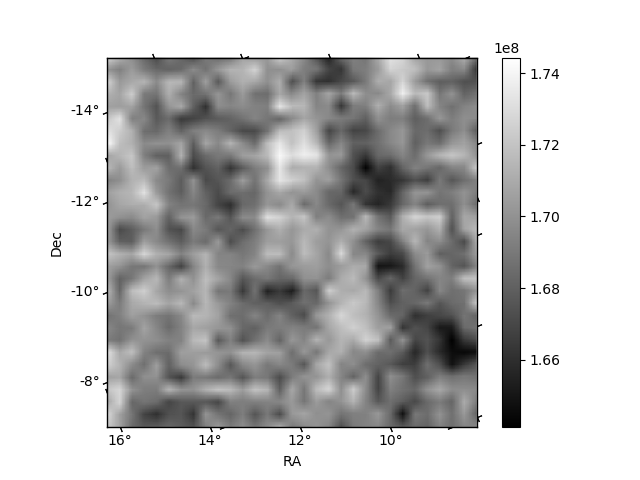
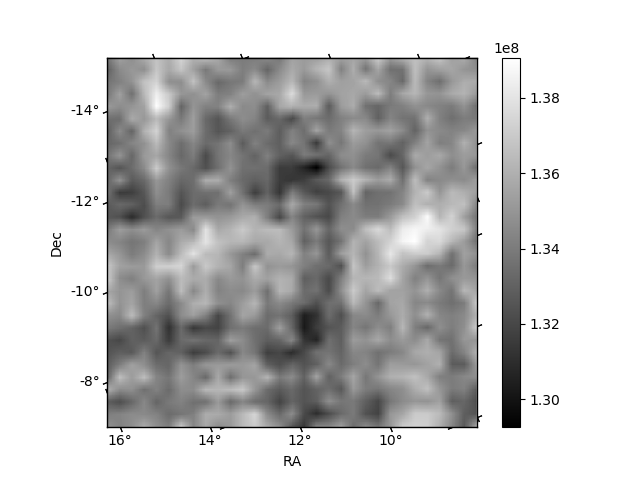
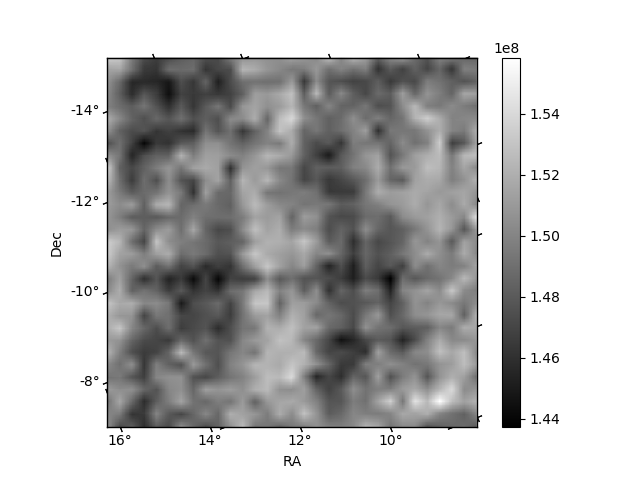
Histogram calculated using DETX and DETY for each event in the final _common_clean file
| Quadrant A | 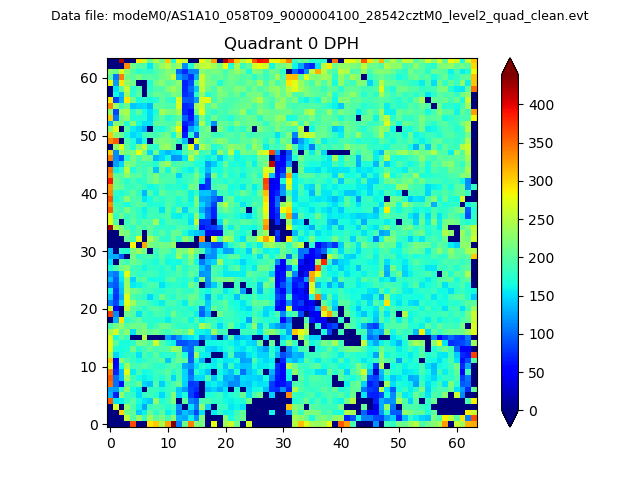 |
 |
Quadrant B |
|---|---|---|---|
| Quadrant D | 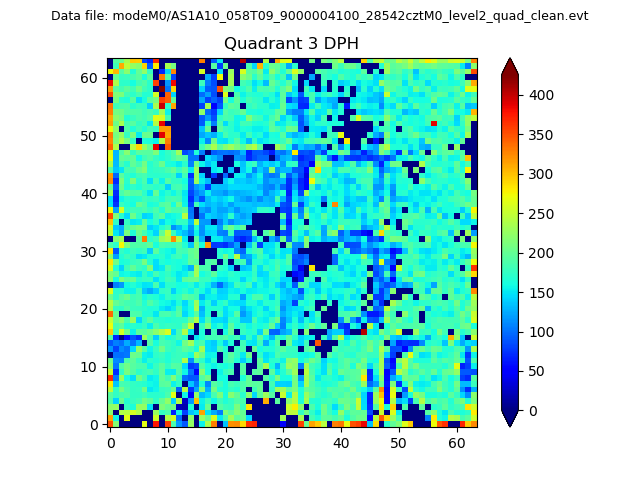 |
 |
Quadrant C |
| Plot type | Count rate plots | Images |
|---|---|---|
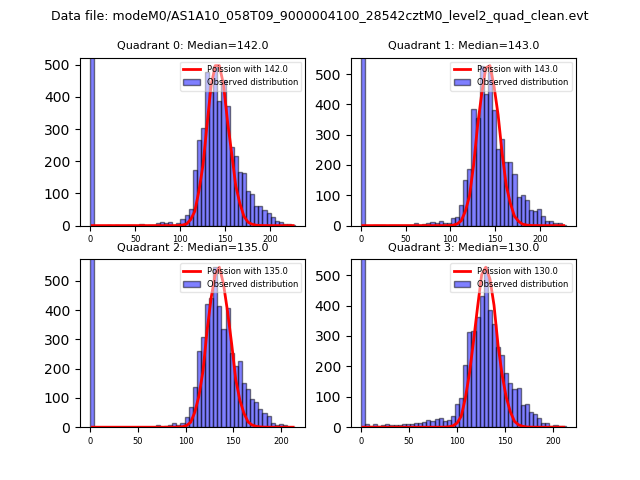
| Comparison with Poisson distribution Blue bars denote a histogram of data divided into 1 sec bins. Red curve is a Poisson curve with rate = median count rate of data. |
 |
 |
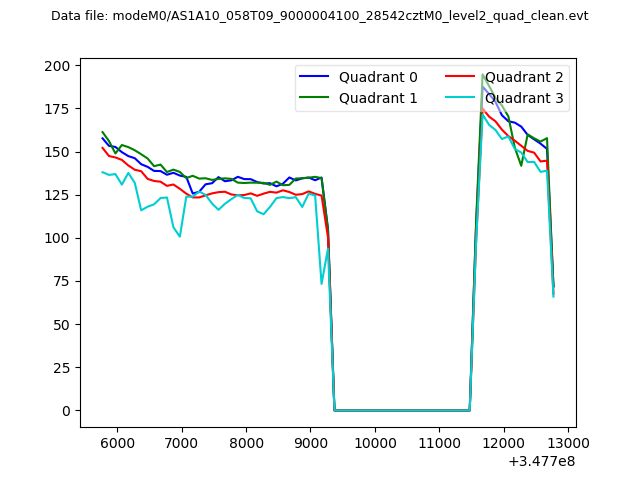
| Quadrant-wise count rates Data is divided into 100 sec bins |
 |
|
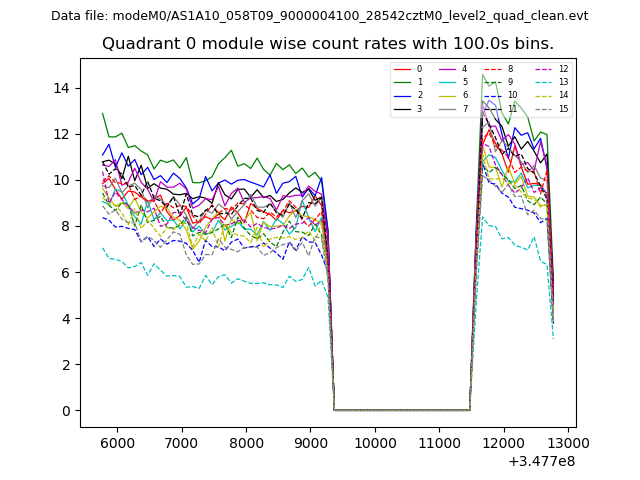
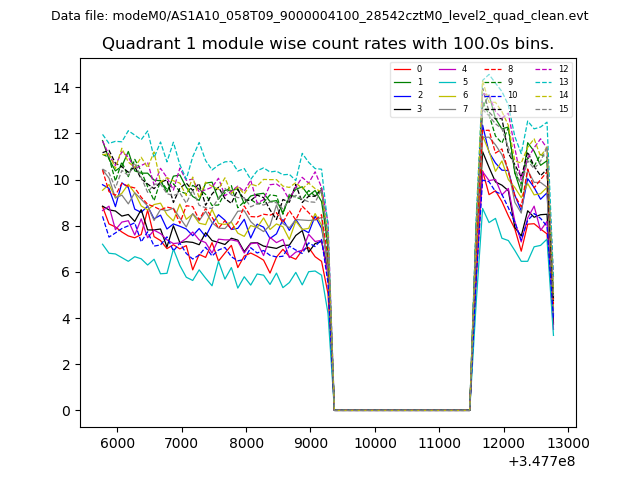
| Module-wise count rates for Quadrant A Data is divided into 100 sec bins |
 |
 |
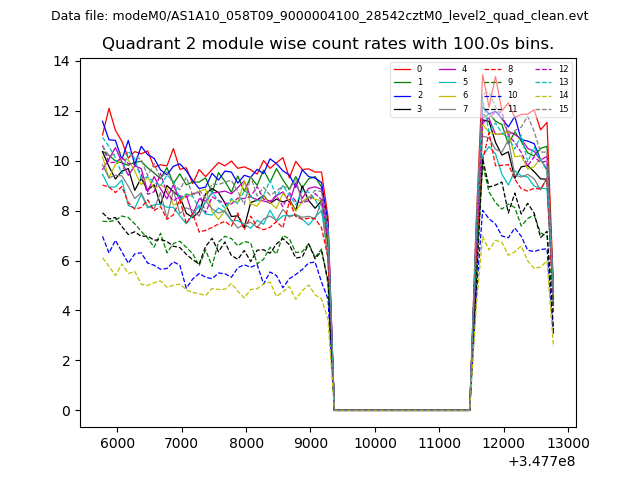
| Module-wise count rates for Quadrant B Data is divided into 100 sec bins |
 |
 |
| Module-wise count rates for Quadrant C Data is divided into 100 sec bins |
 |
 |
| Module-wise count rates for Quadrant D Data is divided into 100 sec bins |
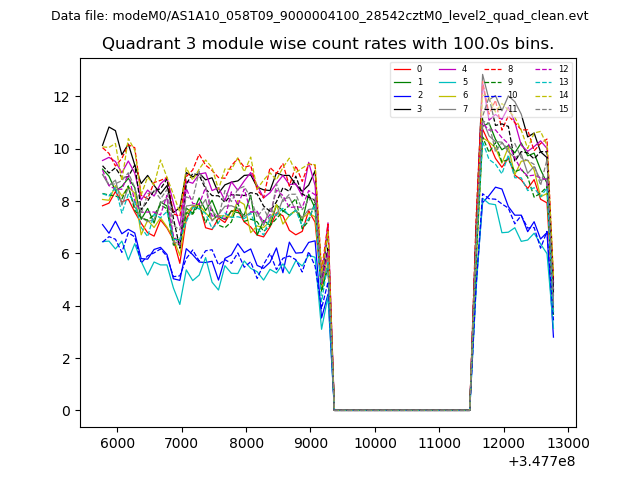 |
 |
| Parameter | Plot |
|---|---|
| CZT HV Monitor | 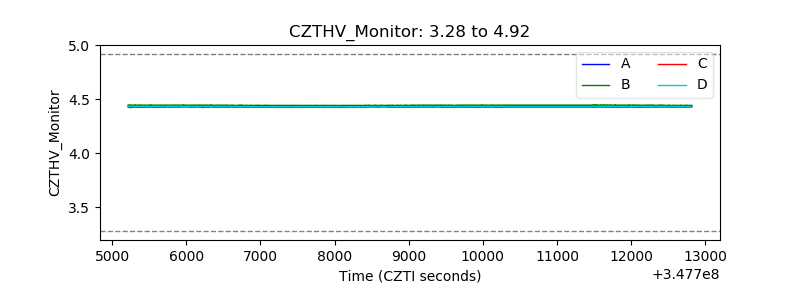 |
| D_VDD | 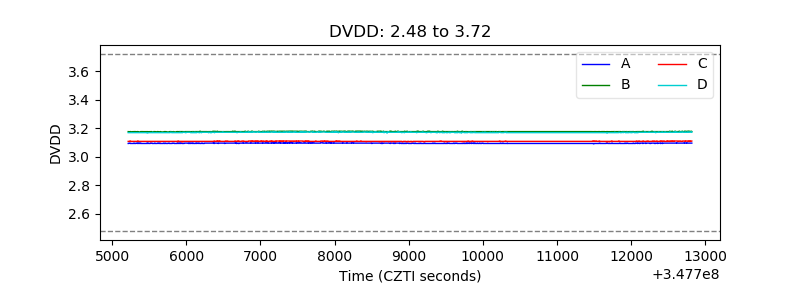 |
| Temperature 1 | 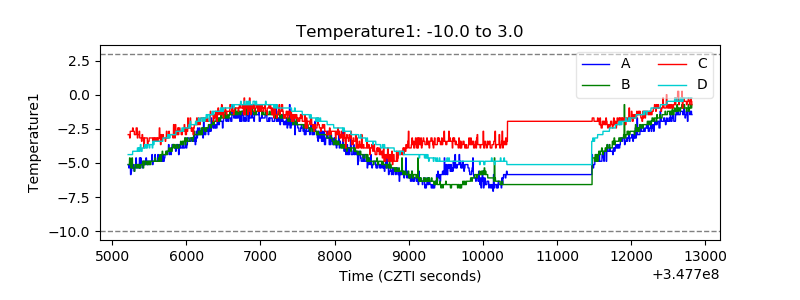 |
| Veto HV Monitor |  |
| Veto LLD | 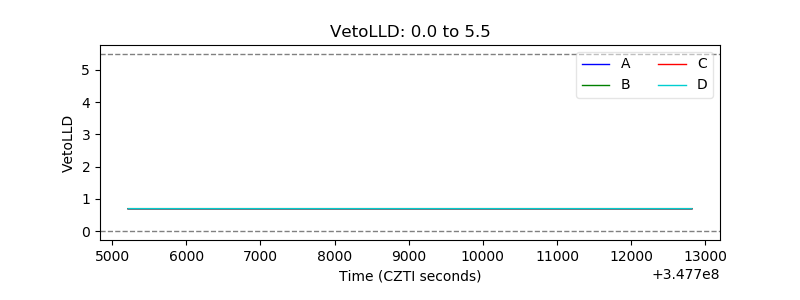 |
| Alpha Counter | 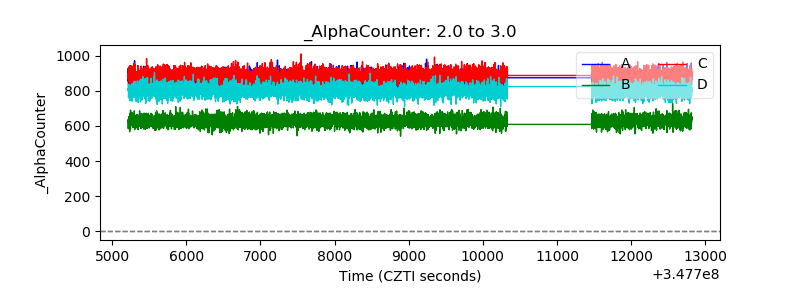 |
| _CPM_Rate | 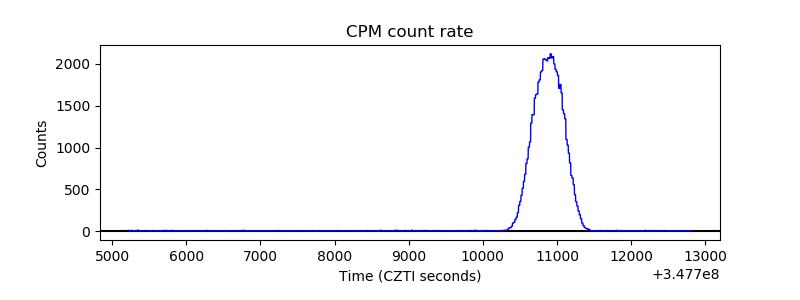 |
| CZT Counter | 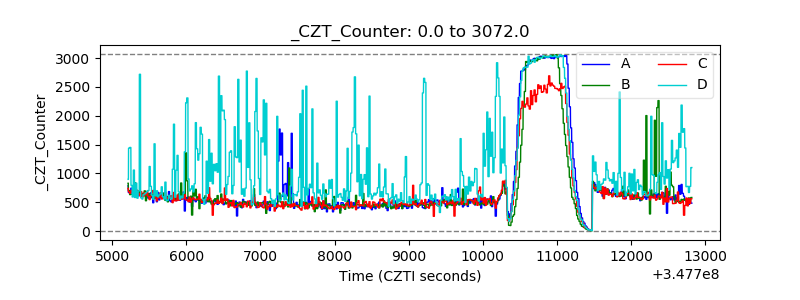 |
| +2.5 Volts monitor |  |
| +5 Volts monitor |  |
| _ROLL_ROT | 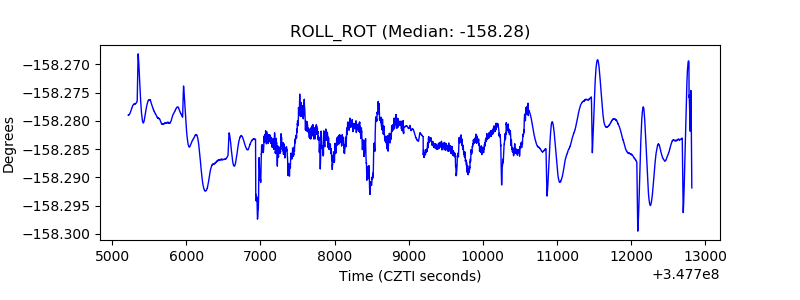 |
| _Roll_DEC | 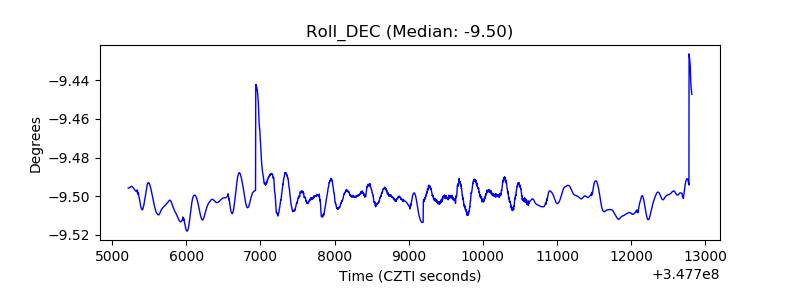 |
| _Roll_RA | 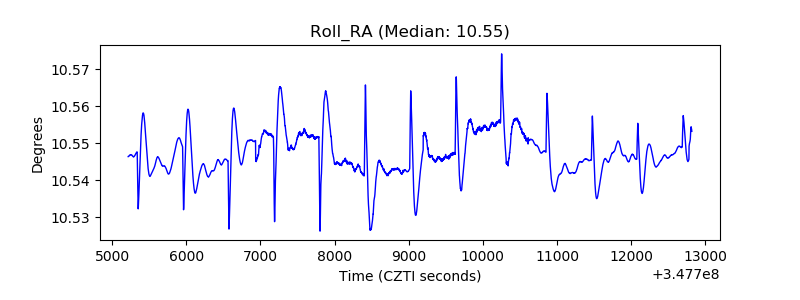 |
| Veto Counter | 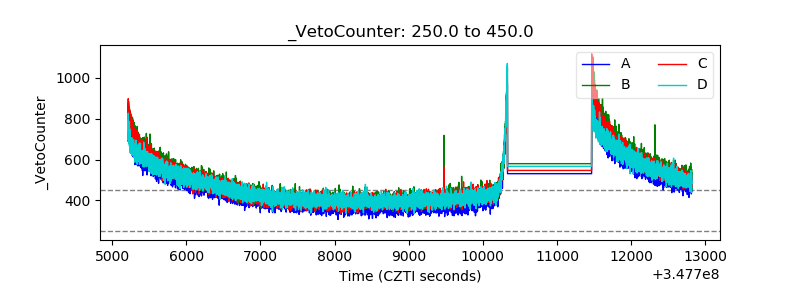 |