| Param | Original file | Final file |
|---|---|---|
| Filename | modeM0/AS1A10_058T09_9000004100_28543cztM0_level2.evt | modeM0/AS1A10_058T09_9000004100_28543cztM0_level2_quad_clean.evt |
| Size (bytes) | 213,888,960 | 49,371,840 |
| Size | 204.0 MB | 47.1 MB |
| Events in quadrant A | 1,417,457 | 340,110 |
| Events in quadrant B | 1,340,183 | 345,654 |
| Events in quadrant C | 1,150,050 | 327,267 |
| Events in quadrant D | 2,409,197 | 313,174 |
| Mode SS | |||
|---|---|---|---|
| Quadrant | BADHDUFLAG | Total packets | Discarded packets |
| A | 0 | 46 | 0 |
| B | 0 | 46 | 0 |
| C | 0 | 46 | 0 |
| D | 0 | 46 | 0 |
| Mode M0 | |||
|---|---|---|---|
| Quadrant | BADHDUFLAG | Total packets | Discarded packets |
| A | 0 | 5710 | 0 |
| B | 0 | 5444 | 0 |
| C | 0 | 4864 | 0 |
| D | 0 | 8857 | 0 |
| Quadrant | Total seconds | Saturated seconds | Saturation percentage |
|---|---|---|---|
| A | 2343 | 93 | 3.969270% |
| B | 2344 | 57 | 2.431741% |
| C | 2344 | 4 | 0.170648% |
| D | 2344 | 151 | 6.441980% |
Noise dominated data is calculated using 1-second bins in cleaned event files. If a bin has >2000 counts, and if more than 50% of those come from <1% of pixels, then it is considered to be noise-dominated and hence unusable.
| Quadrant | # 1 sec bins | Bins with >0 counts | Bins with >2000 counts | High rate bins dominated by noise | Noise dominated (total time) | Noise dominated (detector-on time) | Marked lightcurve |
|---|---|---|---|---|---|---|---|
| A | 2343 | 2343 | 64 | 64 | 2.73% | 2.73% |  |
| B | 2344 | 2344 | 44 | 44 | 1.88% | 1.88% |  |
| C | 2344 | 2344 | 0 | 0 | 0.00% | 0.00% |  |
| D | 2344 | 2344 | 172 | 172 | 7.34% | 7.34% |  |
Top three noisy pixels from each quadrant. If the there are fewer than three noisy pixels in the level2.evt file, extra rows are filled as -1
| Pixel properties | Quadrant properties | ||||||
|---|---|---|---|---|---|---|---|
| Quadrant | DetID | PixID | Counts | Sigma | Mean | Median | Sigma |
| A | 15 | 174 | 274105 | 4477.36 | 296 | 291 | 61.2 |
| A | 13 | 254 | 4365 | 66.62 | 296 | 291 | 61.2 |
| A | 0 | 226 | 2581 | 37.45 | 296 | 291 | 61.2 |
| B | 10 | 245 | 122482 | 2154.65 | 291 | 286 | 56.7 |
| B | 4 | 80 | 44528 | 780.11 | 291 | 286 | 56.7 |
| B | 4 | 187 | 8445 | 143.87 | 291 | 286 | 56.7 |
| C | 14 | 238 | 47263 | 713.32 | 277 | 280 | 65.9 |
| C | 4 | 254 | 10170 | 150.16 | 277 | 280 | 65.9 |
| C | 3 | 233 | 7332 | 107.07 | 277 | 280 | 65.9 |
| D | 1 | 52 | 963205 | 14215.46 | 280 | 274 | 67.7 |
| D | 8 | 195 | 303188 | 4471.83 | 280 | 274 | 67.7 |
| D | 2 | 250 | 21689 | 316.14 | 280 | 274 | 67.7 |
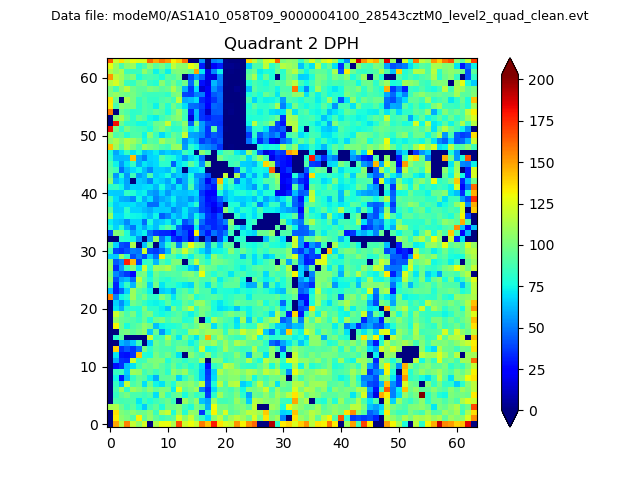
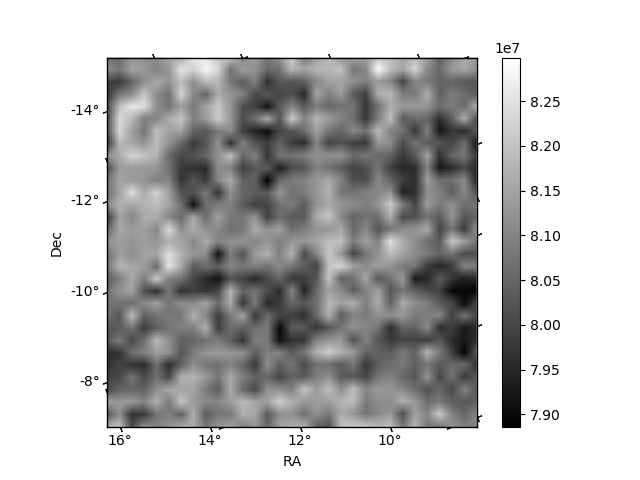
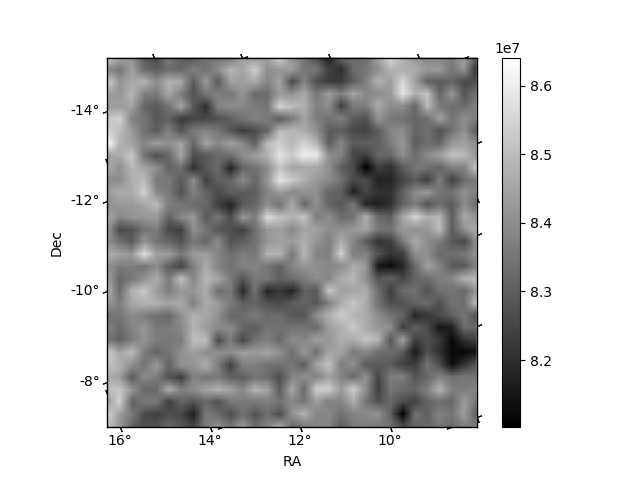
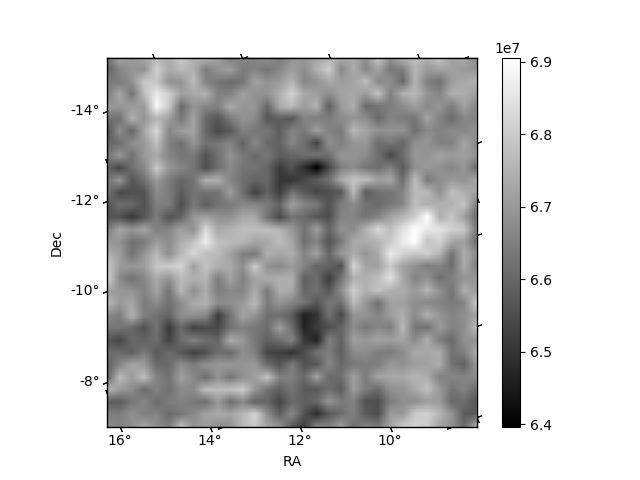
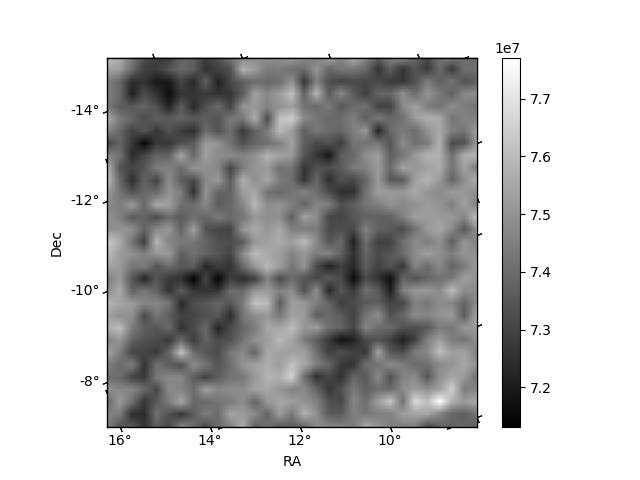
Histogram calculated using DETX and DETY for each event in the final _common_clean file
| Quadrant A | 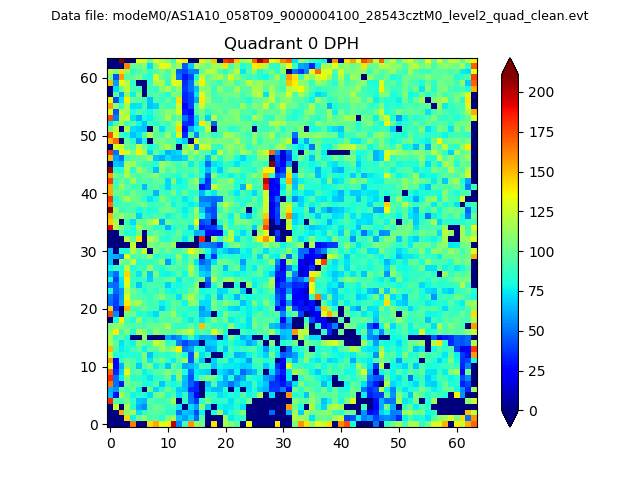 |
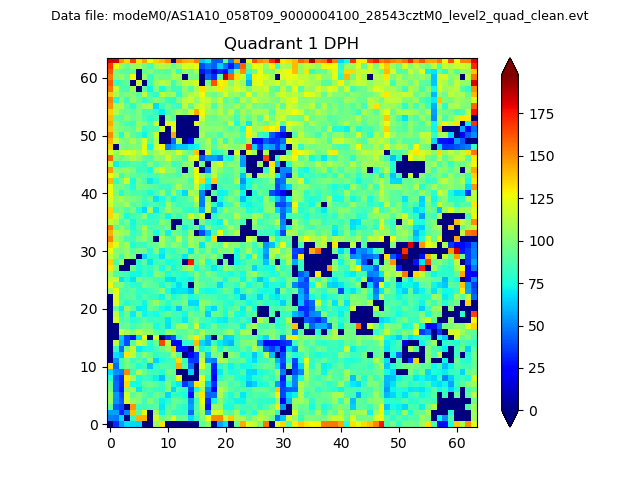 |
Quadrant B |
|---|---|---|---|
| Quadrant D | 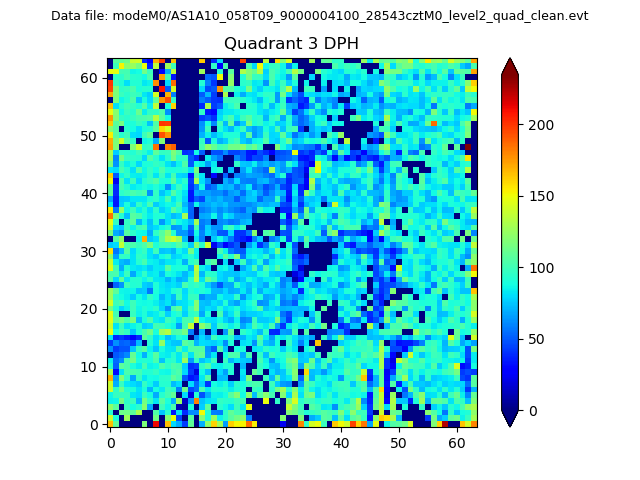 |
 |
Quadrant C |
| Plot type | Count rate plots | Images |
|---|---|---|
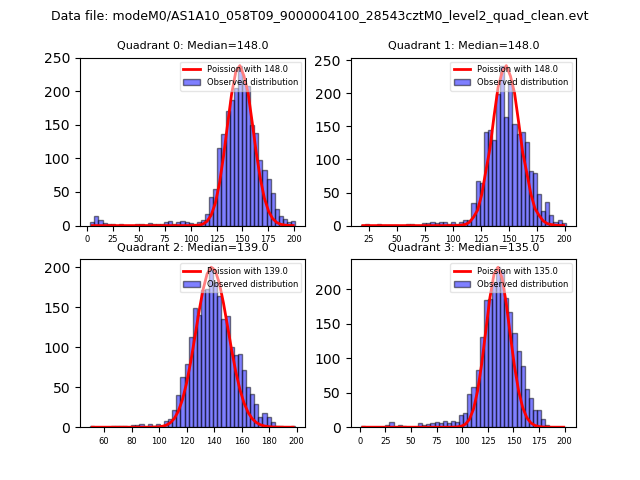
| Comparison with Poisson distribution Blue bars denote a histogram of data divided into 1 sec bins. Red curve is a Poisson curve with rate = median count rate of data. |
 |
 |
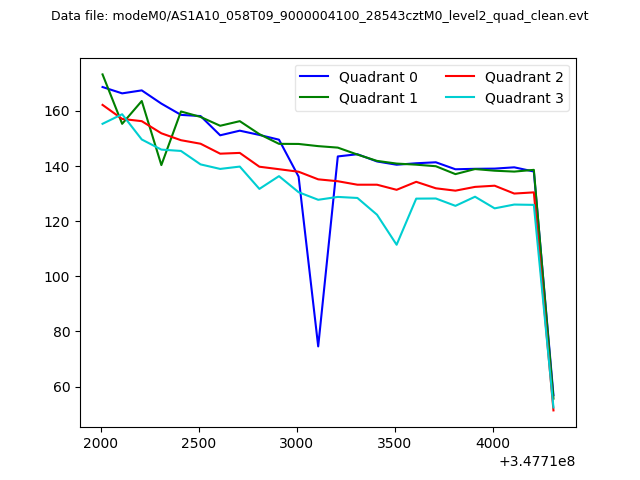
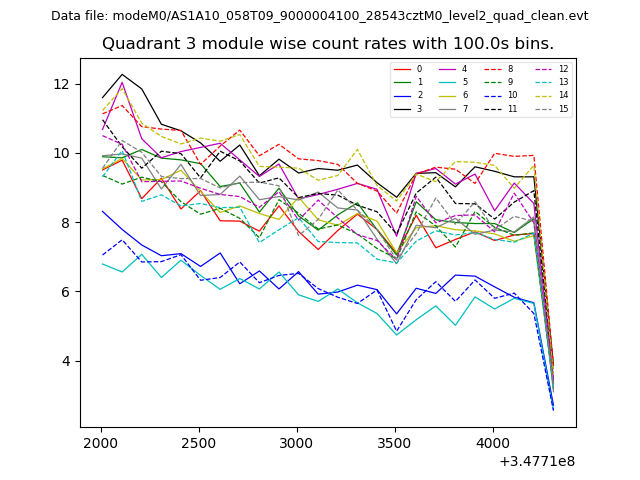
| Quadrant-wise count rates Data is divided into 100 sec bins |
 |
|
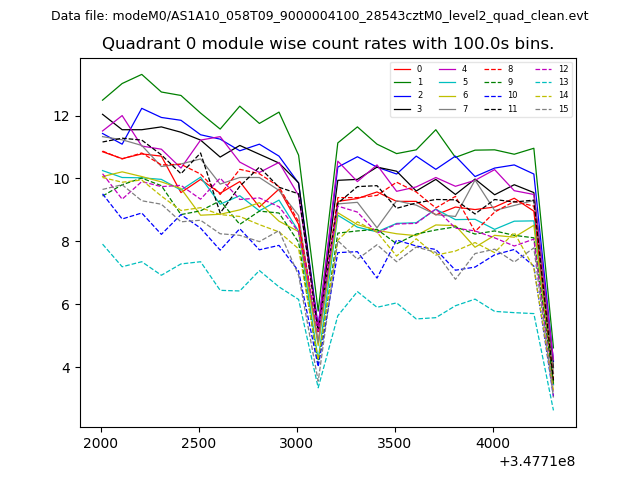
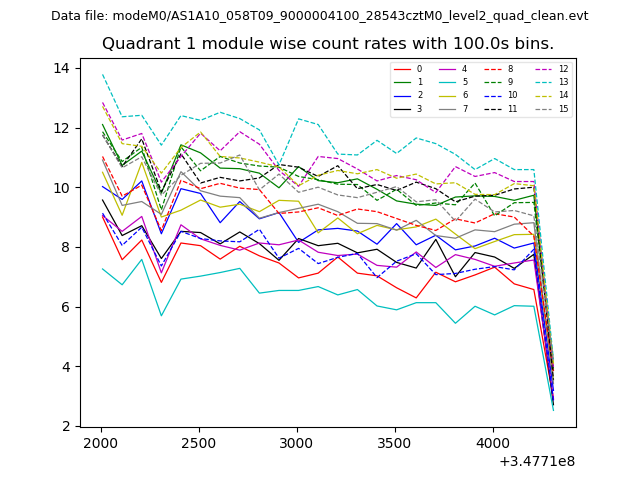
| Module-wise count rates for Quadrant A Data is divided into 100 sec bins |
 |
 |
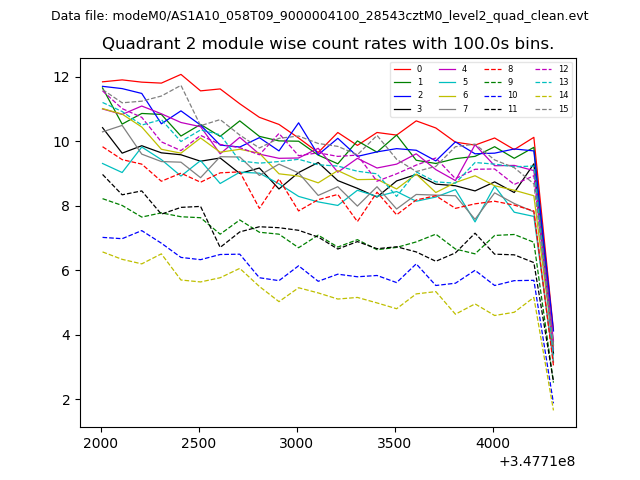
| Module-wise count rates for Quadrant B Data is divided into 100 sec bins |
 |
 |
| Module-wise count rates for Quadrant C Data is divided into 100 sec bins |
 |
 |
| Module-wise count rates for Quadrant D Data is divided into 100 sec bins |
 |
 |
| Parameter | Plot |
|---|---|
| CZT HV Monitor | 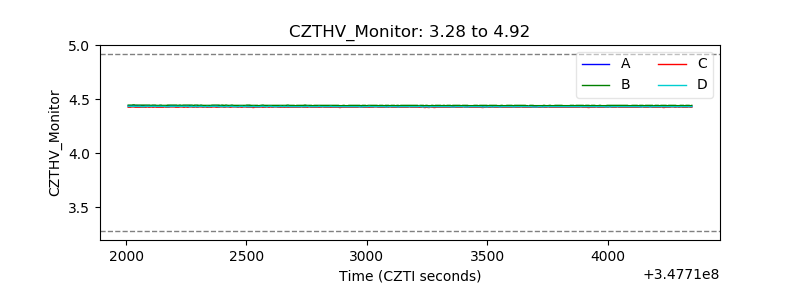 |
| D_VDD | 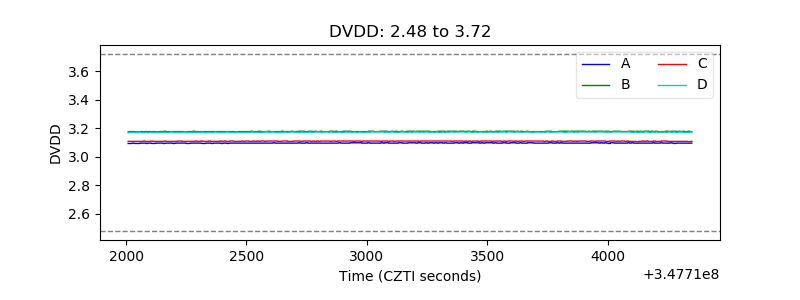 |
| Temperature 1 | 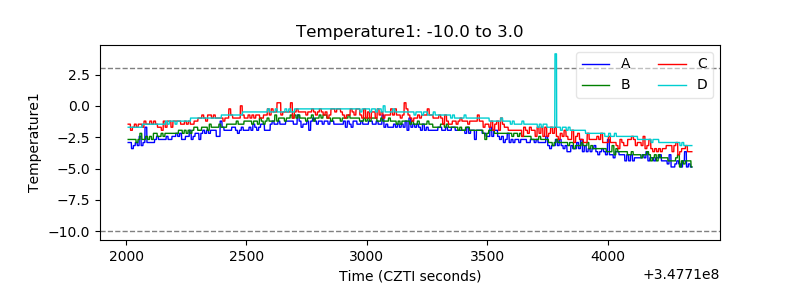 |
| Veto HV Monitor | 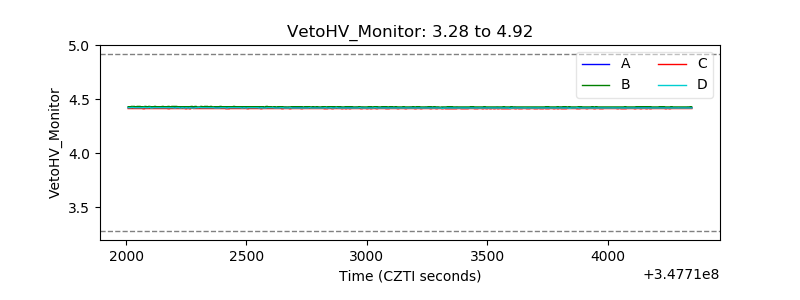 |
| Veto LLD | 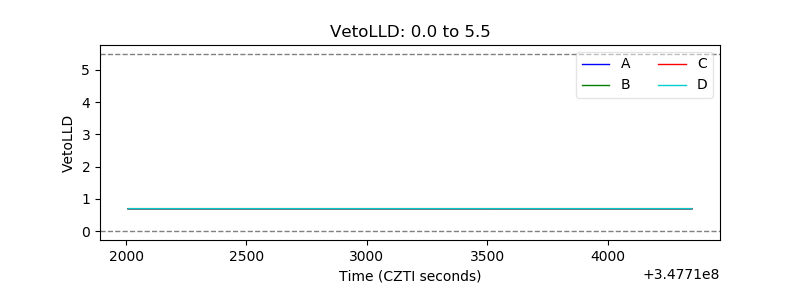 |
| Alpha Counter | 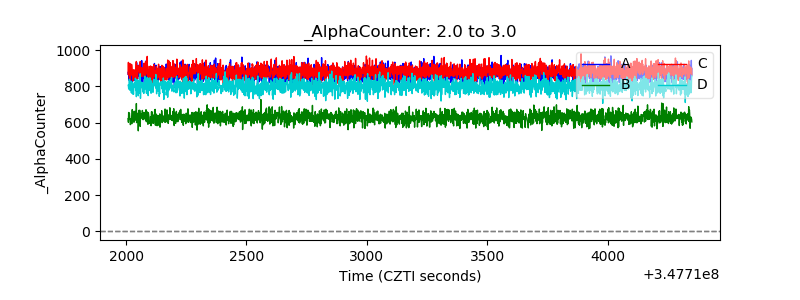 |
| _CPM_Rate | 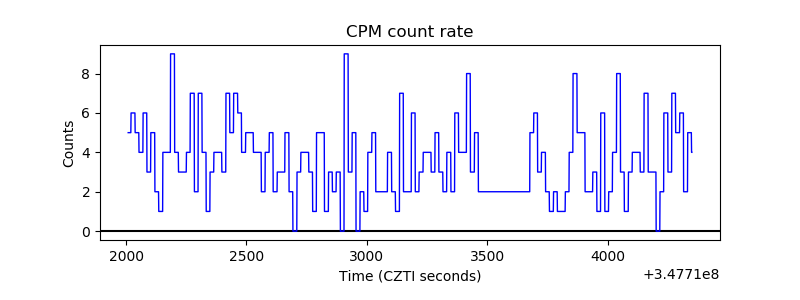 |
| CZT Counter | 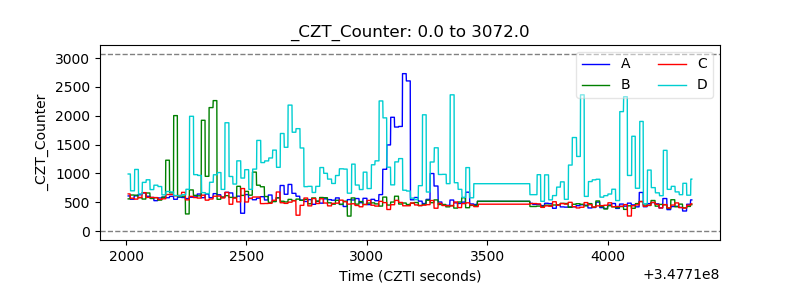 |
| +2.5 Volts monitor |  |
| +5 Volts monitor |  |
| _ROLL_ROT | 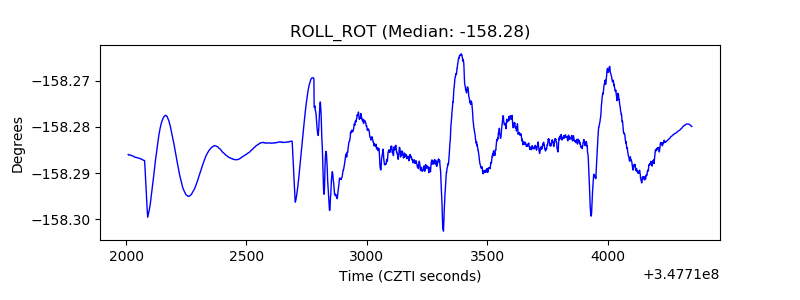 |
| _Roll_DEC | 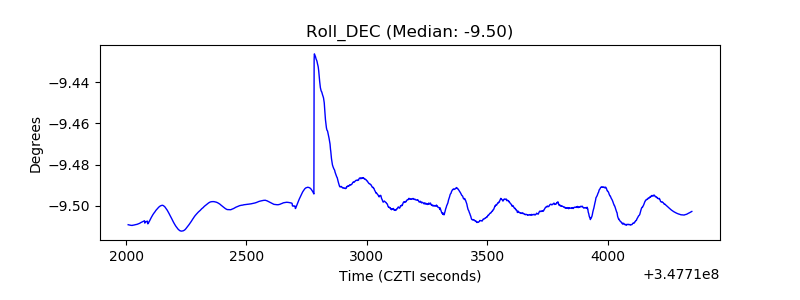 |
| _Roll_RA | 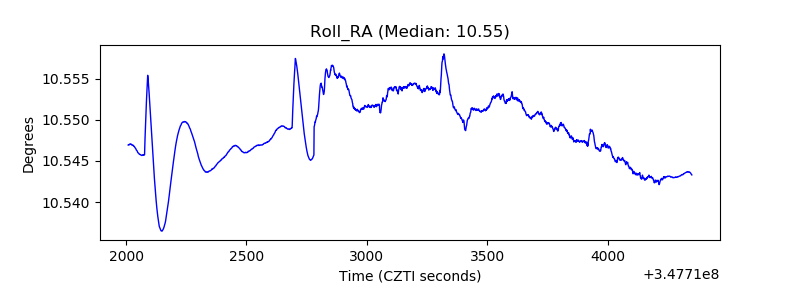 |
| Veto Counter | 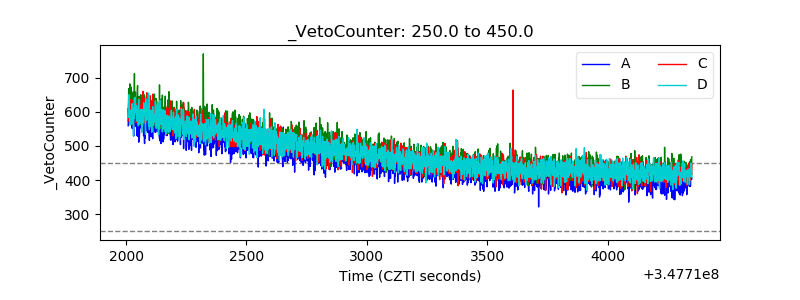 |