| Param | Original file | Final file |
|---|---|---|
| Filename | modeM0/AS1A10_058T09_9000004100_28712cztM0_level2.evt | modeM0/AS1A10_058T09_9000004100_28712cztM0_level2_quad_clean.evt |
| Size (bytes) | 91,463,040 | 27,584,640 |
| Size | 87.2 MB | 26.3 MB |
| Events in quadrant A | 644,261 | 186,206 |
| Events in quadrant B | 664,401 | 191,217 |
| Events in quadrant C | 700,581 | 181,374 |
| Events in quadrant D | 654,464 | 163,827 |
| Mode SS | |||
|---|---|---|---|
| Quadrant | BADHDUFLAG | Total packets | Discarded packets |
| A | 0 | 91 | 69 |
| B | 0 | 79 | 51 |
| C | 0 | 94 | 52 |
| D | 0 | 93 | 65 |
| Mode M9 | |||
|---|---|---|---|
| Quadrant | BADHDUFLAG | Total packets | Discarded packets |
| A | 0 | 11 | 7 |
| B | 0 | 9 | 5 |
| C | 0 | 8 | 4 |
| D | 0 | 10 | 8 |
| Mode M0 | |||
|---|---|---|---|
| Quadrant | BADHDUFLAG | Total packets | Discarded packets |
| A | 0 | 8942 | 5844 |
| B | 0 | 9046 | 5913 |
| C | 0 | 9644 | 6528 |
| D | 0 | 13854 | 10824 |
| Quadrant | Total seconds | Saturated seconds | Saturation percentage |
|---|---|---|---|
| A | 1536 | 0 | 0.000000% |
| B | 1552 | 5 | 0.322165% |
| C | 1526 | 8 | 0.524246% |
| D | 1421 | 8 | 0.562984% |
Noise dominated data is calculated using 1-second bins in cleaned event files. If a bin has >2000 counts, and if more than 50% of those come from <1% of pixels, then it is considered to be noise-dominated and hence unusable.
| Quadrant | # 1 sec bins | Bins with >0 counts | Bins with >2000 counts | High rate bins dominated by noise | Noise dominated (total time) | Noise dominated (detector-on time) | Marked lightcurve |
|---|---|---|---|---|---|---|---|
| A | 3487 | 1909 | 0 | 0 | 0.00% | 0.00% | 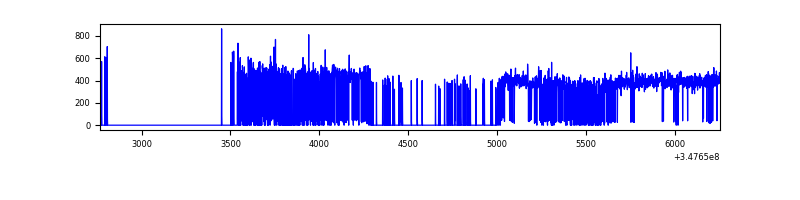 |
| B | 3480 | 1939 | 0 | 0 | 0.00% | 0.00% | 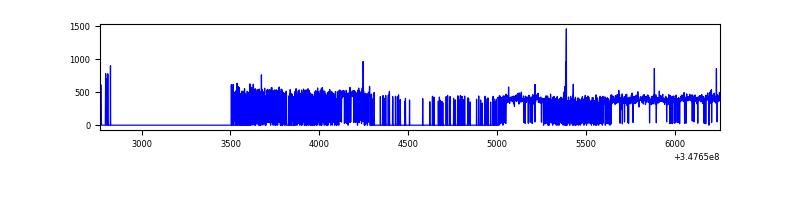 |
| C | 3474 | 1881 | 0 | 0 | 0.00% | 0.00% | 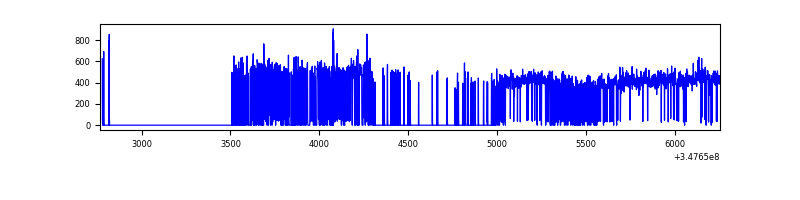 |
| D | 3447 | 1750 | 5 | 5 | 0.15% | 0.29% | 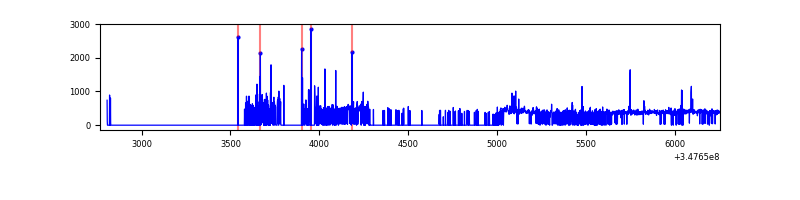 |
Top three noisy pixels from each quadrant. If the there are fewer than three noisy pixels in the level2.evt file, extra rows are filled as -1
| Pixel properties | Quadrant properties | ||||||
|---|---|---|---|---|---|---|---|
| Quadrant | DetID | PixID | Counts | Sigma | Mean | Median | Sigma |
| A | 15 | 174 | 2902 | 78.18 | 165 | 162 | 35.0 |
| A | 13 | 254 | 2821 | 75.86 | 165 | 162 | 35.0 |
| A | 14 | 239 | 2474 | 65.96 | 165 | 162 | 35.0 |
| B | 10 | 247 | 4274 | 120.47 | 168 | 163 | 34.1 |
| B | 12 | 111 | 3914 | 109.92 | 168 | 163 | 34.1 |
| B | 11 | 111 | 3546 | 99.13 | 168 | 163 | 34.1 |
| C | 3 | 233 | 49662 | 1269.72 | 158 | 159 | 39.0 |
| C | 14 | 238 | 28470 | 726.16 | 158 | 159 | 39.0 |
| C | 14 | 254 | 4582 | 113.45 | 158 | 159 | 39.0 |
| D | 8 | 195 | 46620 | 1262.26 | 144 | 139 | 36.8 |
| D | 1 | 52 | 44741 | 1211.23 | 144 | 139 | 36.8 |
| D | 7 | 80 | 8319 | 222.14 | 144 | 139 | 36.8 |
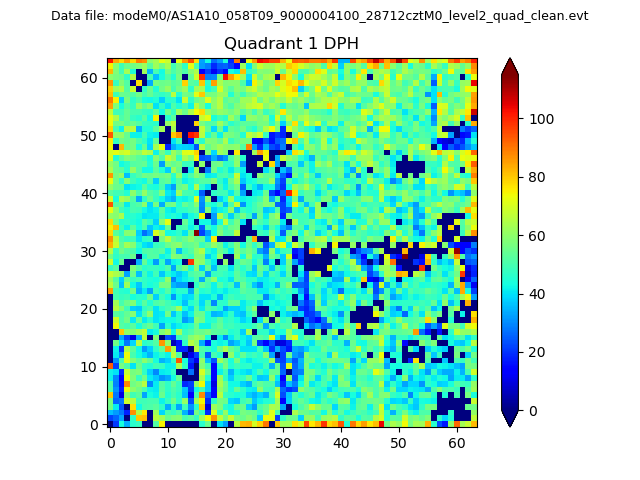
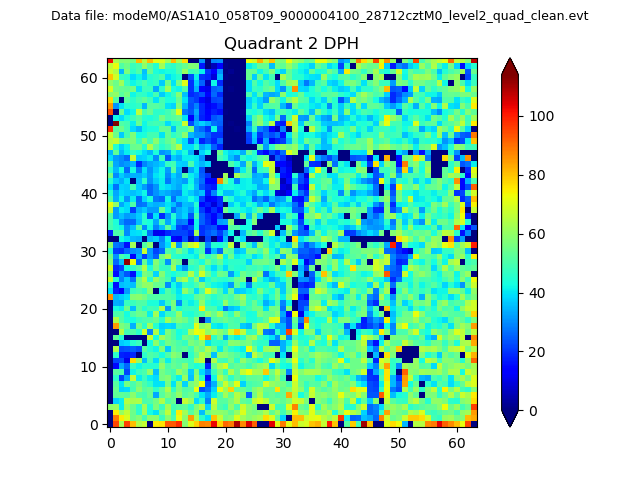
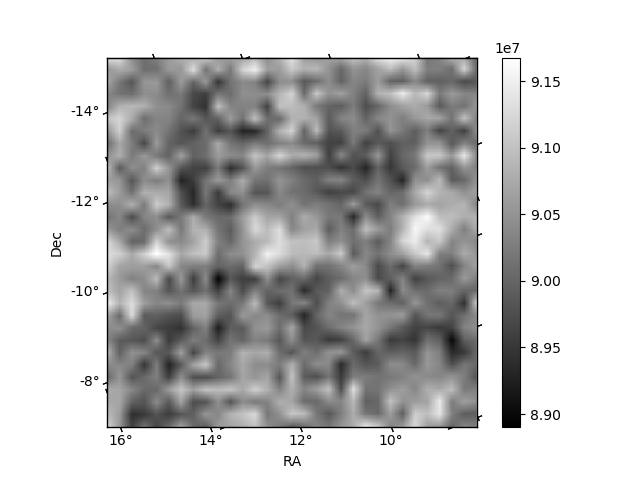
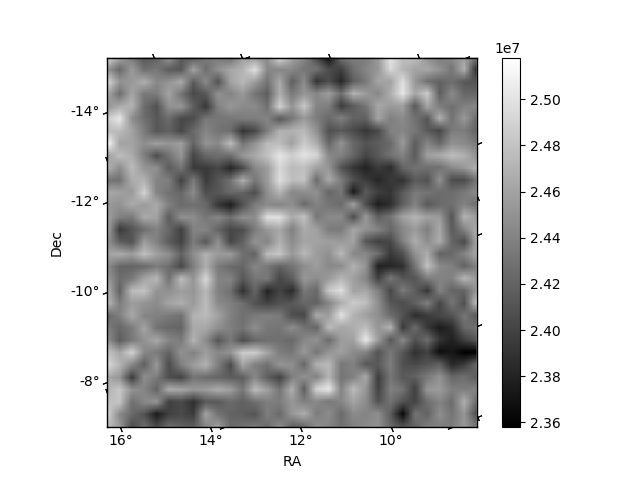
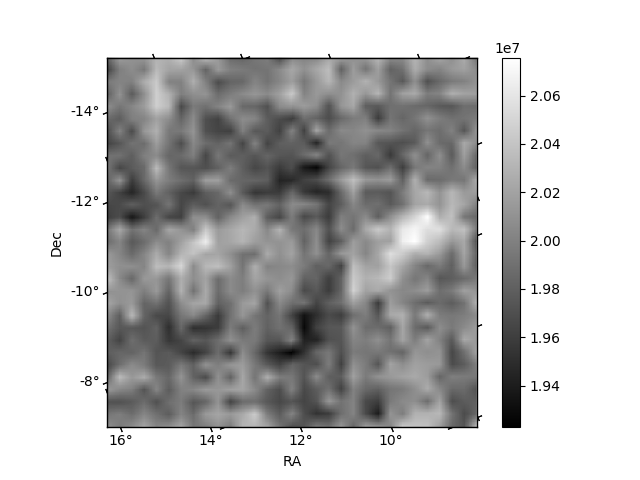
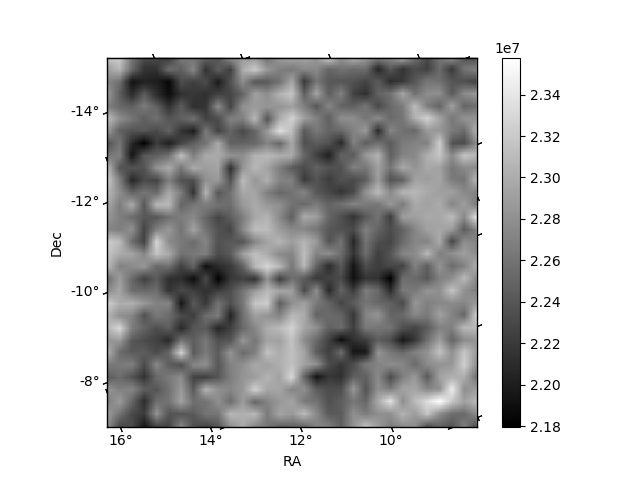
Histogram calculated using DETX and DETY for each event in the final _common_clean file
| Quadrant A |  |
 |
Quadrant B |
|---|---|---|---|
| Quadrant D | 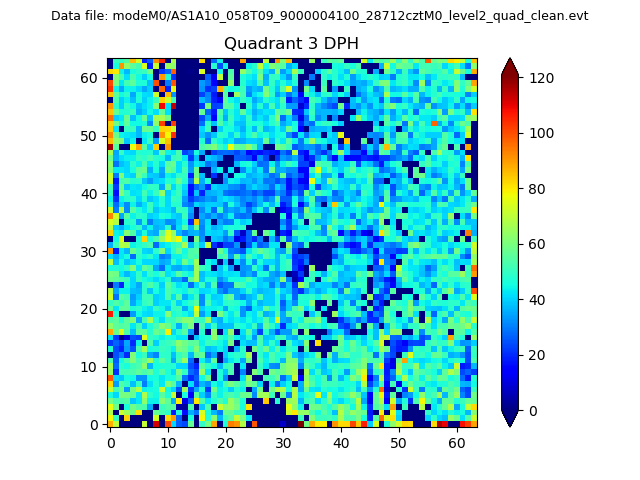 |
 |
Quadrant C |
| Plot type | Count rate plots | Images |
|---|---|---|
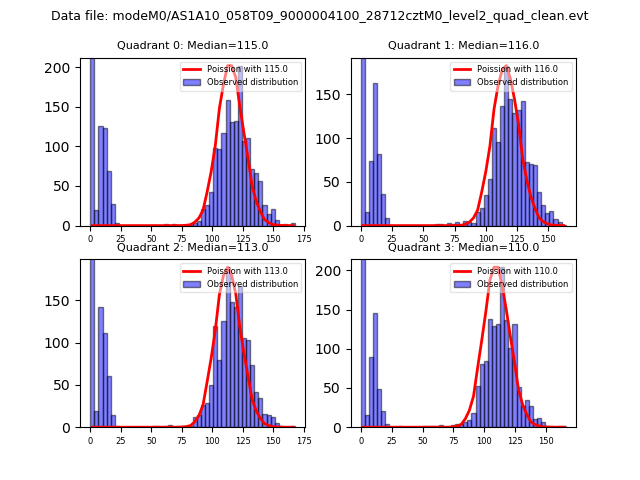
| Comparison with Poisson distribution Blue bars denote a histogram of data divided into 1 sec bins. Red curve is a Poisson curve with rate = median count rate of data. |
 |
 |
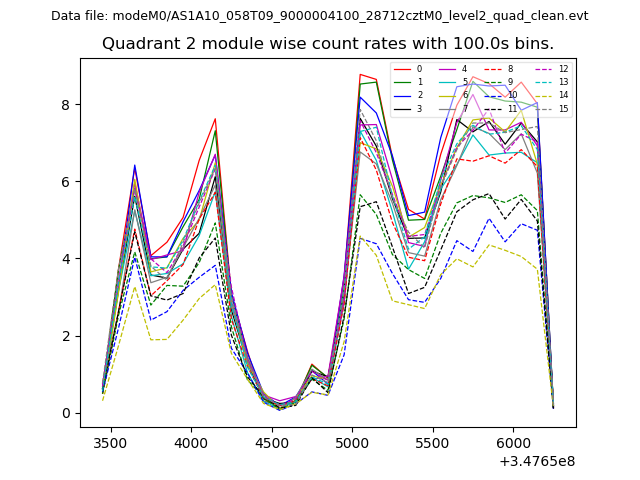
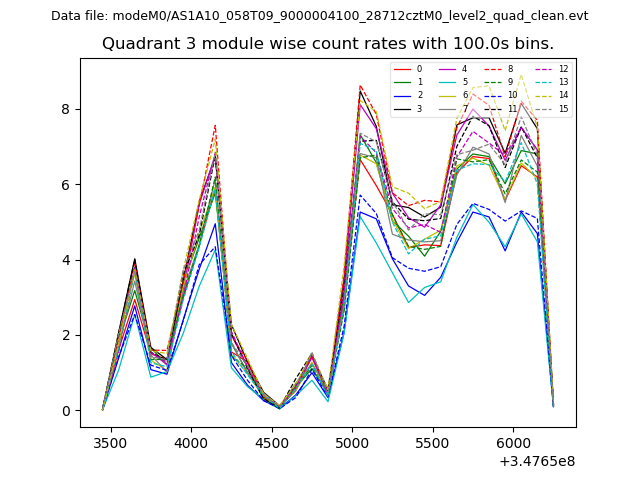
| Quadrant-wise count rates Data is divided into 100 sec bins |
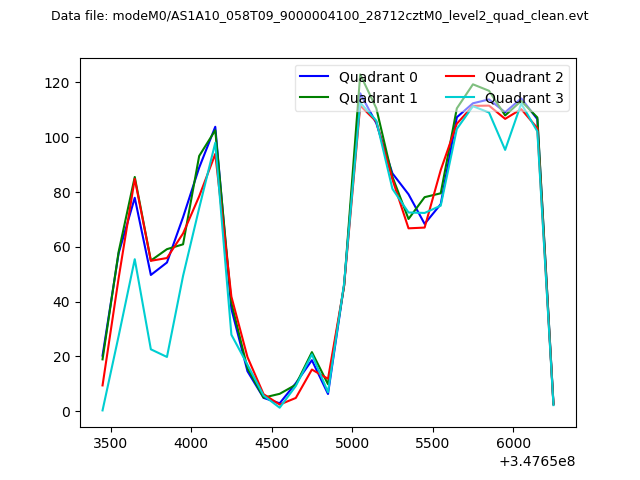 |
|
| Module-wise count rates for Quadrant A Data is divided into 100 sec bins |
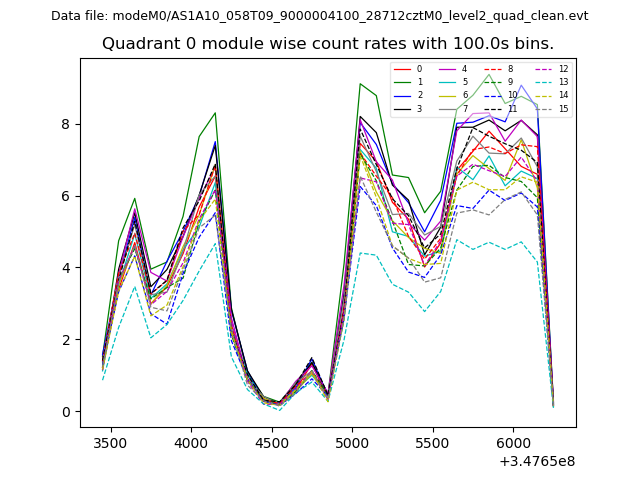 |
 |
| Module-wise count rates for Quadrant B Data is divided into 100 sec bins |
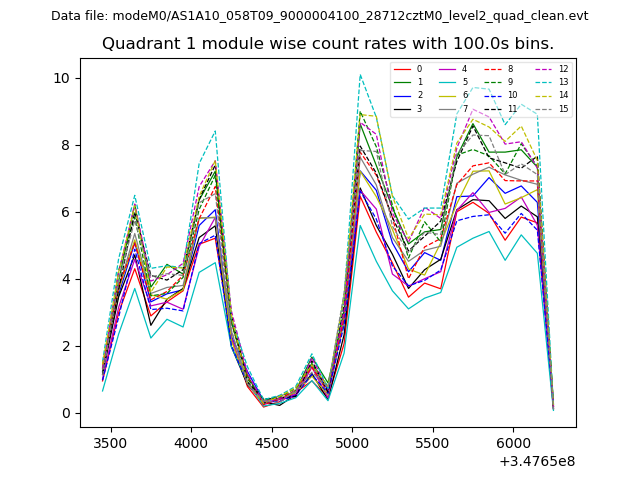 |
 |
| Module-wise count rates for Quadrant C Data is divided into 100 sec bins |
 |
 |
| Module-wise count rates for Quadrant D Data is divided into 100 sec bins |
 |
 |
| Parameter | Plot |
|---|---|
| CZT HV Monitor | 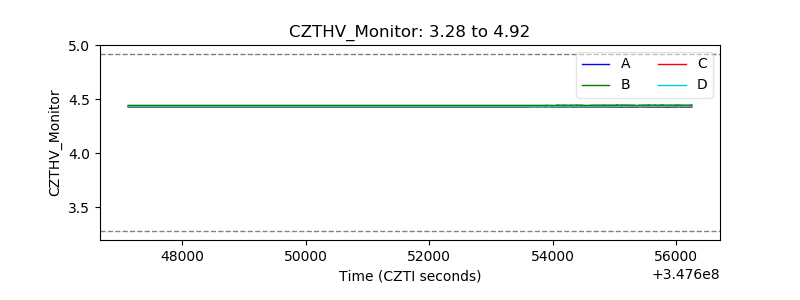 |
| D_VDD | 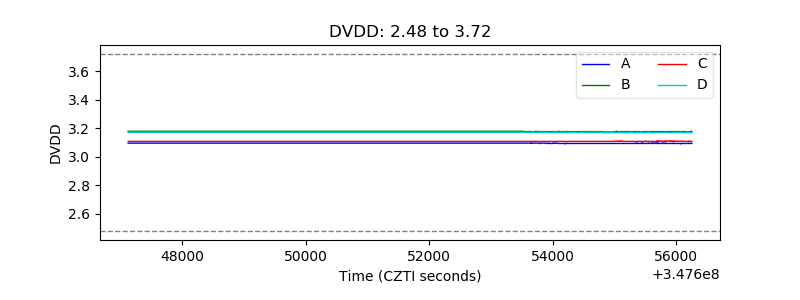 |
| Temperature 1 | 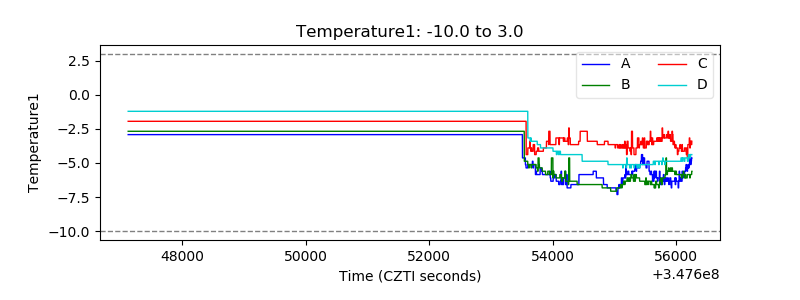 |
| Veto HV Monitor | 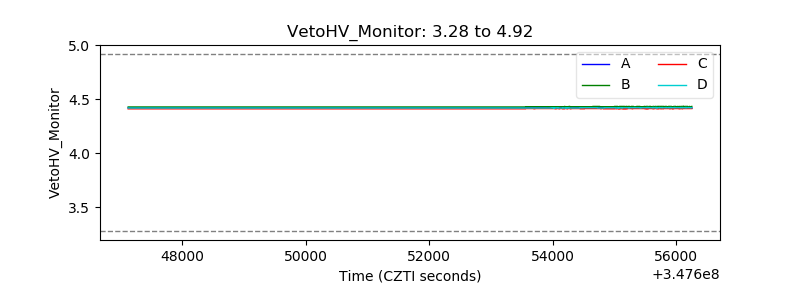 |
| Veto LLD | 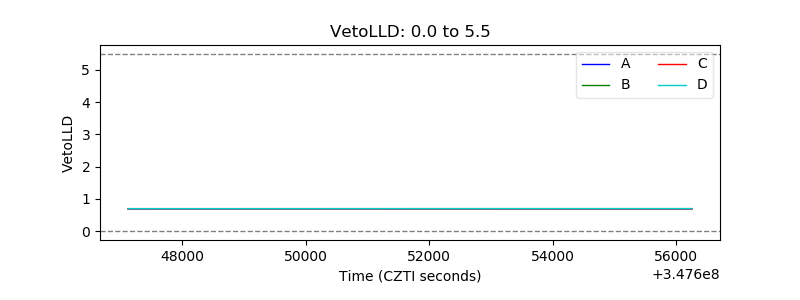 |
| Alpha Counter | 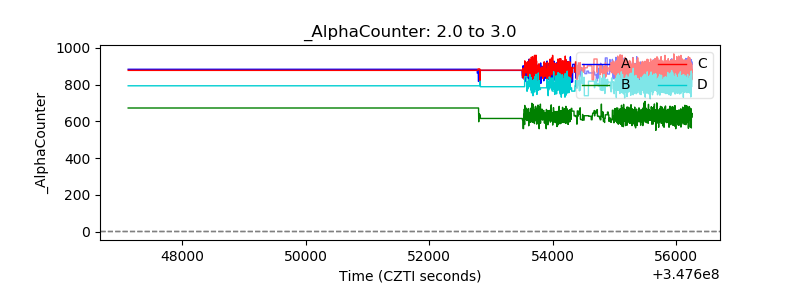 |
| _CPM_Rate | 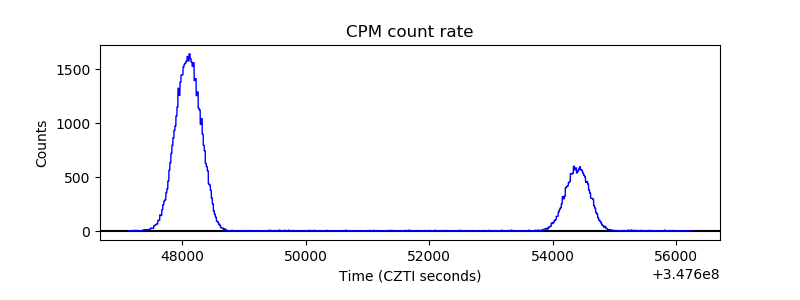 |
| CZT Counter | 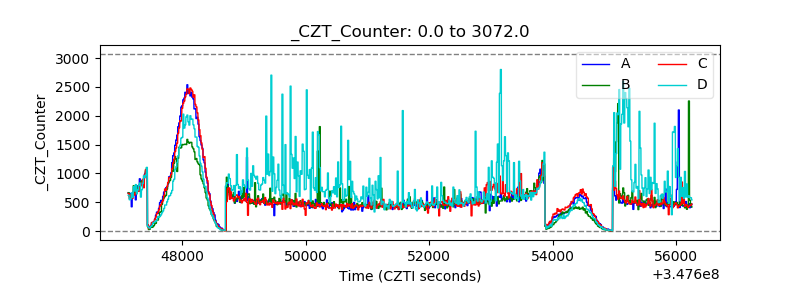 |
| +2.5 Volts monitor |  |
| +5 Volts monitor |  |
| _ROLL_ROT | 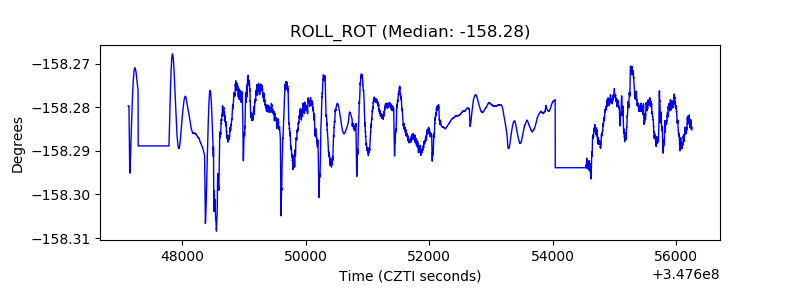 |
| _Roll_DEC | 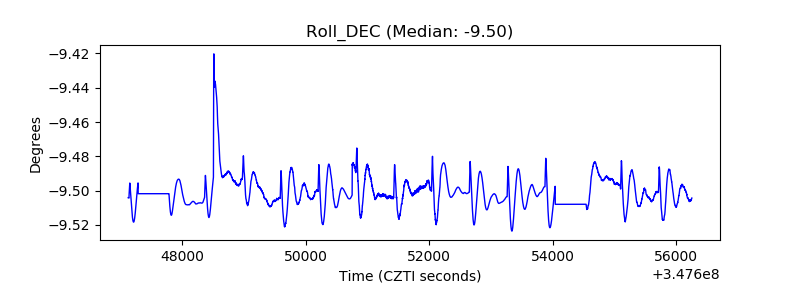 |
| _Roll_RA | 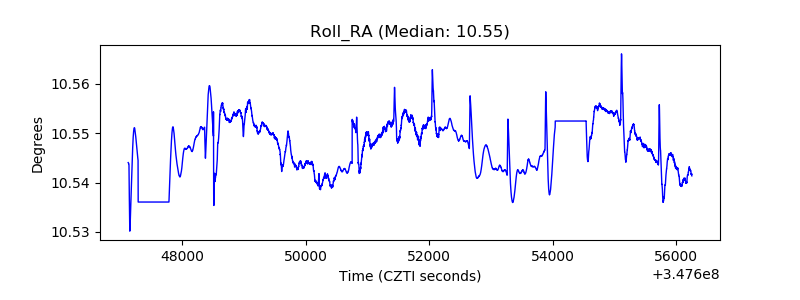 |
| Veto Counter | 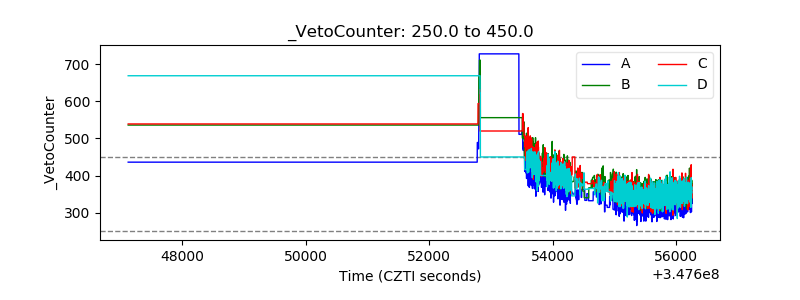 |