| Param | Original file | Final file |
|---|---|---|
| Filename | modeM0/AS1A10_058T09_9000004100_28713cztM0_level2.evt | modeM0/AS1A10_058T09_9000004100_28713cztM0_level2_quad_clean.evt |
| Size (bytes) | 309,830,400 | 43,248,960 |
| Size | 295.5 MB | 41.2 MB |
| Events in quadrant A | 2,066,040 | 258,343 |
| Events in quadrant B | 2,101,604 | 259,613 |
| Events in quadrant C | 2,409,026 | 240,627 |
| Events in quadrant D | 2,506,924 | 241,765 |
| Mode SS | |||
|---|---|---|---|
| Quadrant | BADHDUFLAG | Total packets | Discarded packets |
| A | 0 | 161 | 62 |
| B | 0 | 167 | 79 |
| C | 0 | 166 | 72 |
| D | 0 | 168 | 77 |
| Mode M9 | |||
|---|---|---|---|
| Quadrant | BADHDUFLAG | Total packets | Discarded packets |
| A | 0 | 10 | 6 |
| B | 0 | 11 | 10 |
| C | 0 | 11 | 7 |
| D | 0 | 12 | 8 |
| Mode M0 | |||
|---|---|---|---|
| Quadrant | BADHDUFLAG | Total packets | Discarded packets |
| A | 0 | 16383 | 7356 |
| B | 0 | 16622 | 7537 |
| C | 0 | 18038 | 8320 |
| D | 0 | 19026 | 8612 |
| Quadrant | Total seconds | Saturated seconds | Saturation percentage |
|---|---|---|---|
| A | 4418 | 16 | 0.362155% |
| B | 4384 | 20 | 0.456204% |
| C | 4325 | 63 | 1.456647% |
| D | 4343 | 54 | 1.243380% |
Noise dominated data is calculated using 1-second bins in cleaned event files. If a bin has >2000 counts, and if more than 50% of those come from <1% of pixels, then it is considered to be noise-dominated and hence unusable.
| Quadrant | # 1 sec bins | Bins with >0 counts | Bins with >2000 counts | High rate bins dominated by noise | Noise dominated (total time) | Noise dominated (detector-on time) | Marked lightcurve |
|---|---|---|---|---|---|---|---|
| A | 9319 | 4905 | 0 | 0 | 0.00% | 0.00% | 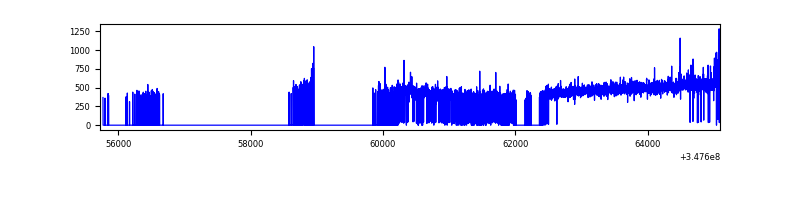 |
| B | 9366 | 4865 | 0 | 0 | 0.00% | 0.00% | 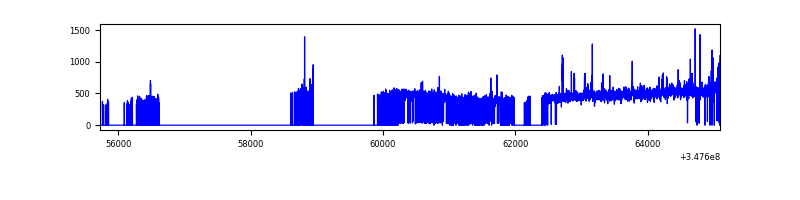 |
| C | 9330 | 4815 | 0 | 0 | 0.00% | 0.00% | 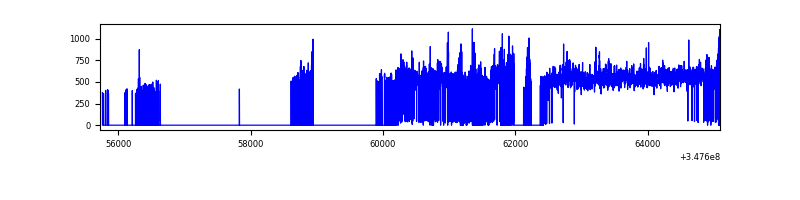 |
| D | 9282 | 4827 | 33 | 33 | 0.36% | 0.68% | 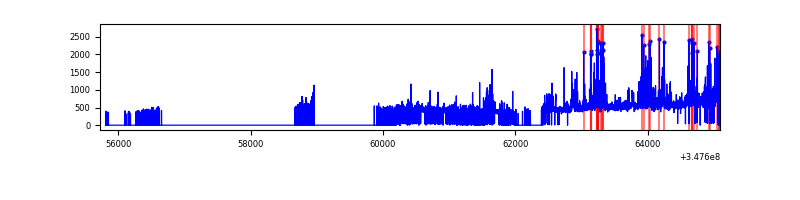 |
Top three noisy pixels from each quadrant. If the there are fewer than three noisy pixels in the level2.evt file, extra rows are filled as -1
| Pixel properties | Quadrant properties | ||||||
|---|---|---|---|---|---|---|---|
| Quadrant | DetID | PixID | Counts | Sigma | Mean | Median | Sigma |
| A | 14 | 239 | 11745 | 104.17 | 531 | 519 | 107.8 |
| A | 13 | 254 | 7585 | 65.57 | 531 | 519 | 107.8 |
| A | 15 | 174 | 5601 | 47.16 | 531 | 519 | 107.8 |
| B | 0 | 190 | 26161 | 251.02 | 522 | 507 | 102.2 |
| B | 10 | 245 | 18794 | 178.94 | 522 | 507 | 102.2 |
| B | 12 | 111 | 12477 | 117.12 | 522 | 507 | 102.2 |
| C | 3 | 233 | 348457 | 2949.95 | 496 | 499 | 118.0 |
| C | 14 | 238 | 91216 | 769.09 | 496 | 499 | 118.0 |
| C | 14 | 254 | 16602 | 136.52 | 496 | 499 | 118.0 |
| D | 1 | 52 | 339311 | 2772.16 | 501 | 485 | 122.2 |
| D | 8 | 195 | 213261 | 1740.86 | 501 | 485 | 122.2 |
| D | 7 | 80 | 21494 | 171.89 | 501 | 485 | 122.2 |
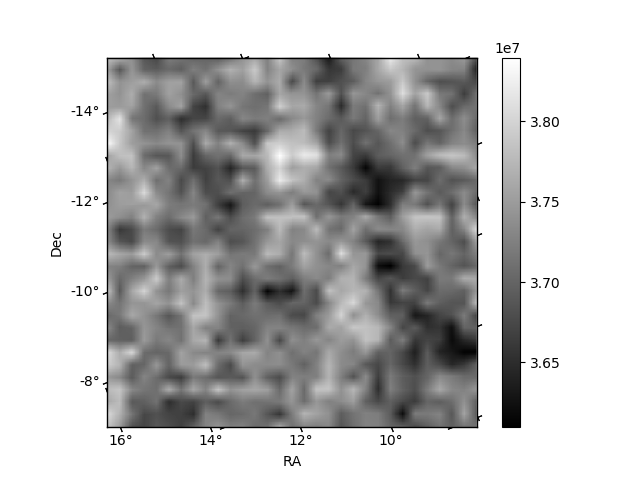
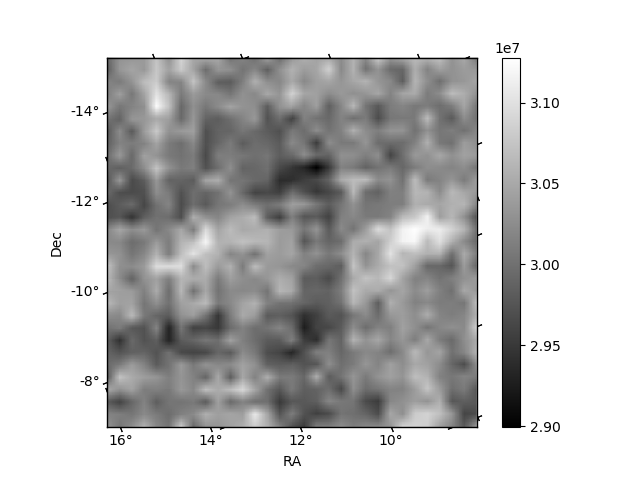
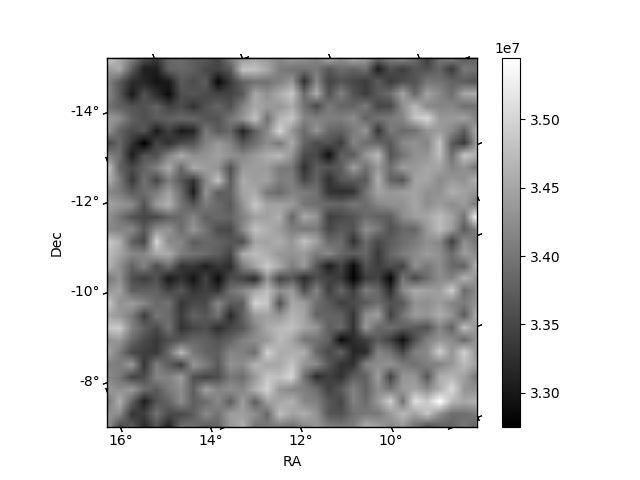
Histogram calculated using DETX and DETY for each event in the final _common_clean file
| Quadrant A | 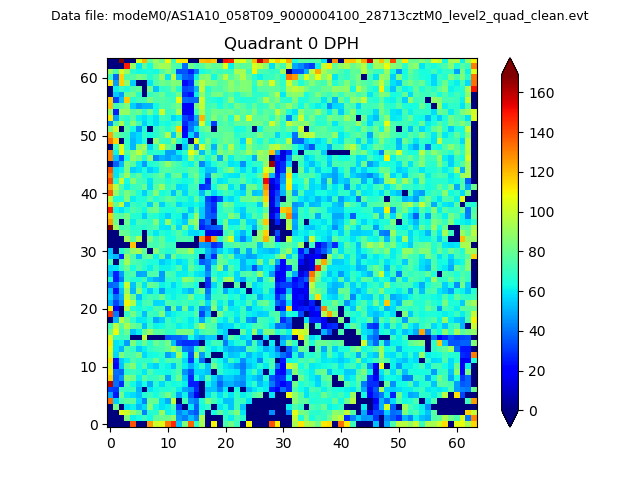 |
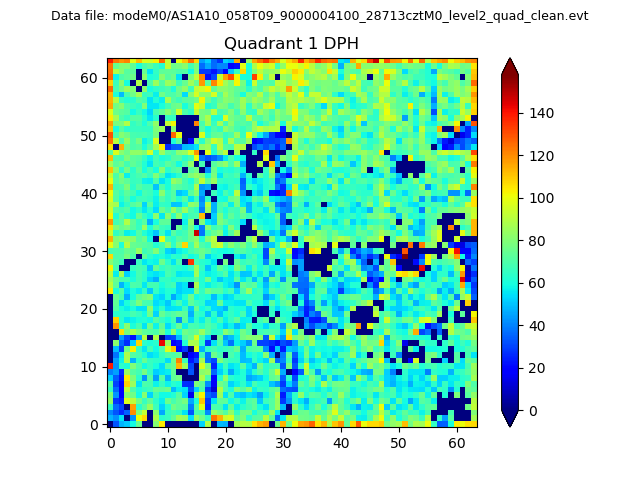 |
Quadrant B |
|---|---|---|---|
| Quadrant D | 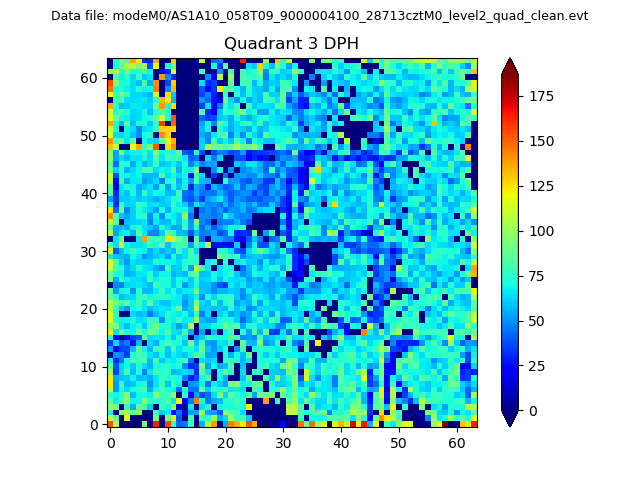 |
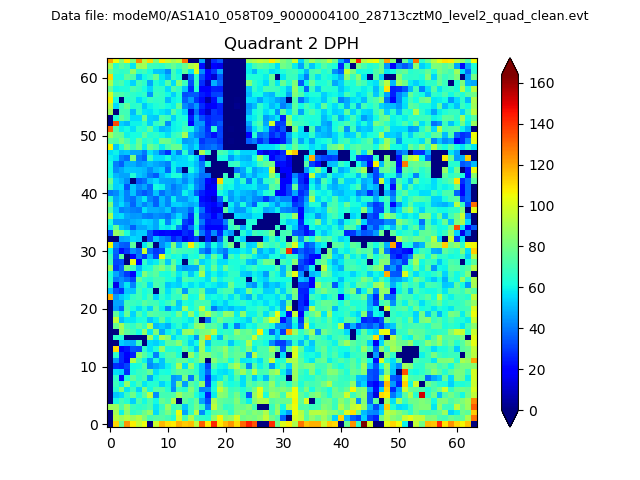 |
Quadrant C |
| Plot type | Count rate plots | Images |
|---|---|---|
| Comparison with Poisson distribution Blue bars denote a histogram of data divided into 1 sec bins. Red curve is a Poisson curve with rate = median count rate of data. |
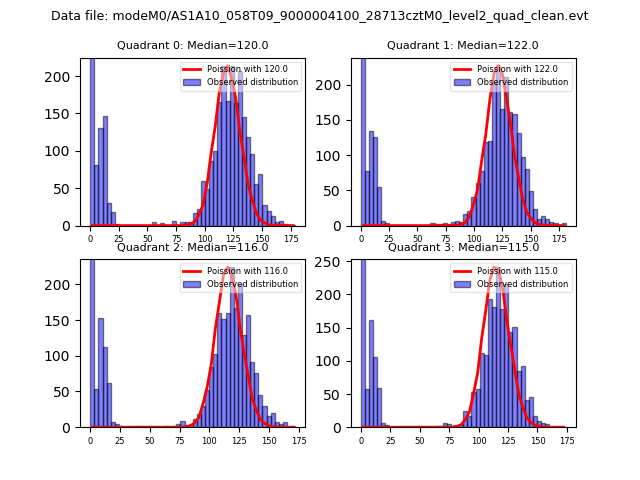 |
 |
| Quadrant-wise count rates Data is divided into 100 sec bins |
 |
|
| Module-wise count rates for Quadrant A Data is divided into 100 sec bins |
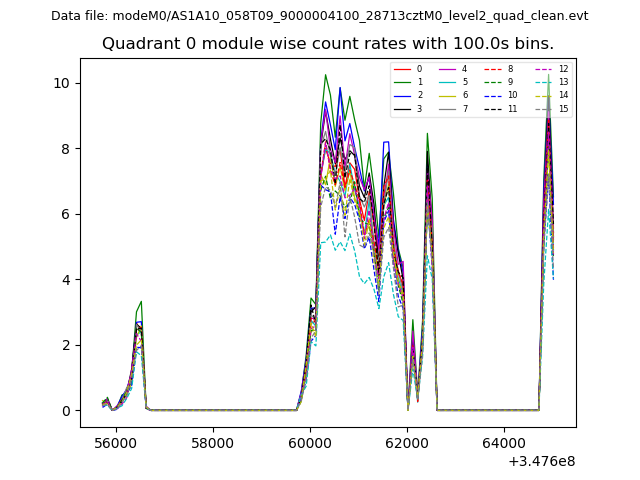 |
 |
| Module-wise count rates for Quadrant B Data is divided into 100 sec bins |
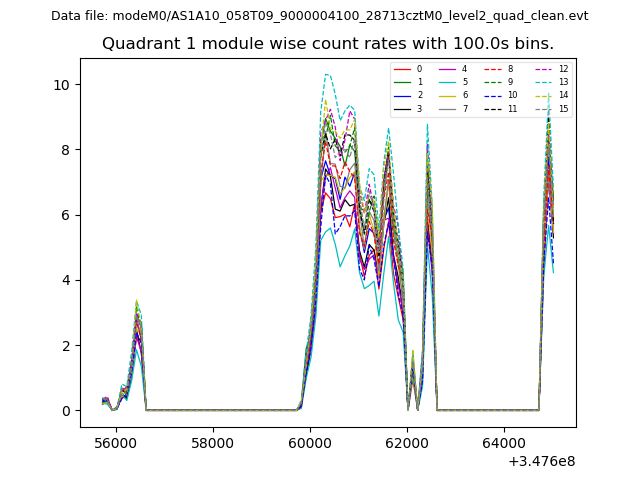 |
 |
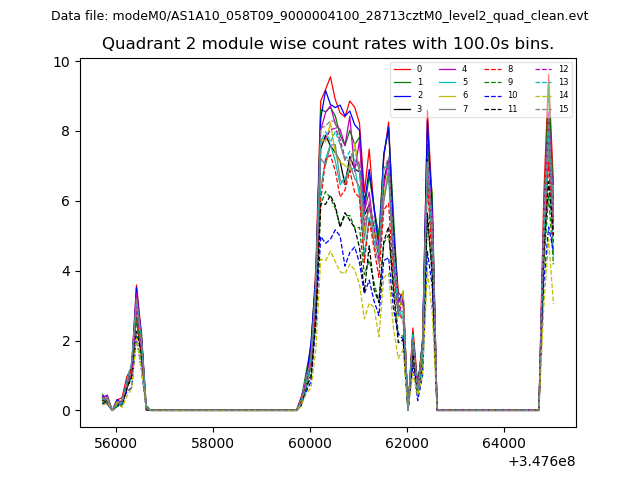
| Module-wise count rates for Quadrant C Data is divided into 100 sec bins |
 |
 |
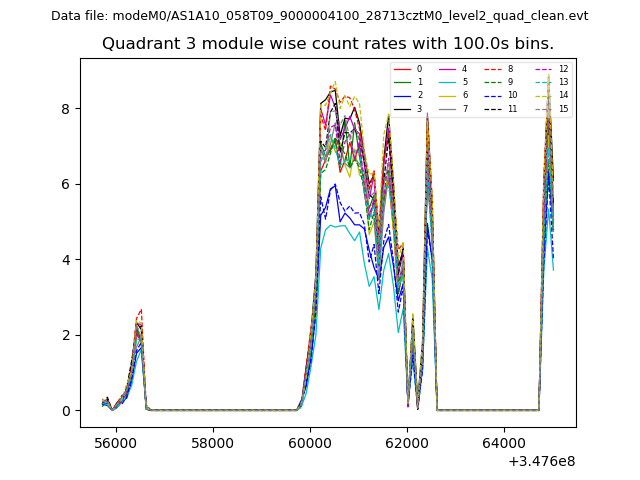
| Module-wise count rates for Quadrant D Data is divided into 100 sec bins |
 |
 |
| Parameter | Plot |
|---|---|
| CZT HV Monitor | 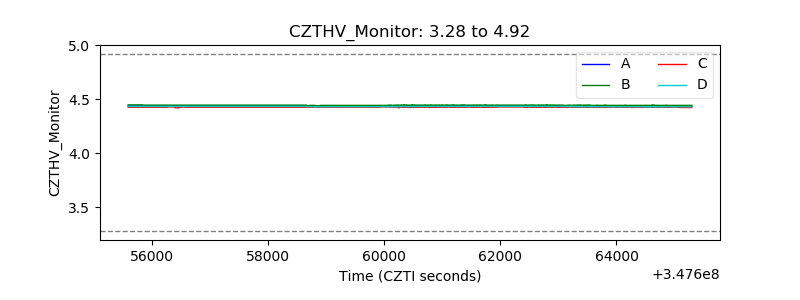 |
| D_VDD | 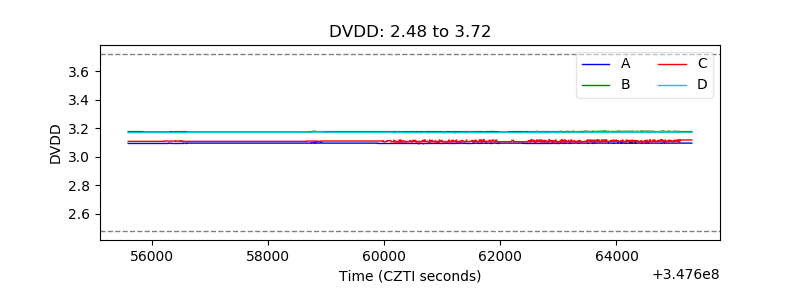 |
| Temperature 1 | 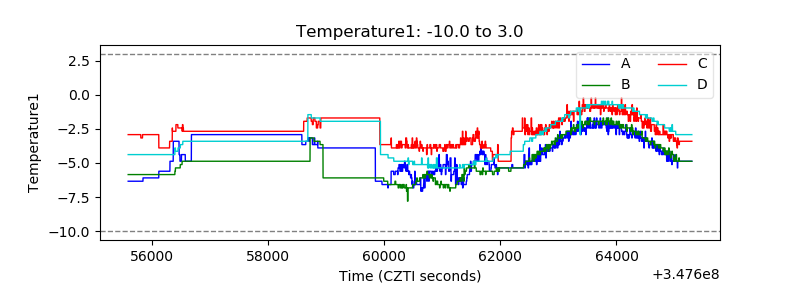 |
| Veto HV Monitor | 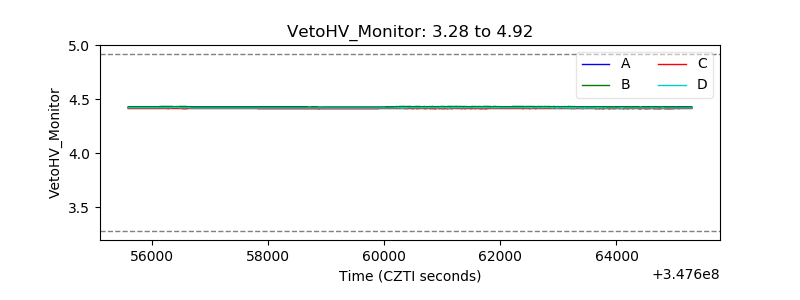 |
| Veto LLD | 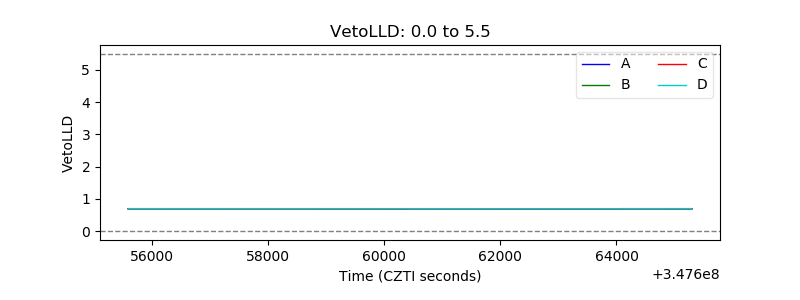 |
| Alpha Counter | 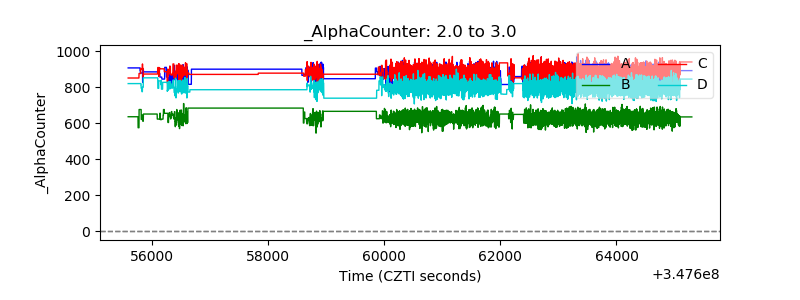 |
| _CPM_Rate | 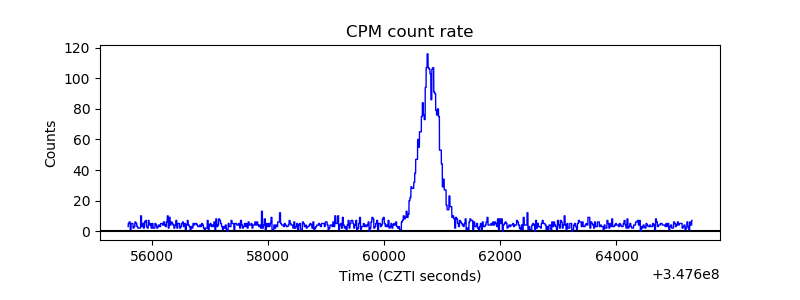 |
| CZT Counter | 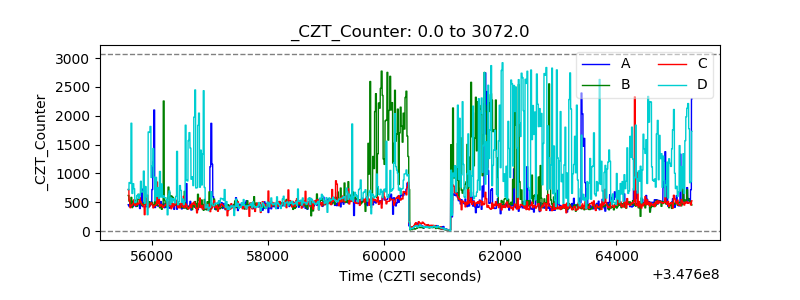 |
| +2.5 Volts monitor |  |
| +5 Volts monitor |  |
| _ROLL_ROT | 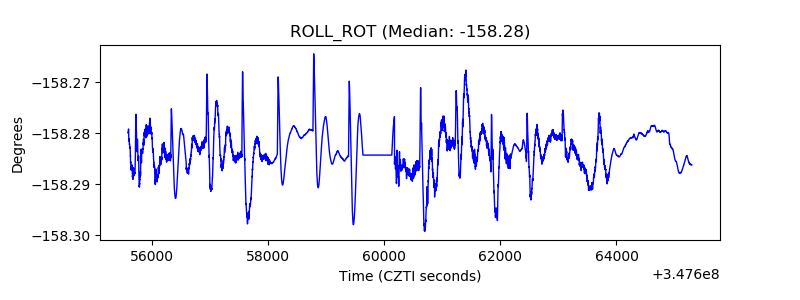 |
| _Roll_DEC | 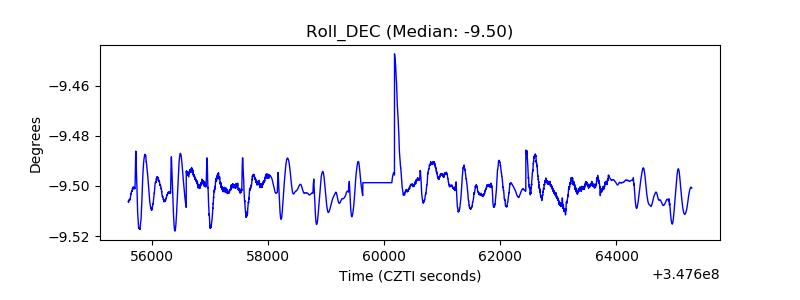 |
| _Roll_RA | 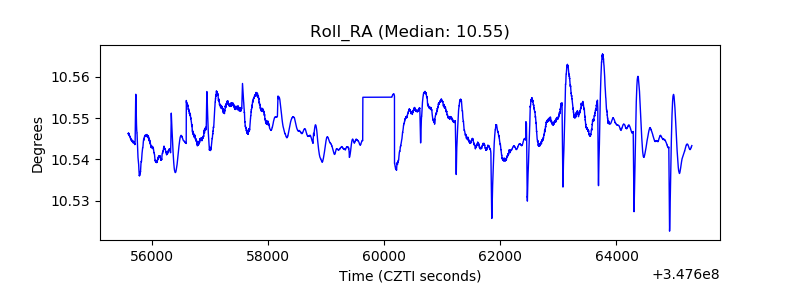 |
| Veto Counter | 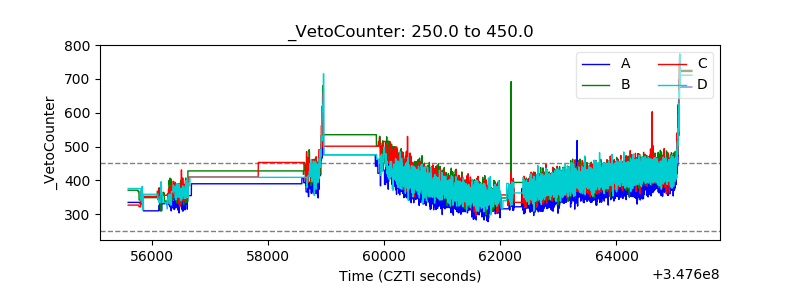 |