| Param | Original file | Final file |
|---|---|---|
| Filename | modeM0/AS1A10_102T07_9000004102cztM0_level2.fits | modeM0/AS1A10_102T07_9000004102cztM0_level2_quad_clean.evt |
| Size (bytes) | 938,937,600 | 746,118,720 |
| Size | 895.4 MB | 711.6 MB |
| Events in quadrant A | 5,891,830 | 4,336,367 |
| Events in quadrant B | 5,627,602 | 4,297,756 |
| Events in quadrant C | 5,658,236 | 4,047,825 |
| Events in quadrant D | 4,853,836 | 3,510,517 |
| Mode M0 | |||
|---|---|---|---|
| Quadrant | BADHDUFLAG | Total packets | Discarded packets |
| A | 0 | 214892 | 0 |
| B | 0 | 207716 | 0 |
| C | 0 | 197740 | 0 |
| D | 0 | 303778 | 0 |
| Mode SS | |||
|---|---|---|---|
| Quadrant | BADHDUFLAG | Total packets | Discarded packets |
| A | 0 | 1902 | 0 |
| B | 0 | 1902 | 0 |
| C | 0 | 1902 | 0 |
| D | 0 | 1902 | 0 |
| Mode M9 | |||
|---|---|---|---|
| Quadrant | BADHDUFLAG | Total packets | Discarded packets |
| A | 0 | 157 | 0 |
| B | 0 | 157 | 0 |
| C | 0 | 157 | 0 |
| D | 0 | 157 | 0 |
| Quadrant | Total seconds | Saturated seconds | Saturation percentage |
|---|---|---|---|
| A | 93391 | 2271 | 2.431712% |
| B | 93391 | 2237 | 2.395306% |
| C | 93391 | 1651 | 1.767836% |
| D | 93391 | 7543 | 8.076795% |
Noise dominated data is calculated using 1-second bins in cleaned event files. If a bin has >2000 counts, and if more than 50% of those come from <1% of pixels, then it is considered to be noise-dominated and hence unusable.
| Quadrant | # 1 sec bins | Bins with >0 counts | Bins with >2000 counts | High rate bins dominated by noise | Noise dominated (total time) | Noise dominated (detector-on time) | Marked lightcurve |
|---|---|---|---|---|---|---|---|
| A | 116657 | 93376 | 0 | 0 | 0.00% | 0.00% |  |
| B | 116656 | 93371 | 0 | 0 | 0.00% | 0.00% |  |
| C | 116657 | 93376 | 0 | 0 | 0.00% | 0.00% |  |
| D | 116657 | 93322 | 0 | 0 | 0.00% | 0.00% |  |
Top three noisy pixels from each quadrant. If the there are fewer than three noisy pixels in the level2.evt file, extra rows are filled as -1
| Pixel properties | Quadrant properties | ||||||
|---|---|---|---|---|---|---|---|
| Quadrant | DetID | PixID | Counts | Sigma | Mean | Median | Sigma |
| A | 0 | 29 | 5734 | 11.46 | 1535 | 1445 | 374.2 |
| A | 7 | 110 | 4577 | 8.37 | 1535 | 1445 | 374.2 |
| A | 0 | 30 | 4450 | 8.03 | 1535 | 1445 | 374.2 |
| B | 2 | 9 | 4456 | 10.39 | 1489 | 1425 | 291.8 |
| B | 5 | 128 | 3724 | 7.88 | 1489 | 1425 | 291.8 |
| B | 5 | 232 | 3667 | 7.68 | 1489 | 1425 | 291.8 |
| C | 1 | 81 | 4334 | 7.78 | 1493 | 1395 | 377.6 |
| C | 1 | 80 | 4301 | 7.69 | 1493 | 1395 | 377.6 |
| C | 12 | 241 | 4050 | 7.03 | 1493 | 1395 | 377.6 |
| D | 6 | 231 | 3464 | 6.05 | 1386 | 1264 | 363.7 |
| D | 10 | 189 | 3349 | 5.73 | 1386 | 1264 | 363.7 |
| D | 7 | 3 | 3342 | 5.71 | 1386 | 1264 | 363.7 |
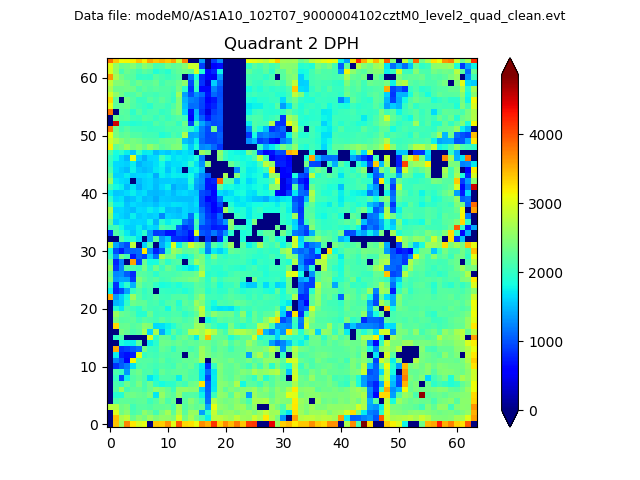
Histogram calculated using DETX and DETY for each event in the final _common_clean file
| Quadrant A |  |
 |
Quadrant B |
|---|---|---|---|
| Quadrant D |  |
 |
Quadrant C |
| Plot type | Count rate plots | Images |
|---|---|---|
| Comparison with Poisson distribution Blue bars denote a histogram of data divided into 1 sec bins. Red curve is a Poisson curve with rate = median count rate of data. |
 |
 |
| Quadrant-wise count rates Data is divided into 100 sec bins |
 |
|
| Module-wise count rates for Quadrant A Data is divided into 100 sec bins |
 |
 |
| Module-wise count rates for Quadrant B Data is divided into 100 sec bins |
 |
 |
| Module-wise count rates for Quadrant C Data is divided into 100 sec bins |
 |
 |
| Module-wise count rates for Quadrant D Data is divided into 100 sec bins |
 |
 |
| Parameter | Plot |
|---|---|
| CZT HV Monitor |  |
| D_VDD | 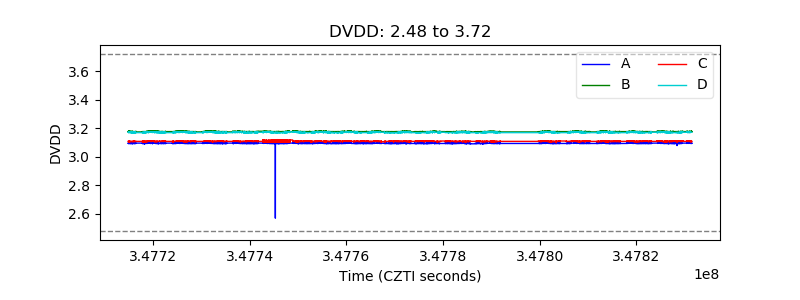 |
| Temperature 1 |  |
| Veto HV Monitor |  |
| Veto LLD |  |
| Alpha Counter |  |
| _CPM_Rate |  |
| CZT Counter |  |
| +2.5 Volts monitor |  |
| +5 Volts monitor |  |
| _ROLL_ROT |  |
| _Roll_DEC |  |
| _Roll_RA |  |
| Veto Counter |  |