| Param | Original file | Final file |
|---|---|---|
| Filename | modeM0/AS1A10_102T07_9000004102_28543cztM0_level2.evt | modeM0/AS1A10_102T07_9000004102_28543cztM0_level2_quad_clean.evt |
| Size (bytes) | 284,172,480 | 46,033,920 |
| Size | 271.0 MB | 43.9 MB |
| Events in quadrant A | 1,814,942 | 313,380 |
| Events in quadrant B | 1,706,590 | 315,281 |
| Events in quadrant C | 1,633,137 | 292,770 |
| Events in quadrant D | 3,248,890 | 260,943 |
| Mode M0 | |||
|---|---|---|---|
| Quadrant | BADHDUFLAG | Total packets | Discarded packets |
| A | 0 | 7386 | 2 |
| B | 0 | 7061 | 1 |
| C | 0 | 6753 | 1 |
| D | 0 | 11689 | 1 |
| Mode SS | |||
|---|---|---|---|
| Quadrant | BADHDUFLAG | Total packets | Discarded packets |
| A | 0 | 62 | 0 |
| B | 0 | 62 | 0 |
| C | 0 | 62 | 0 |
| D | 0 | 62 | 0 |
| Mode M9 | |||
|---|---|---|---|
| Quadrant | BADHDUFLAG | Total packets | Discarded packets |
| A | 0 | 12 | 0 |
| B | 0 | 12 | 0 |
| C | 0 | 12 | 0 |
| D | 0 | 12 | 0 |
| Quadrant | Total seconds | Saturated seconds | Saturation percentage |
|---|---|---|---|
| A | 2959 | 106 | 3.582291% |
| B | 2959 | 98 | 3.311930% |
| C | 2959 | 108 | 3.649882% |
| D | 2959 | 602 | 20.344711% |
Noise dominated data is calculated using 1-second bins in cleaned event files. If a bin has >2000 counts, and if more than 50% of those come from <1% of pixels, then it is considered to be noise-dominated and hence unusable.
| Quadrant | # 1 sec bins | Bins with >0 counts | Bins with >2000 counts | High rate bins dominated by noise | Noise dominated (total time) | Noise dominated (detector-on time) | Marked lightcurve |
|---|---|---|---|---|---|---|---|
| A | 4199 | 2959 | 18 | 18 | 0.43% | 0.61% | 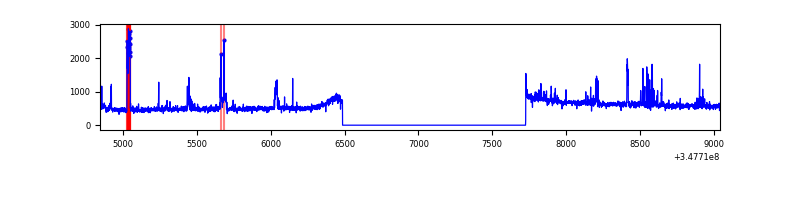 |
| B | 4199 | 2959 | 10 | 10 | 0.24% | 0.34% | 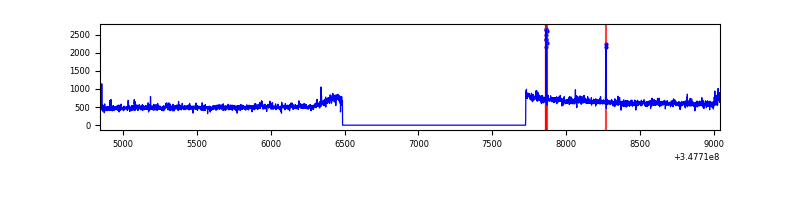 |
| C | 4199 | 2959 | 0 | 0 | 0.00% | 0.00% | 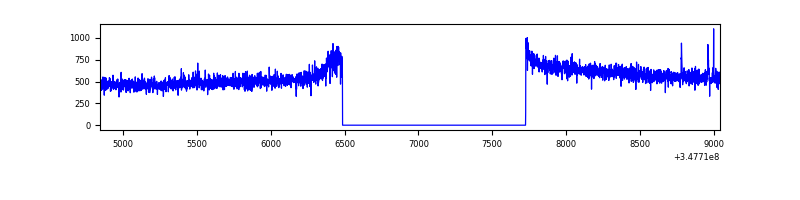 |
| D | 4198 | 2958 | 489 | 489 | 11.65% | 16.53% | 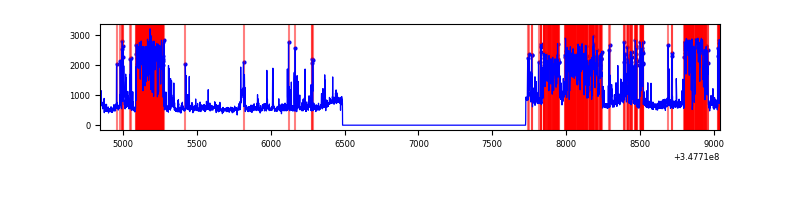 |
Top three noisy pixels from each quadrant. If the there are fewer than three noisy pixels in the level2.evt file, extra rows are filled as -1
| Pixel properties | Quadrant properties | ||||||
|---|---|---|---|---|---|---|---|
| Quadrant | DetID | PixID | Counts | Sigma | Mean | Median | Sigma |
| A | 15 | 174 | 174041 | 2024.78 | 425 | 417 | 85.7 |
| A | 13 | 254 | 5379 | 57.87 | 425 | 417 | 85.7 |
| A | 3 | 137 | 3918 | 40.83 | 425 | 417 | 85.7 |
| B | 0 | 230 | 32946 | 408.69 | 416 | 407 | 79.6 |
| B | 10 | 245 | 31708 | 393.14 | 416 | 407 | 79.6 |
| B | 12 | 111 | 9425 | 113.27 | 416 | 407 | 79.6 |
| C | 14 | 238 | 65351 | 693.84 | 397 | 399 | 93.6 |
| C | 3 | 233 | 13881 | 144.02 | 397 | 399 | 93.6 |
| C | 13 | 61 | 2747 | 25.08 | 397 | 399 | 93.6 |
| D | 1 | 52 | 986937 | 10619.45 | 385 | 375 | 92.9 |
| D | 8 | 195 | 748013 | 8047.65 | 385 | 375 | 92.9 |
| D | 13 | 104 | 26053 | 276.4 | 385 | 375 | 92.9 |
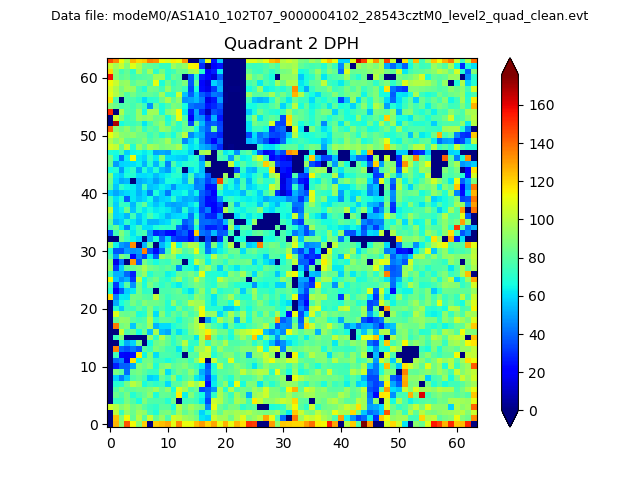
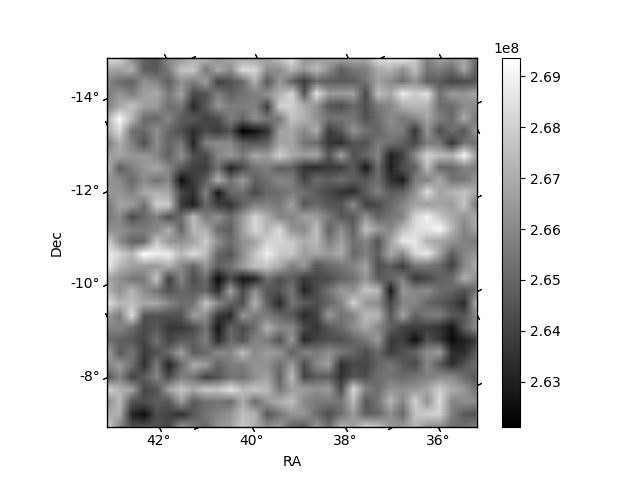
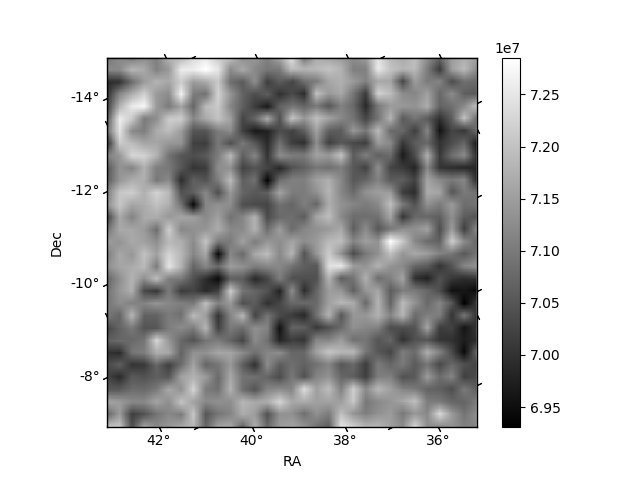
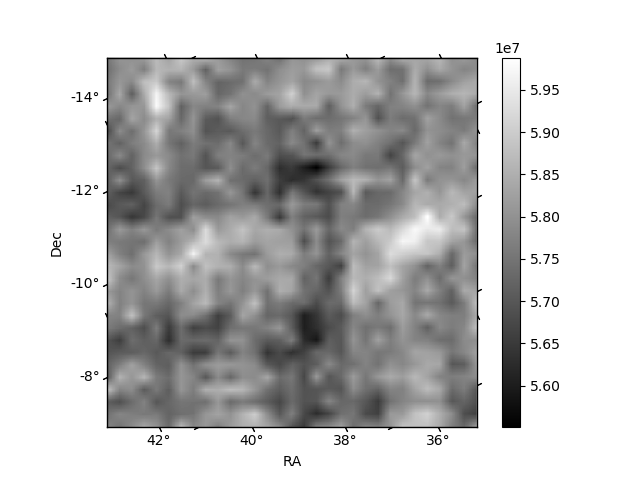
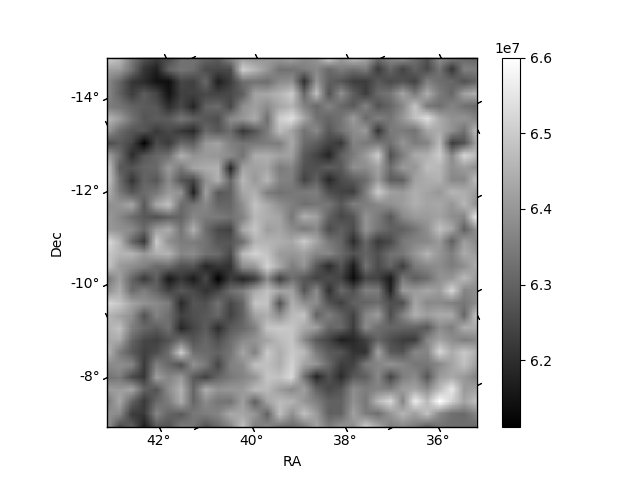
Histogram calculated using DETX and DETY for each event in the final _common_clean file
| Quadrant A | 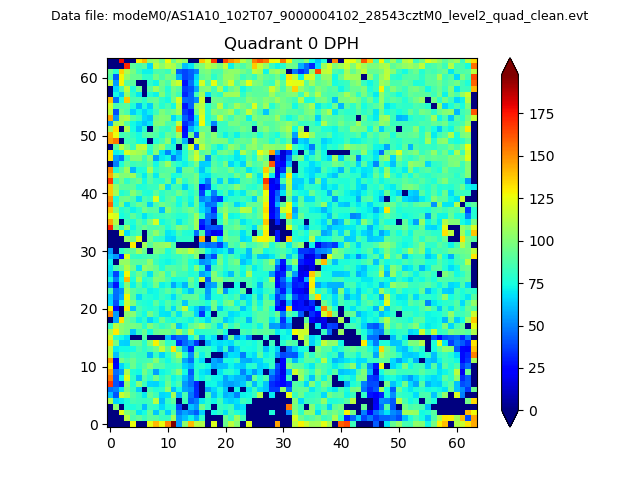 |
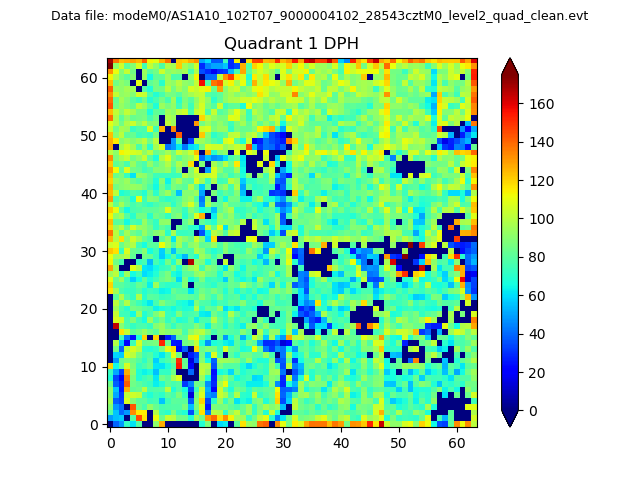 |
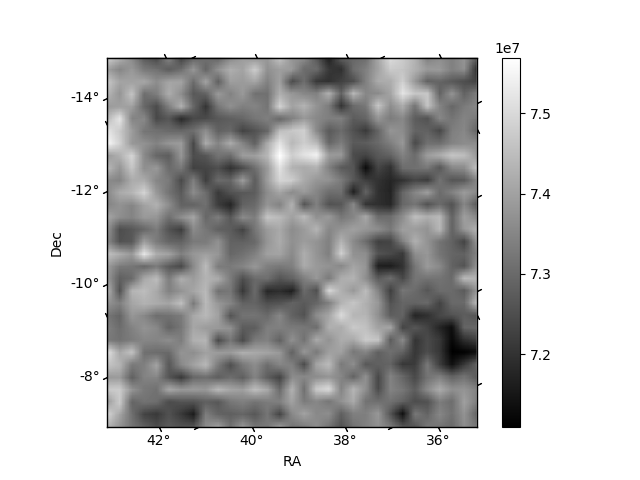
Quadrant B |
|---|---|---|---|
| Quadrant D | 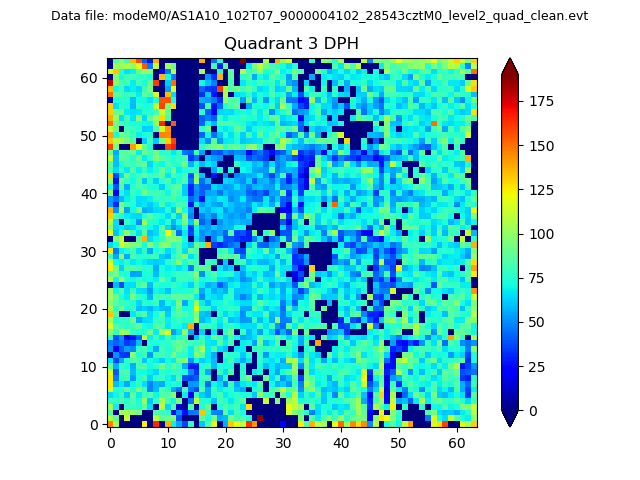 |
 |
Quadrant C |
| Plot type | Count rate plots | Images |
|---|---|---|
| Comparison with Poisson distribution Blue bars denote a histogram of data divided into 1 sec bins. Red curve is a Poisson curve with rate = median count rate of data. |
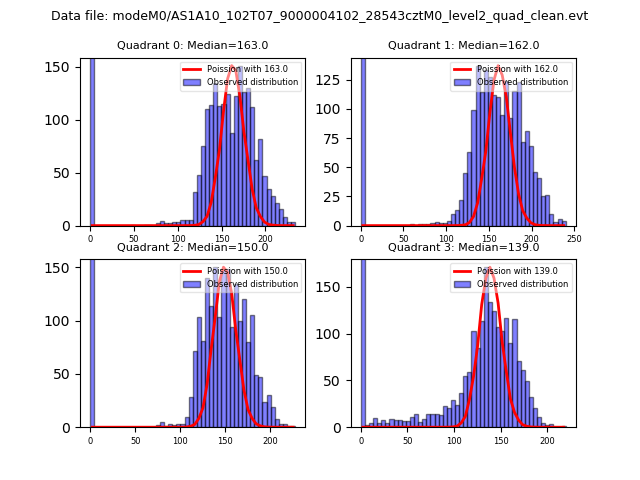 |
 |
| Quadrant-wise count rates Data is divided into 100 sec bins |
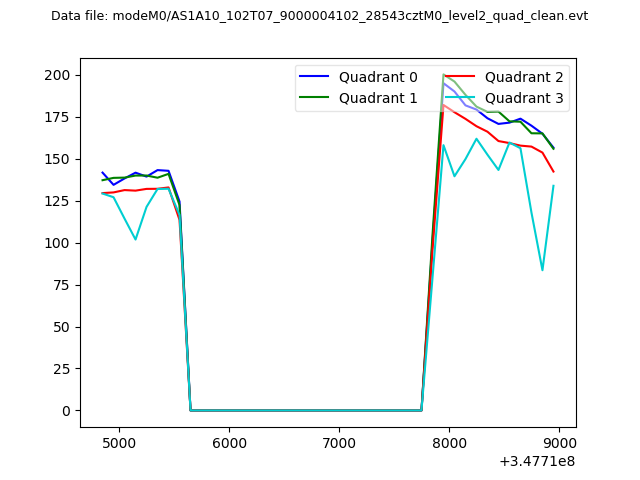 |
|
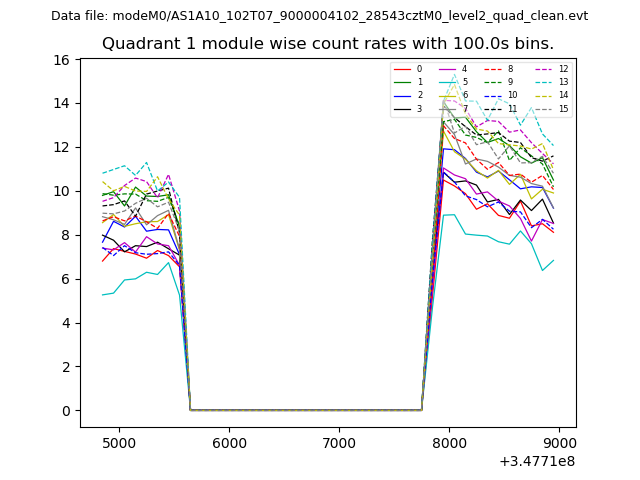
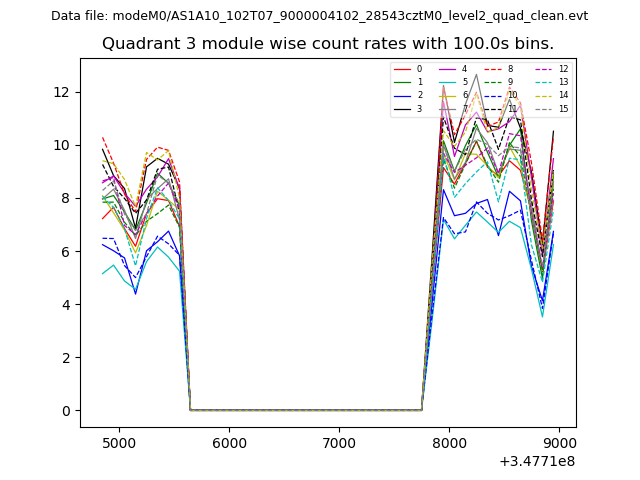
| Module-wise count rates for Quadrant A Data is divided into 100 sec bins |
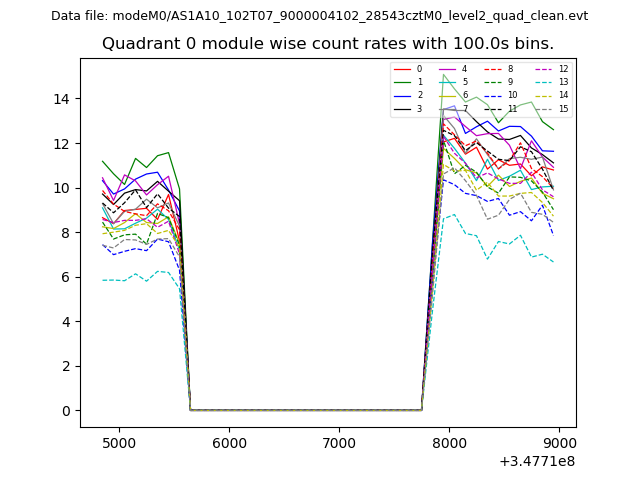 |
 |
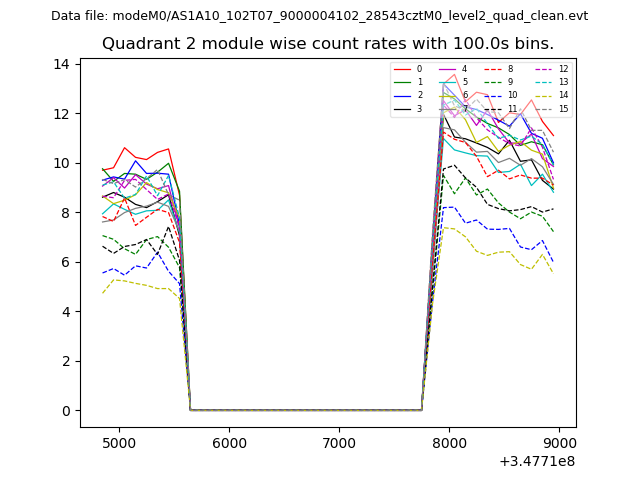
| Module-wise count rates for Quadrant B Data is divided into 100 sec bins |
 |
 |
| Module-wise count rates for Quadrant C Data is divided into 100 sec bins |
 |
 |
| Module-wise count rates for Quadrant D Data is divided into 100 sec bins |
 |
 |
| Parameter | Plot |
|---|---|
| CZT HV Monitor | 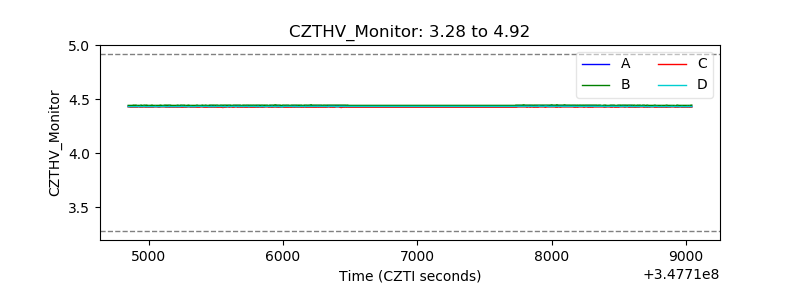 |
| D_VDD | 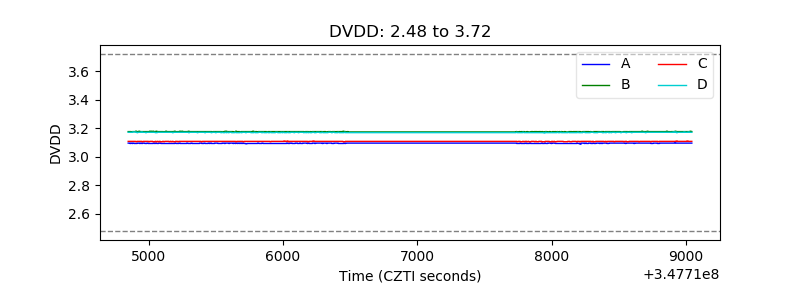 |
| Temperature 1 | 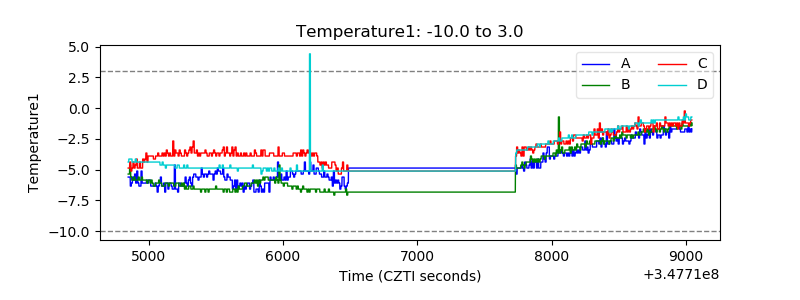 |
| Veto HV Monitor | 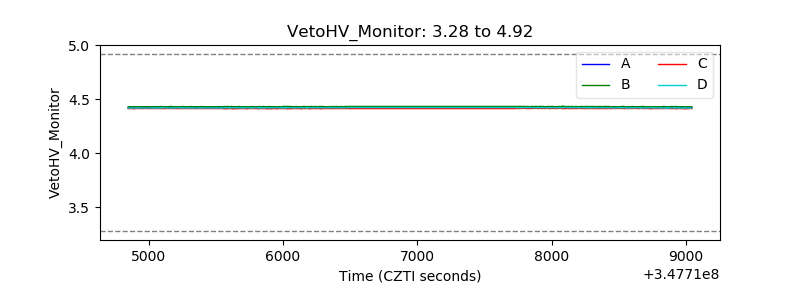 |
| Veto LLD | 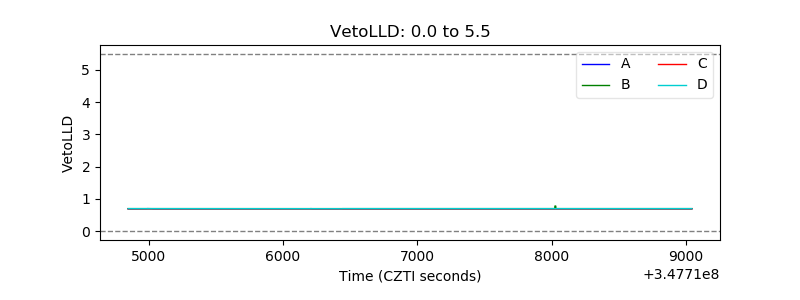 |
| Alpha Counter | 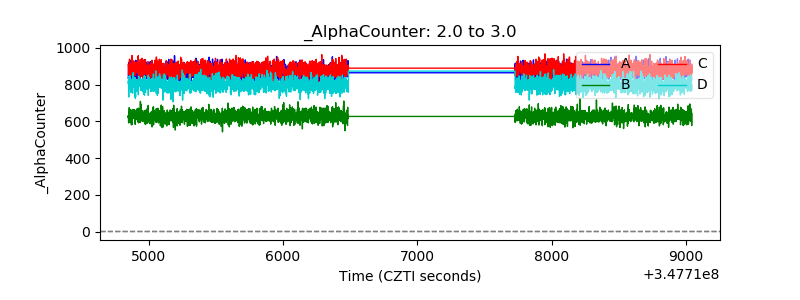 |
| _CPM_Rate | 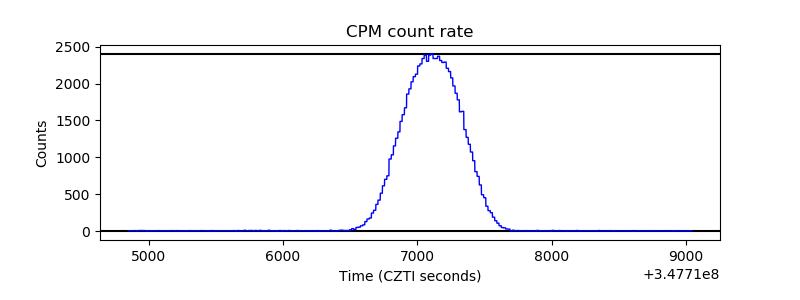 |
| CZT Counter | 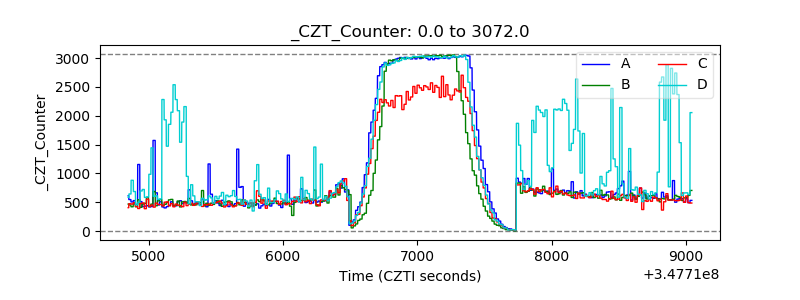 |
| +2.5 Volts monitor |  |
| +5 Volts monitor | 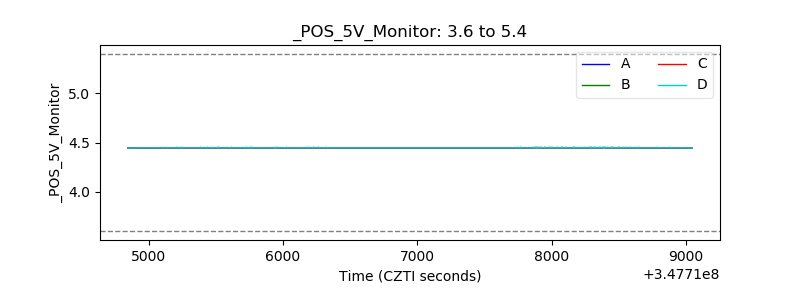 |
| _ROLL_ROT | 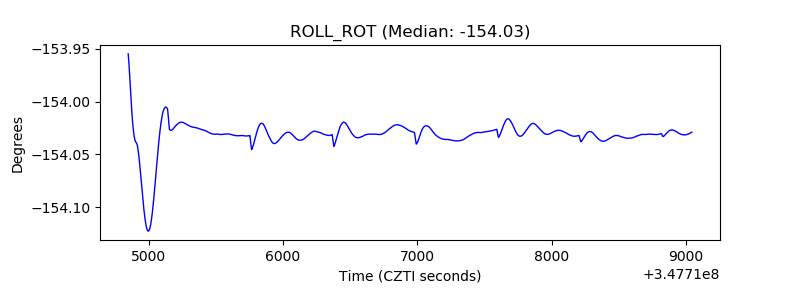 |
| _Roll_DEC | 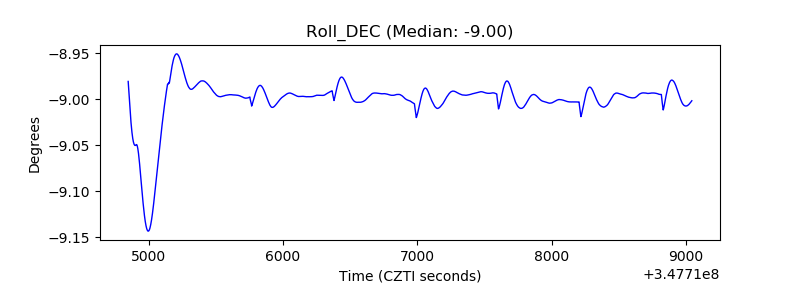 |
| _Roll_RA | 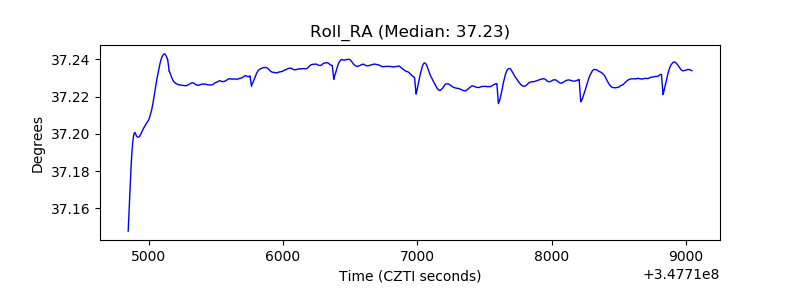 |
| Veto Counter | 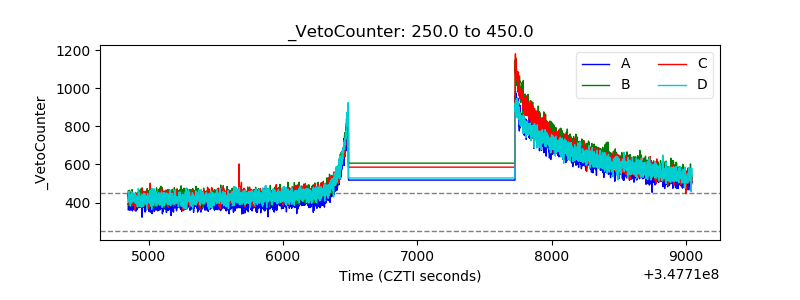 |