| Param | Original file | Final file |
|---|---|---|
| Filename | modeM0/AS1A10_102T07_9000004102_28544cztM0_level2.evt | modeM0/AS1A10_102T07_9000004102_28544cztM0_level2_quad_clean.evt |
| Size (bytes) | 578,793,600 | 108,313,920 |
| Size | 552.0 MB | 103.3 MB |
| Events in quadrant A | 3,500,691 | 761,079 |
| Events in quadrant B | 3,513,911 | 759,069 |
| Events in quadrant C | 3,146,407 | 704,744 |
| Events in quadrant D | 6,969,428 | 643,966 |
| Mode M0 | |||
|---|---|---|---|
| Quadrant | BADHDUFLAG | Total packets | Discarded packets |
| A | 0 | 14279 | 1 |
| B | 0 | 14197 | 1 |
| C | 0 | 13051 | 1 |
| D | 0 | 24896 | 1 |
| Mode SS | |||
|---|---|---|---|
| Quadrant | BADHDUFLAG | Total packets | Discarded packets |
| A | 0 | 120 | 0 |
| B | 0 | 120 | 0 |
| C | 0 | 120 | 0 |
| D | 0 | 120 | 0 |
| Mode M9 | |||
|---|---|---|---|
| Quadrant | BADHDUFLAG | Total packets | Discarded packets |
| A | 0 | 12 | 0 |
| B | 0 | 12 | 0 |
| C | 0 | 12 | 0 |
| D | 0 | 12 | 0 |
| Quadrant | Total seconds | Saturated seconds | Saturation percentage |
|---|---|---|---|
| A | 5885 | 107 | 1.818182% |
| B | 5886 | 216 | 3.669725% |
| C | 5886 | 120 | 2.038736% |
| D | 5886 | 937 | 15.919130% |
Noise dominated data is calculated using 1-second bins in cleaned event files. If a bin has >2000 counts, and if more than 50% of those come from <1% of pixels, then it is considered to be noise-dominated and hence unusable.
| Quadrant | # 1 sec bins | Bins with >0 counts | Bins with >2000 counts | High rate bins dominated by noise | Noise dominated (total time) | Noise dominated (detector-on time) | Marked lightcurve |
|---|---|---|---|---|---|---|---|
| A | 7160 | 5885 | 13 | 13 | 0.18% | 0.22% | 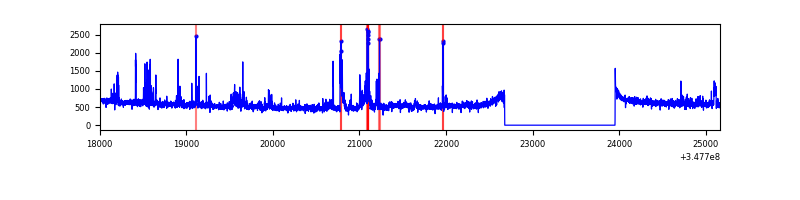 |
| B | 7161 | 5886 | 31 | 31 | 0.43% | 0.53% | 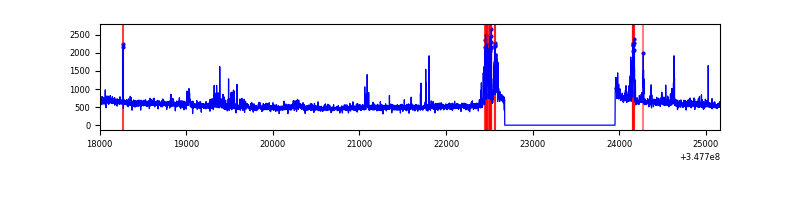 |
| C | 7161 | 5886 | 0 | 0 | 0.00% | 0.00% | 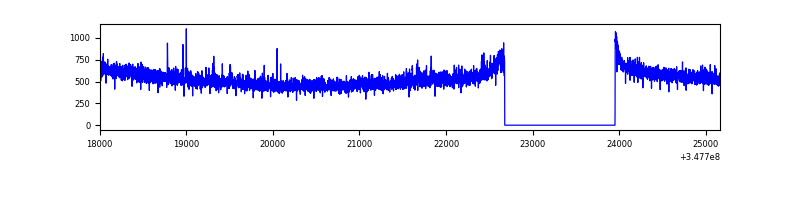 |
| D | 7161 | 5886 | 996 | 996 | 13.91% | 16.92% | 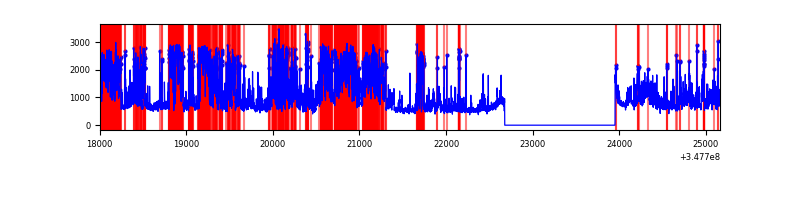 |
Top three noisy pixels from each quadrant. If the there are fewer than three noisy pixels in the level2.evt file, extra rows are filled as -1
| Pixel properties | Quadrant properties | ||||||
|---|---|---|---|---|---|---|---|
| Quadrant | DetID | PixID | Counts | Sigma | Mean | Median | Sigma |
| A | 15 | 174 | 324651 | 1985.8 | 822 | 809 | 163.1 |
| A | 13 | 254 | 11558 | 65.91 | 822 | 809 | 163.1 |
| A | 3 | 137 | 7418 | 40.53 | 822 | 809 | 163.1 |
| B | 10 | 245 | 280461 | 1847.91 | 799 | 784 | 151.3 |
| B | 0 | 230 | 61504 | 401.19 | 799 | 784 | 151.3 |
| B | 12 | 111 | 17803 | 112.45 | 799 | 784 | 151.3 |
| C | 14 | 238 | 126404 | 713.56 | 758 | 764 | 176.1 |
| C | 3 | 233 | 30727 | 170.17 | 758 | 764 | 176.1 |
| C | 7 | 247 | 28455 | 157.27 | 758 | 764 | 176.1 |
| D | 1 | 52 | 2523417 | 14167.53 | 744 | 723 | 178.1 |
| D | 8 | 195 | 1414188 | 7938.07 | 744 | 723 | 178.1 |
| D | 2 | 250 | 142428 | 795.82 | 744 | 723 | 178.1 |
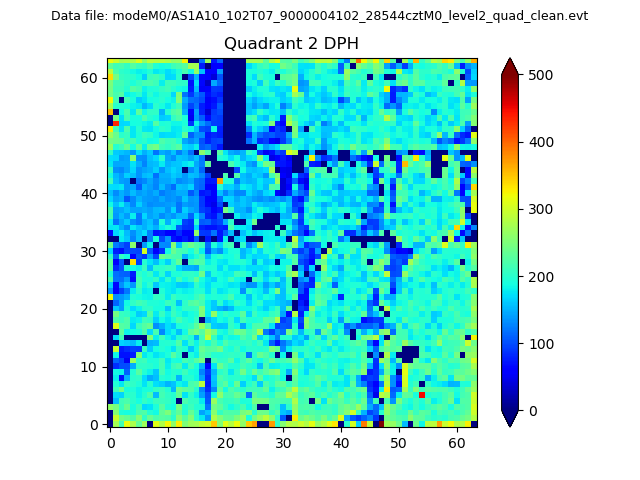
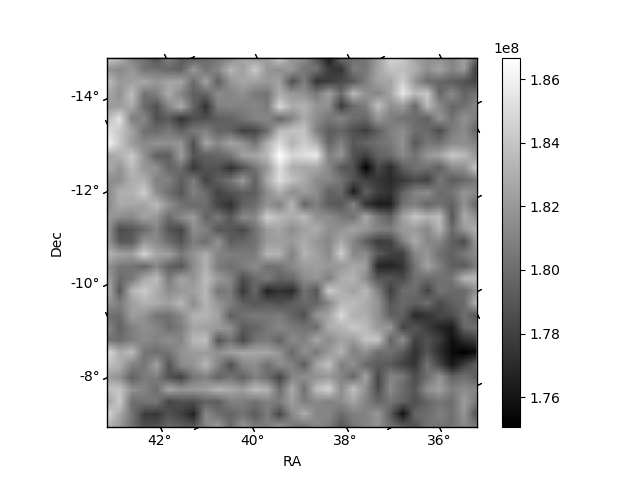
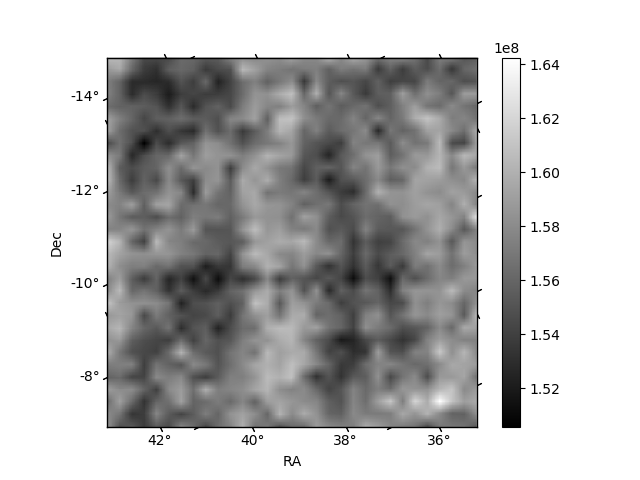
Histogram calculated using DETX and DETY for each event in the final _common_clean file
| Quadrant A | 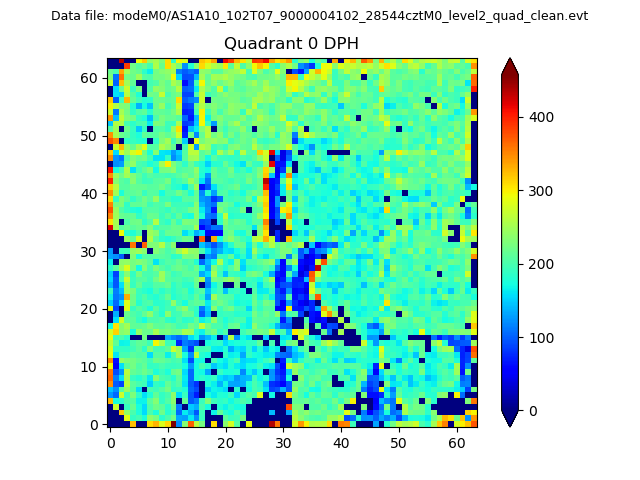 |
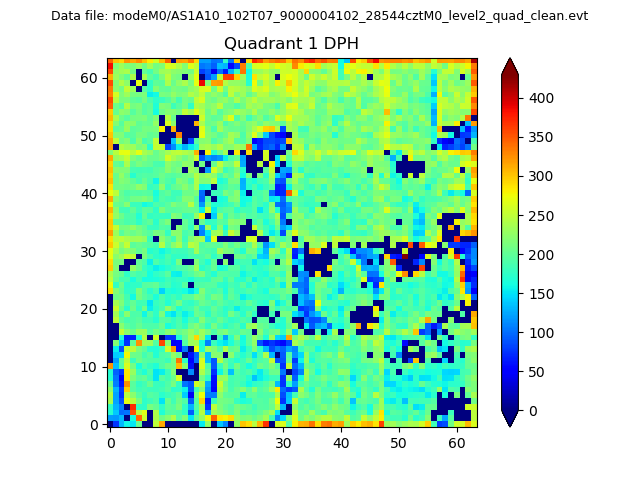 |
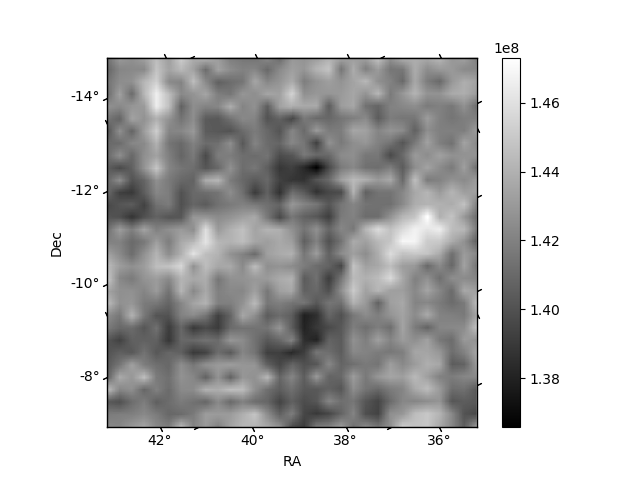
Quadrant B |
|---|---|---|---|
| Quadrant D | 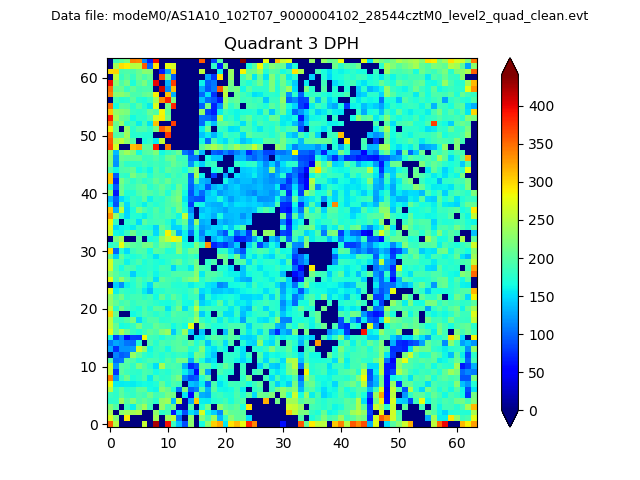 |
 |
Quadrant C |
| Plot type | Count rate plots | Images |
|---|---|---|
| Comparison with Poisson distribution Blue bars denote a histogram of data divided into 1 sec bins. Red curve is a Poisson curve with rate = median count rate of data. |
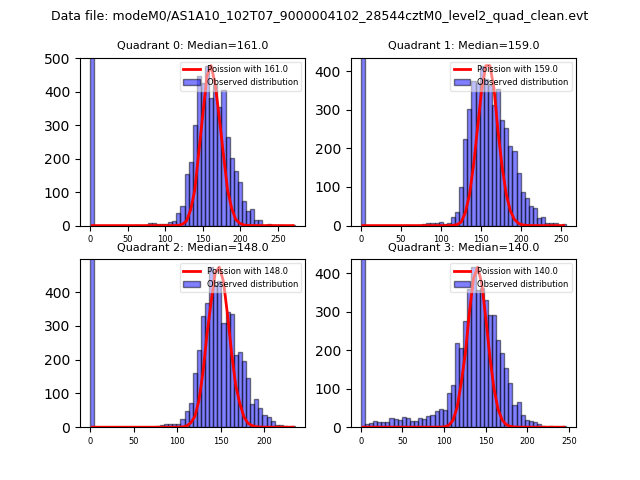 |
 |
| Quadrant-wise count rates Data is divided into 100 sec bins |
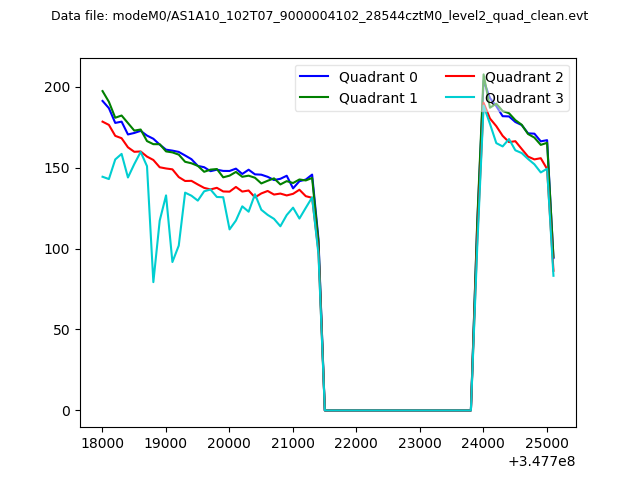 |
|
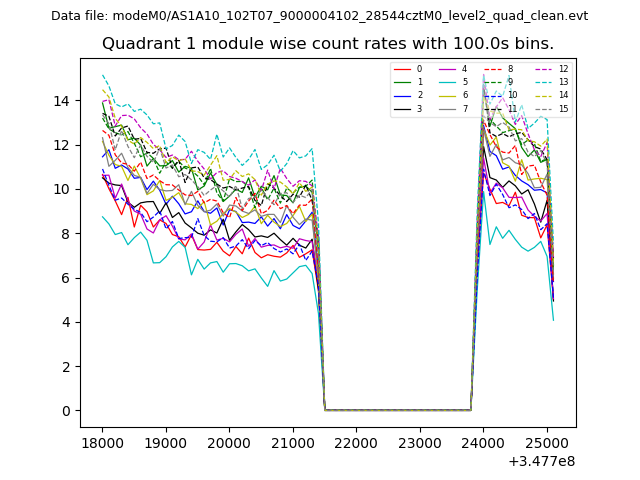
| Module-wise count rates for Quadrant A Data is divided into 100 sec bins |
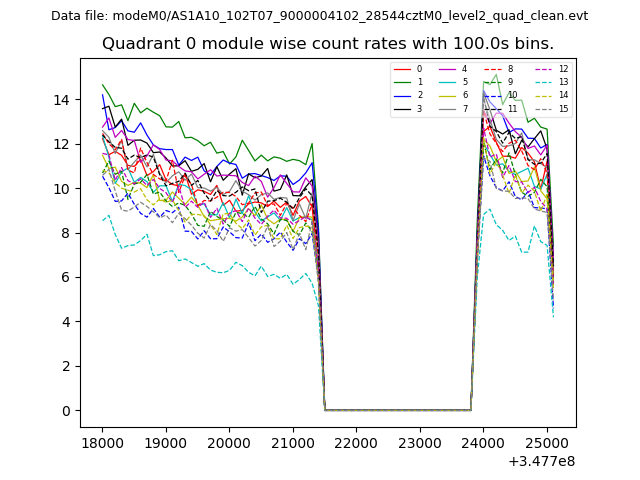 |
 |
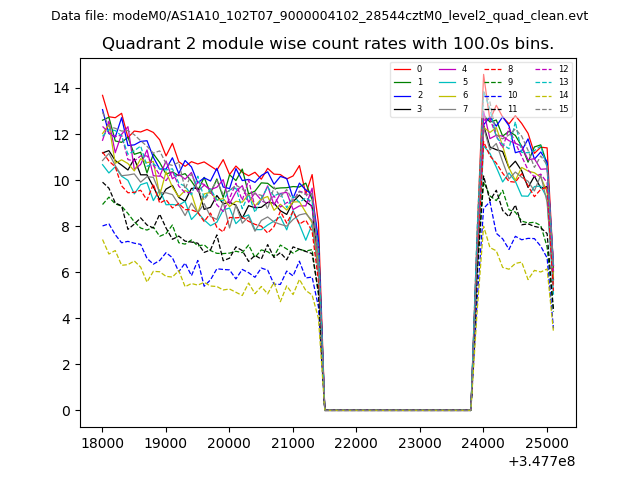
| Module-wise count rates for Quadrant B Data is divided into 100 sec bins |
 |
 |
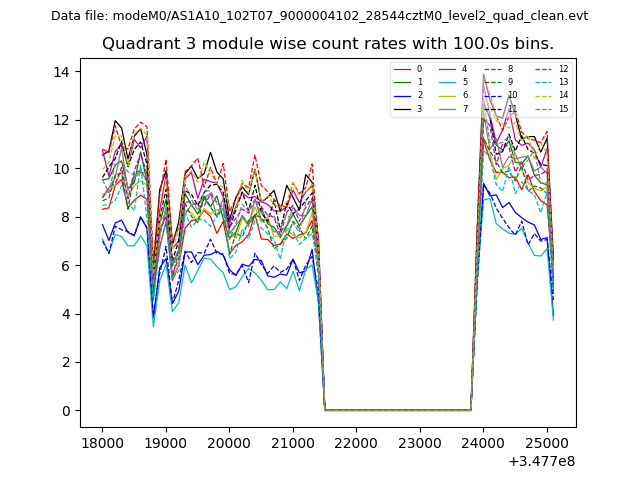
| Module-wise count rates for Quadrant C Data is divided into 100 sec bins |
 |
 |
| Module-wise count rates for Quadrant D Data is divided into 100 sec bins |
 |
 |
| Parameter | Plot |
|---|---|
| CZT HV Monitor | 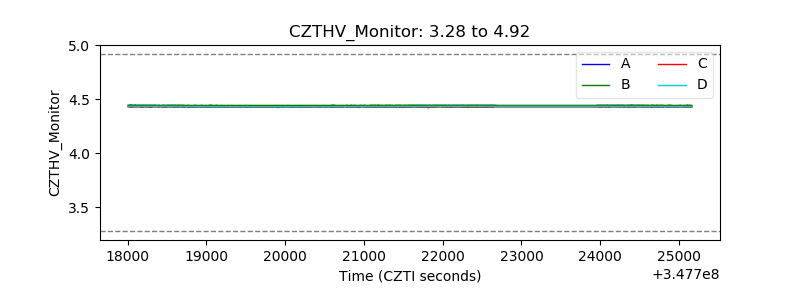 |
| D_VDD | 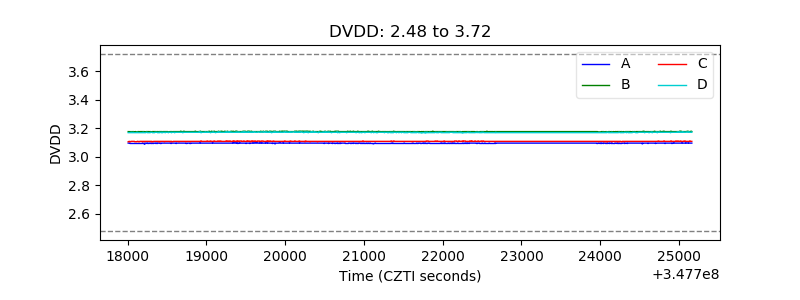 |
| Temperature 1 | 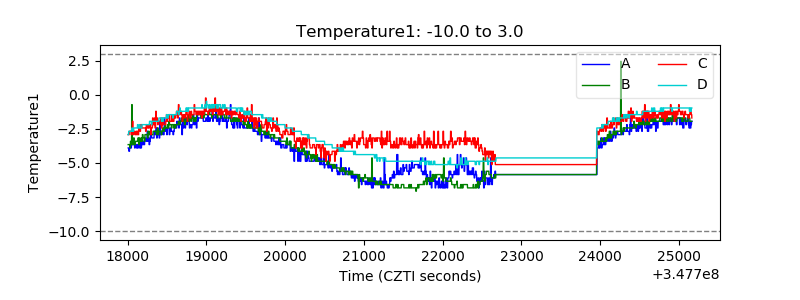 |
| Veto HV Monitor | 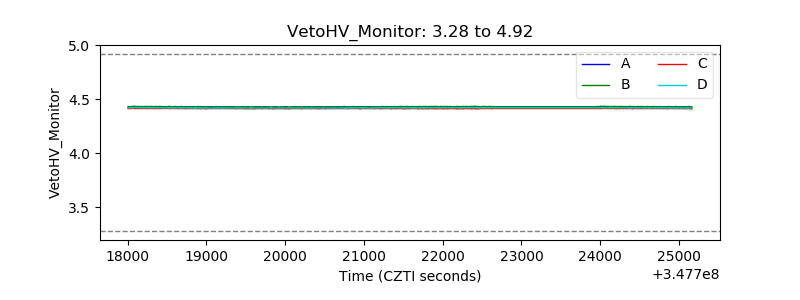 |
| Veto LLD | 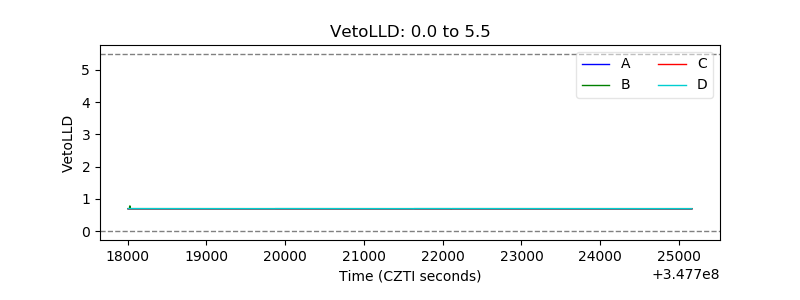 |
| Alpha Counter | 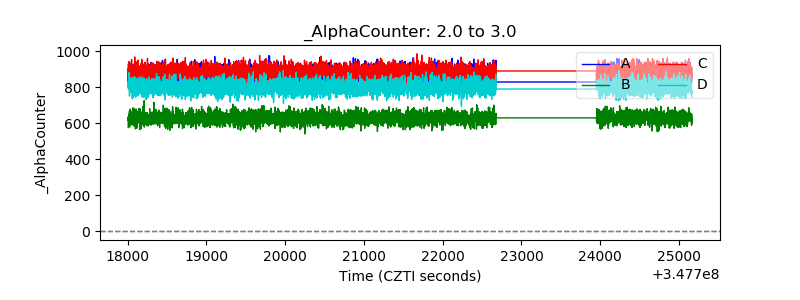 |
| _CPM_Rate | 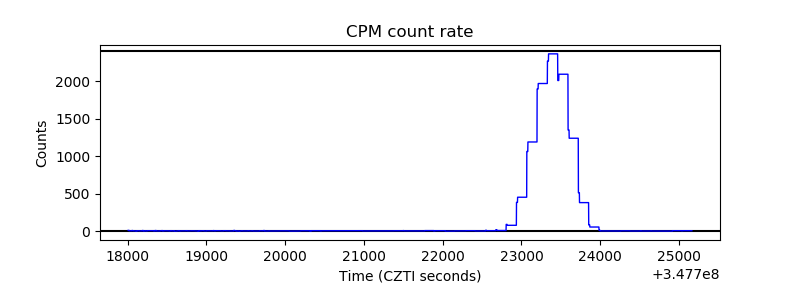 |
| CZT Counter | 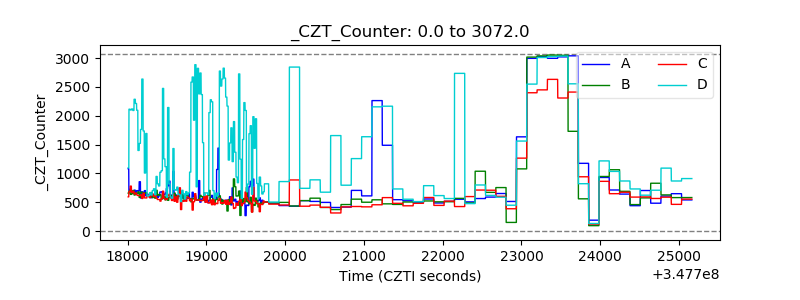 |
| +2.5 Volts monitor |  |
| +5 Volts monitor |  |
| _ROLL_ROT | 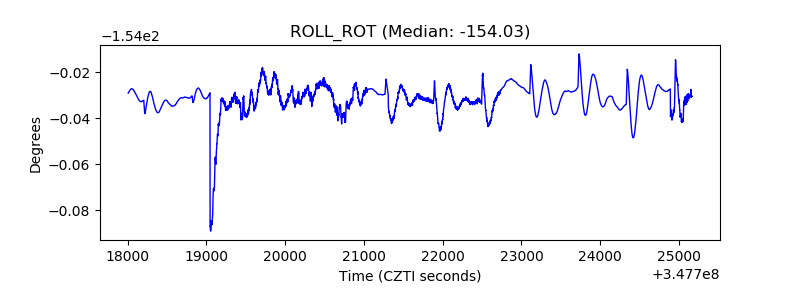 |
| _Roll_DEC | 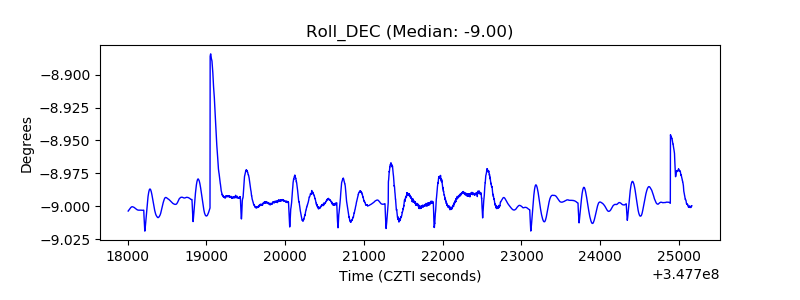 |
| _Roll_RA | 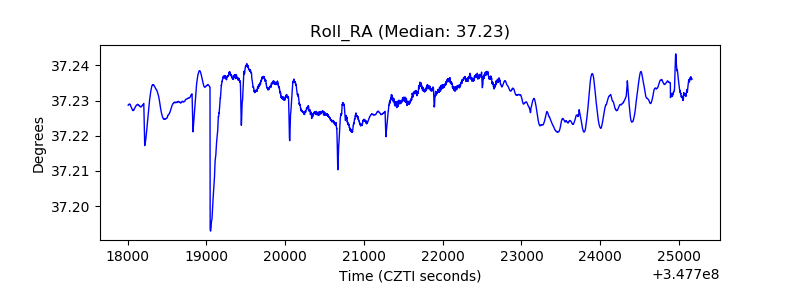 |
| Veto Counter | 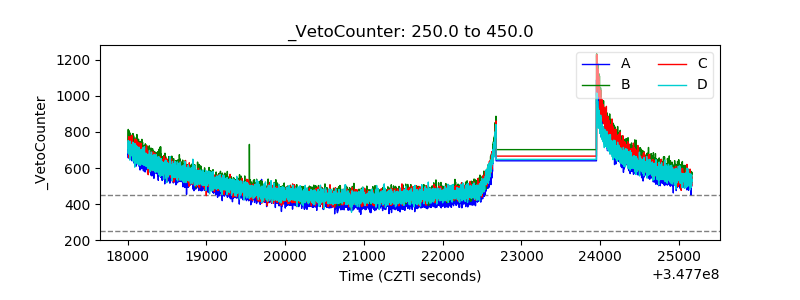 |