| Param | Original file | Final file |
|---|---|---|
| Filename | modeM0/AS1A10_102T07_9000004102_28546cztM0_level2.evt | modeM0/AS1A10_102T07_9000004102_28546cztM0_level2_quad_clean.evt |
| Size (bytes) | 578,937,600 | 94,521,600 |
| Size | 552.1 MB | 90.1 MB |
| Events in quadrant A | 3,624,922 | 637,074 |
| Events in quadrant B | 3,412,172 | 640,201 |
| Events in quadrant C | 3,406,546 | 593,120 |
| Events in quadrant D | 6,651,021 | 540,271 |
| Mode M0 | |||
|---|---|---|---|
| Quadrant | BADHDUFLAG | Total packets | Discarded packets |
| A | 0 | 14760 | 2 |
| B | 0 | 14172 | 1 |
| C | 0 | 13969 | 1 |
| D | 0 | 24247 | 1 |
| Mode SS | |||
|---|---|---|---|
| Quadrant | BADHDUFLAG | Total packets | Discarded packets |
| A | 0 | 132 | 0 |
| B | 0 | 132 | 0 |
| C | 0 | 132 | 0 |
| D | 0 | 132 | 0 |
| Mode M9 | |||
|---|---|---|---|
| Quadrant | BADHDUFLAG | Total packets | Discarded packets |
| A | 0 | 11 | 0 |
| B | 0 | 11 | 0 |
| C | 0 | 11 | 0 |
| D | 0 | 11 | 0 |
| Quadrant | Total seconds | Saturated seconds | Saturation percentage |
|---|---|---|---|
| A | 6470 | 144 | 2.225657% |
| B | 6471 | 154 | 2.379849% |
| C | 6471 | 128 | 1.978056% |
| D | 6471 | 840 | 12.980992% |
Noise dominated data is calculated using 1-second bins in cleaned event files. If a bin has >2000 counts, and if more than 50% of those come from <1% of pixels, then it is considered to be noise-dominated and hence unusable.
| Quadrant | # 1 sec bins | Bins with >0 counts | Bins with >2000 counts | High rate bins dominated by noise | Noise dominated (total time) | Noise dominated (detector-on time) | Marked lightcurve |
|---|---|---|---|---|---|---|---|
| A | 7610 | 6470 | 30 | 30 | 0.39% | 0.46% | 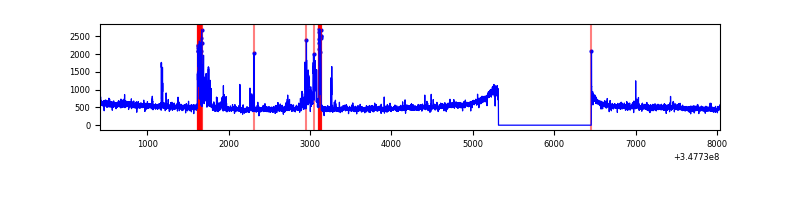 |
| B | 7611 | 6471 | 3 | 3 | 0.04% | 0.05% | 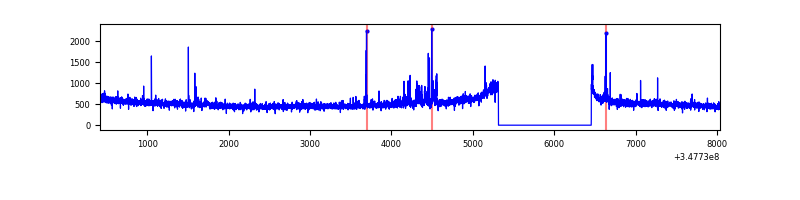 |
| C | 7611 | 6471 | 1 | 1 | 0.01% | 0.02% | 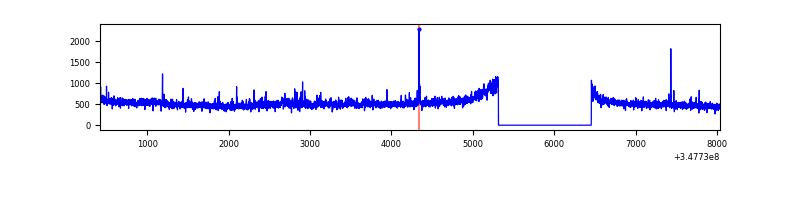 |
| D | 7611 | 6471 | 825 | 825 | 10.84% | 12.75% | 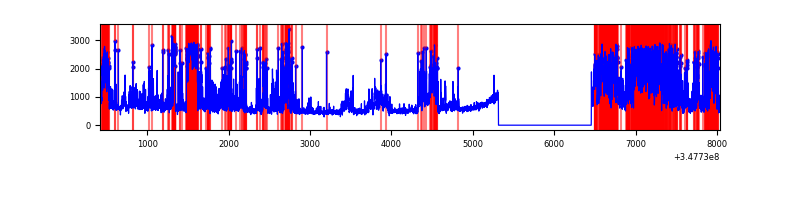 |
Top three noisy pixels from each quadrant. If the there are fewer than three noisy pixels in the level2.evt file, extra rows are filled as -1
| Pixel properties | Quadrant properties | ||||||
|---|---|---|---|---|---|---|---|
| Quadrant | DetID | PixID | Counts | Sigma | Mean | Median | Sigma |
| A | 15 | 174 | 337193 | 1981.65 | 847 | 833 | 169.7 |
| A | 13 | 254 | 13452 | 74.34 | 847 | 833 | 169.7 |
| A | 5 | 168 | 10933 | 59.5 | 847 | 833 | 169.7 |
| B | 10 | 245 | 90913 | 564.05 | 835 | 817 | 159.7 |
| B | 0 | 230 | 29633 | 180.4 | 835 | 817 | 159.7 |
| B | 12 | 111 | 19120 | 114.58 | 835 | 817 | 159.7 |
| C | 7 | 247 | 140099 | 748.94 | 793 | 799 | 186.0 |
| C | 14 | 238 | 133928 | 715.76 | 793 | 799 | 186.0 |
| C | 3 | 233 | 35489 | 186.51 | 793 | 799 | 186.0 |
| D | 1 | 52 | 2528960 | 13822.73 | 775 | 757 | 182.9 |
| D | 8 | 195 | 868853 | 4746.24 | 775 | 757 | 182.9 |
| D | 2 | 250 | 211690 | 1153.26 | 775 | 757 | 182.9 |
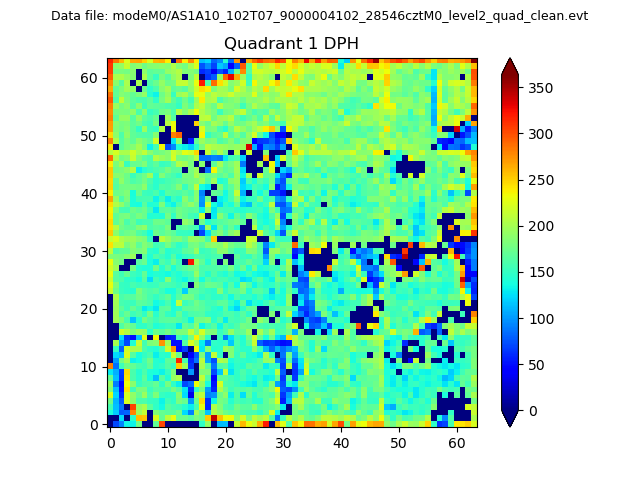
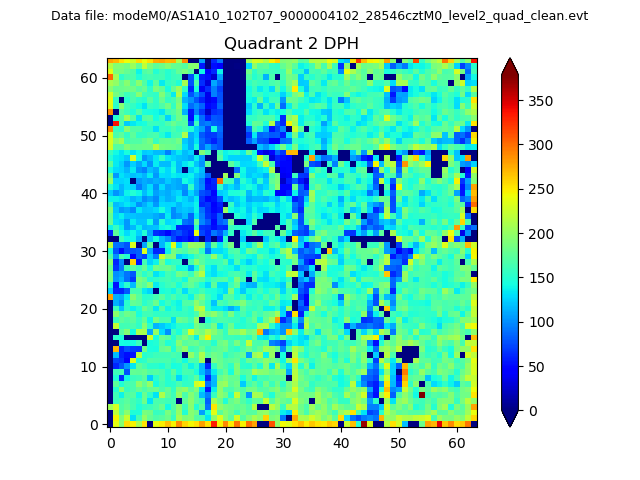
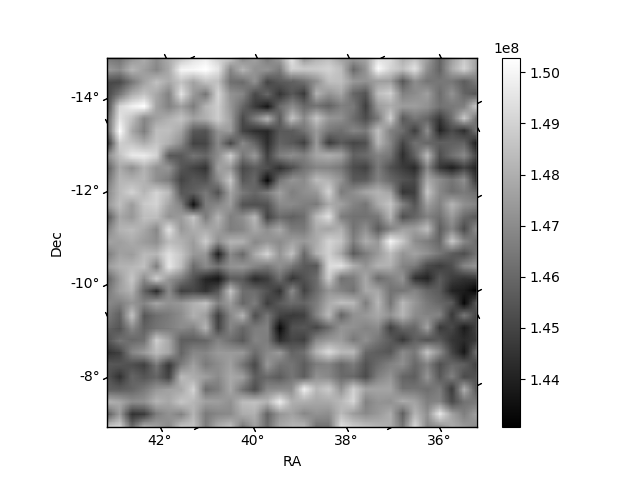
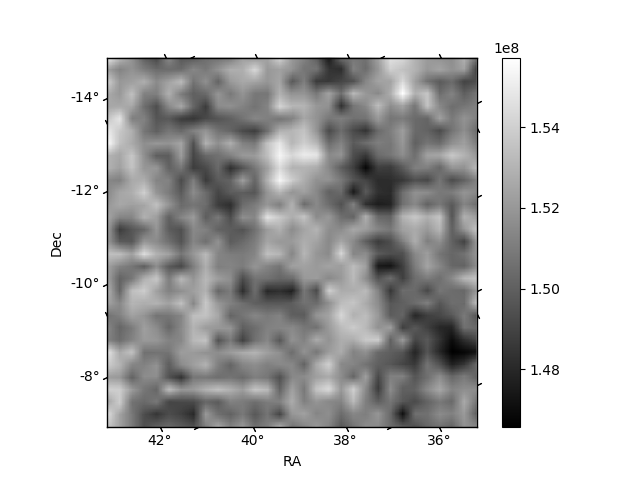
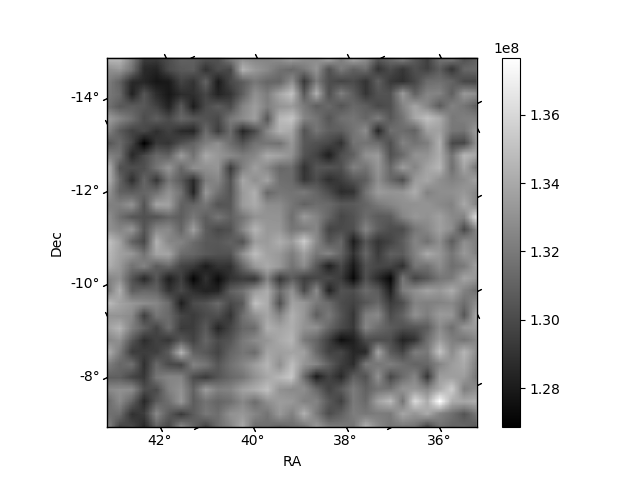
Histogram calculated using DETX and DETY for each event in the final _common_clean file
| Quadrant A |  |
 |
Quadrant B |
|---|---|---|---|
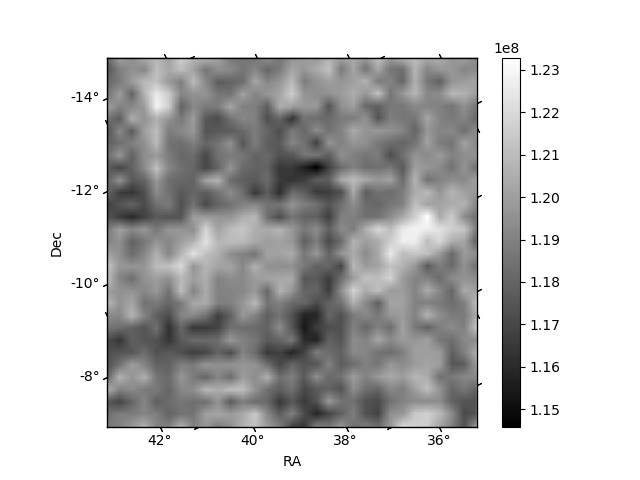
| Quadrant D | 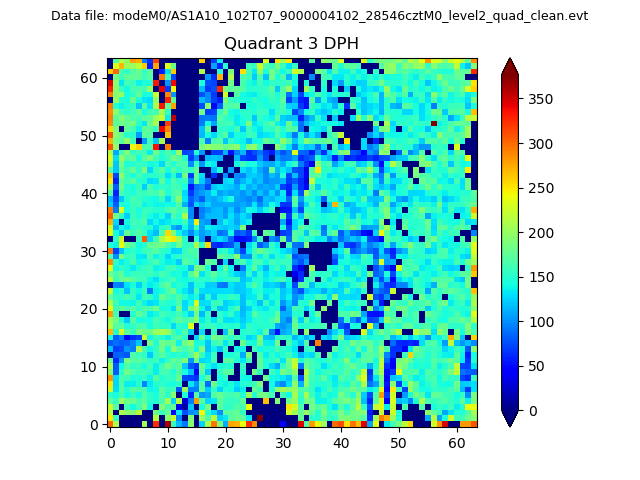 |
 |
Quadrant C |
| Plot type | Count rate plots | Images |
|---|---|---|
| Comparison with Poisson distribution Blue bars denote a histogram of data divided into 1 sec bins. Red curve is a Poisson curve with rate = median count rate of data. |
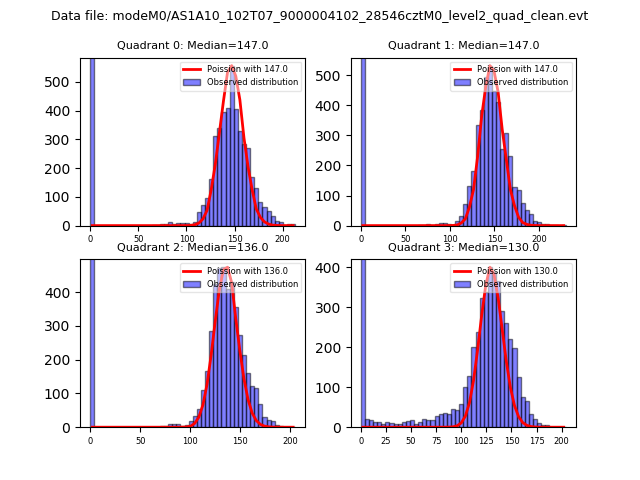 |
 |
| Quadrant-wise count rates Data is divided into 100 sec bins |
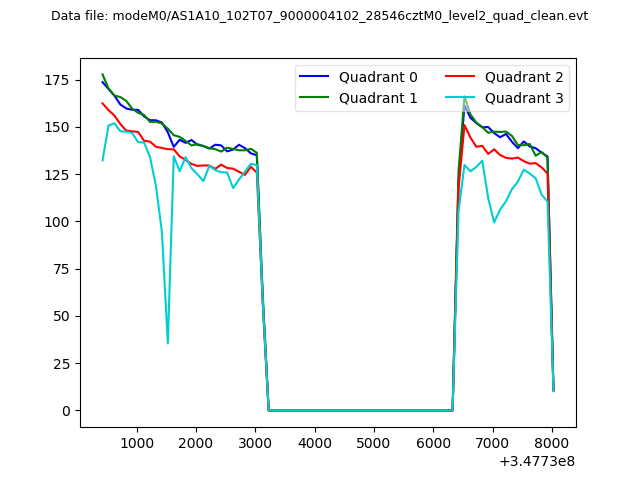 |
|
| Module-wise count rates for Quadrant A Data is divided into 100 sec bins |
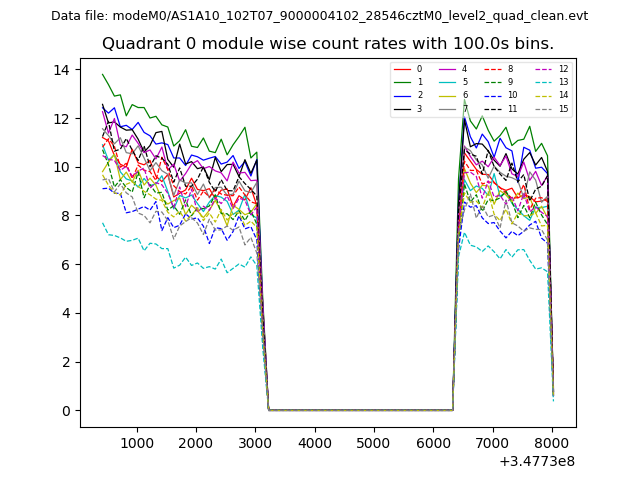 |
 |
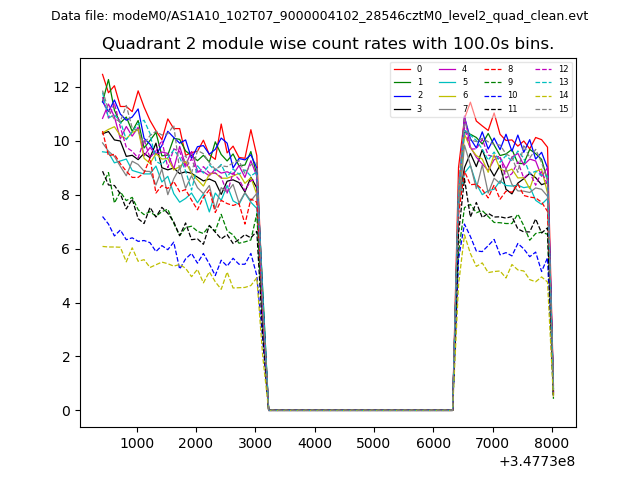
| Module-wise count rates for Quadrant B Data is divided into 100 sec bins |
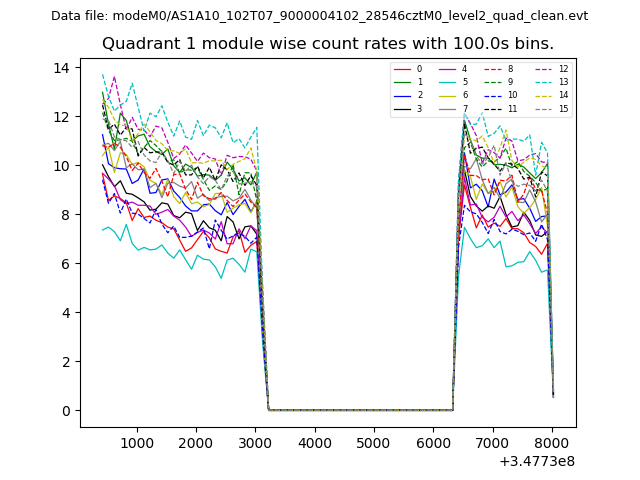 |
 |
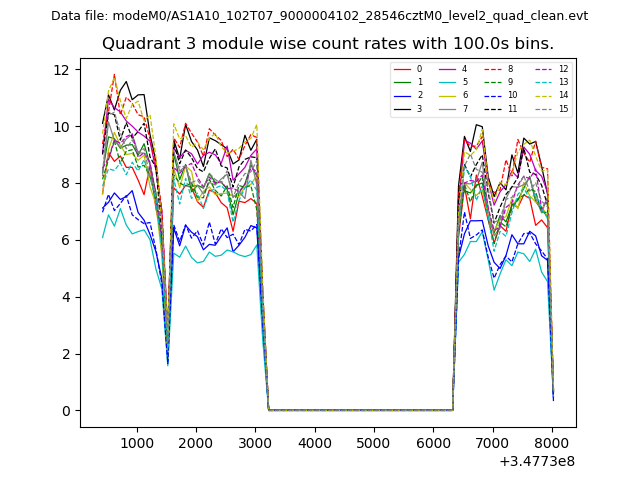
| Module-wise count rates for Quadrant C Data is divided into 100 sec bins |
 |
 |
| Module-wise count rates for Quadrant D Data is divided into 100 sec bins |
 |
 |
| Parameter | Plot |
|---|---|
| CZT HV Monitor | 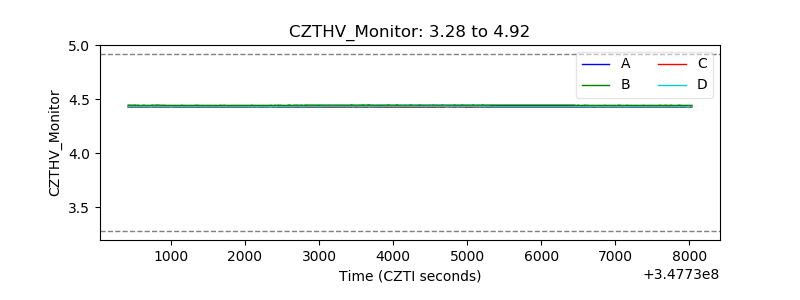 |
| D_VDD | 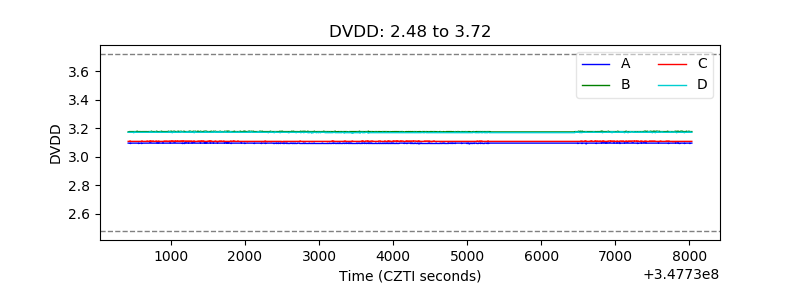 |
| Temperature 1 | 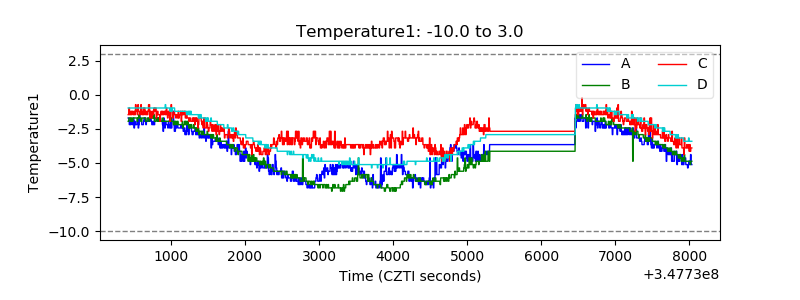 |
| Veto HV Monitor | 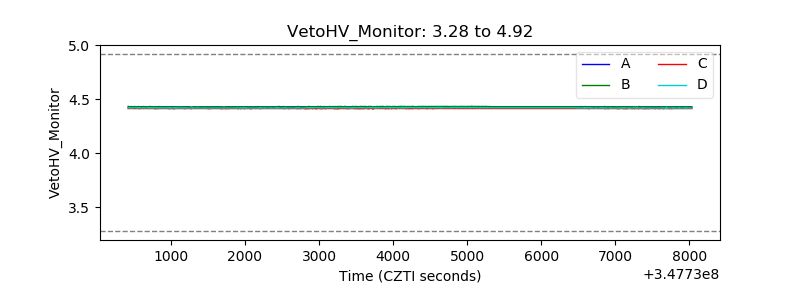 |
| Veto LLD |  |
| Alpha Counter | 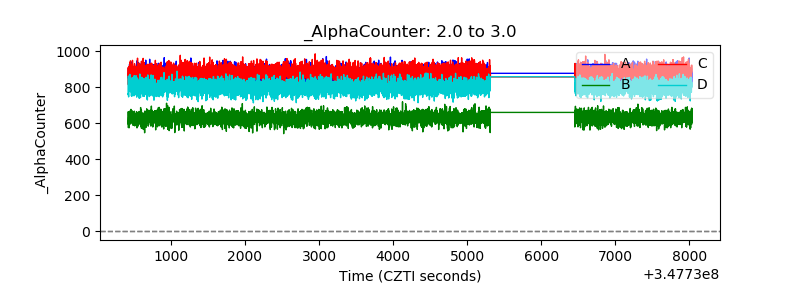 |
| _CPM_Rate | 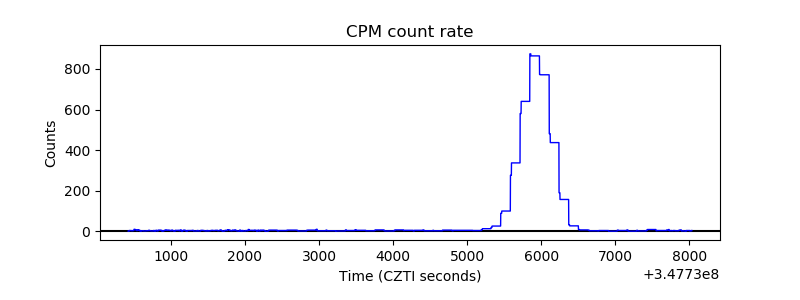 |
| CZT Counter | 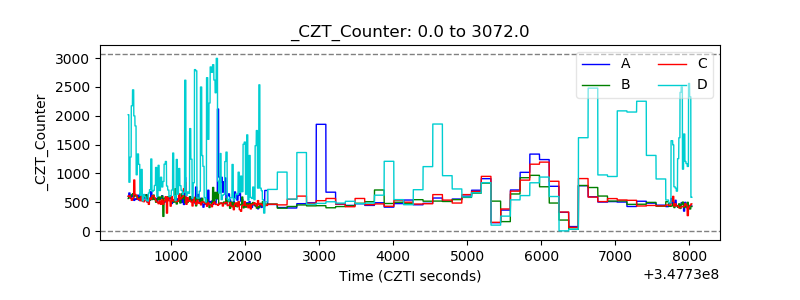 |
| +2.5 Volts monitor |  |
| +5 Volts monitor | 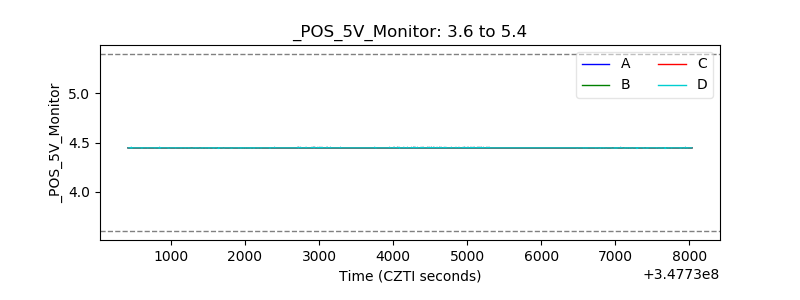 |
| _ROLL_ROT | 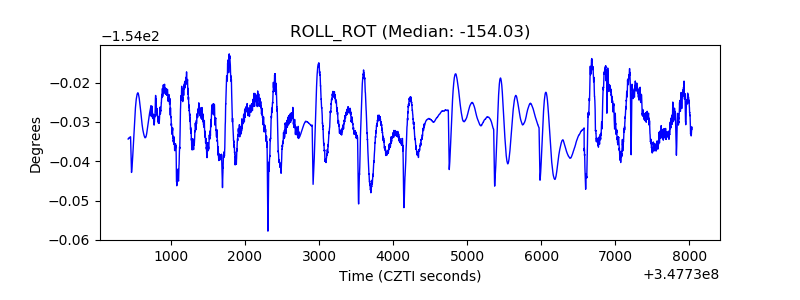 |
| _Roll_DEC | 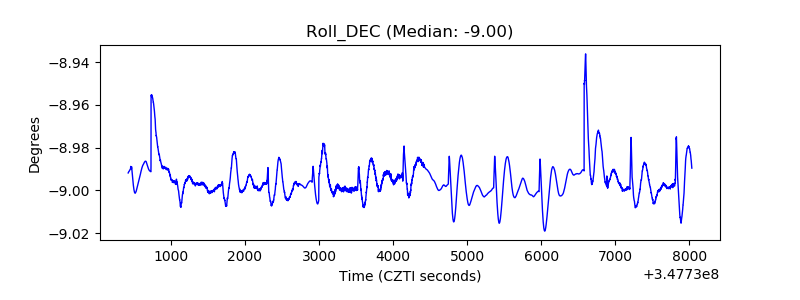 |
| _Roll_RA |  |
| Veto Counter | 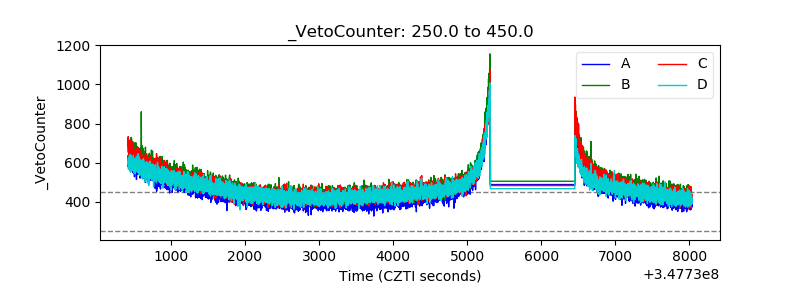 |