| Param | Original file | Final file |
|---|---|---|
| Filename | modeM0/AS1A10_102T07_9000004102_28547cztM0_level2.evt | modeM0/AS1A10_102T07_9000004102_28547cztM0_level2_quad_clean.evt |
| Size (bytes) | 595,549,440 | 93,176,640 |
| Size | 568.0 MB | 88.9 MB |
| Events in quadrant A | 4,010,673 | 608,696 |
| Events in quadrant B | 3,515,686 | 620,652 |
| Events in quadrant C | 3,382,802 | 582,954 |
| Events in quadrant D | 6,674,295 | 542,853 |
| Mode M0 | |||
|---|---|---|---|
| Quadrant | BADHDUFLAG | Total packets | Discarded packets |
| A | 0 | 16149 | 2 |
| B | 0 | 14586 | 2 |
| C | 0 | 14263 | 2 |
| D | 0 | 24423 | 2 |
| Mode SS | |||
|---|---|---|---|
| Quadrant | BADHDUFLAG | Total packets | Discarded packets |
| A | 0 | 136 | 0 |
| B | 0 | 136 | 0 |
| C | 0 | 136 | 0 |
| D | 0 | 136 | 0 |
| Mode M9 | |||
|---|---|---|---|
| Quadrant | BADHDUFLAG | Total packets | Discarded packets |
| A | 0 | 9 | 0 |
| B | 0 | 9 | 0 |
| C | 0 | 9 | 0 |
| D | 0 | 9 | 0 |
| Quadrant | Total seconds | Saturated seconds | Saturation percentage |
|---|---|---|---|
| A | 6687 | 214 | 3.200239% |
| B | 6688 | 97 | 1.450359% |
| C | 6688 | 101 | 1.510167% |
| D | 6688 | 760 | 11.363636% |
Noise dominated data is calculated using 1-second bins in cleaned event files. If a bin has >2000 counts, and if more than 50% of those come from <1% of pixels, then it is considered to be noise-dominated and hence unusable.
| Quadrant | # 1 sec bins | Bins with >0 counts | Bins with >2000 counts | High rate bins dominated by noise | Noise dominated (total time) | Noise dominated (detector-on time) | Marked lightcurve |
|---|---|---|---|---|---|---|---|
| A | 7587 | 6687 | 125 | 125 | 1.65% | 1.87% | 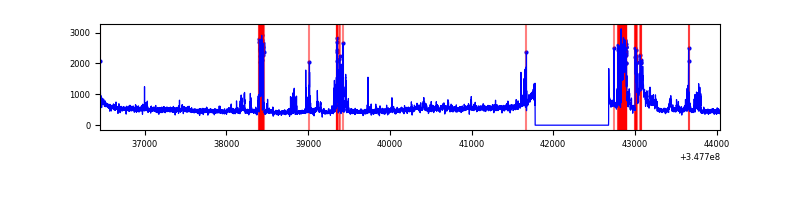 |
| B | 7588 | 6688 | 4 | 4 | 0.05% | 0.06% | 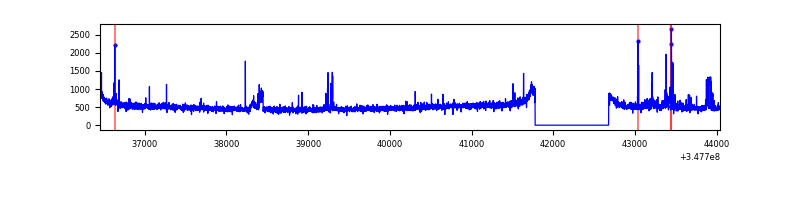 |
| C | 7588 | 6688 | 0 | 0 | 0.00% | 0.00% | 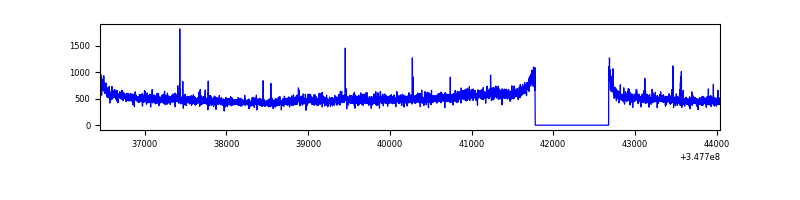 |
| D | 7588 | 6688 | 823 | 823 | 10.85% | 12.31% | 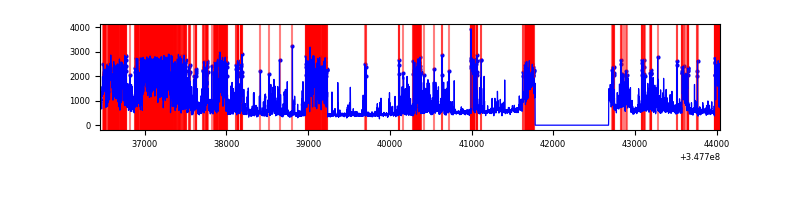 |
Top three noisy pixels from each quadrant. If the there are fewer than three noisy pixels in the level2.evt file, extra rows are filled as -1
| Pixel properties | Quadrant properties | ||||||
|---|---|---|---|---|---|---|---|
| Quadrant | DetID | PixID | Counts | Sigma | Mean | Median | Sigma |
| A | 14 | 238 | 581449 | 3438.3 | 840 | 825 | 168.9 |
| A | 15 | 174 | 180159 | 1061.97 | 840 | 825 | 168.9 |
| A | 13 | 254 | 13060 | 72.45 | 840 | 825 | 168.9 |
| B | 4 | 80 | 110860 | 684.16 | 839 | 818 | 160.8 |
| B | 10 | 245 | 56699 | 347.43 | 839 | 818 | 160.8 |
| B | 0 | 230 | 38364 | 233.43 | 839 | 818 | 160.8 |
| C | 14 | 238 | 128725 | 674.5 | 800 | 805 | 189.7 |
| C | 7 | 247 | 106352 | 556.53 | 800 | 805 | 189.7 |
| C | 3 | 233 | 22255 | 113.1 | 800 | 805 | 189.7 |
| D | 1 | 52 | 2394802 | 12690.59 | 782 | 758 | 188.6 |
| D | 8 | 195 | 1078358 | 5712.25 | 782 | 758 | 188.6 |
| D | 2 | 250 | 128156 | 675.32 | 782 | 758 | 188.6 |
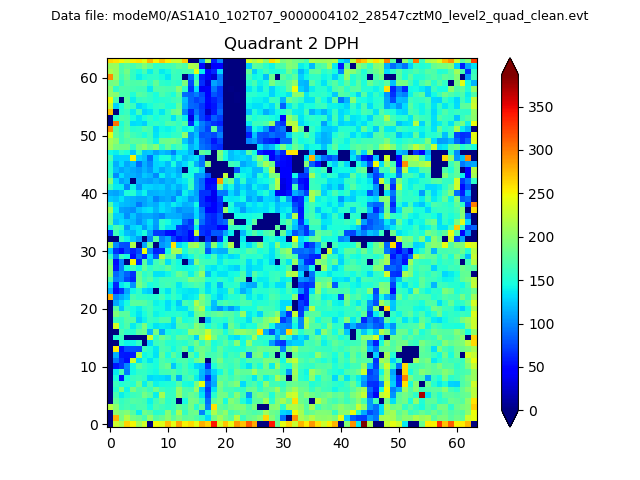
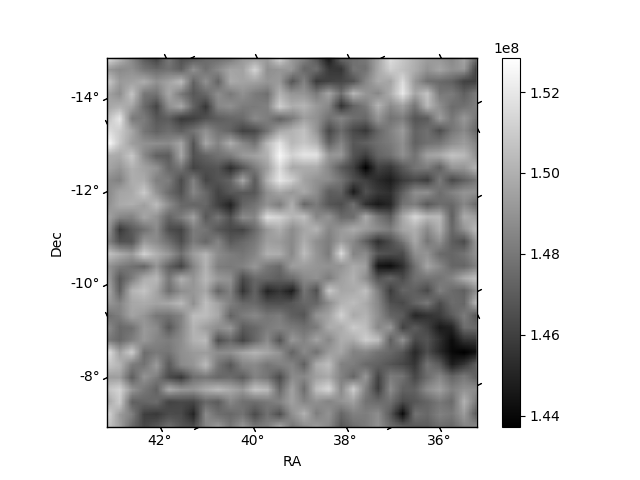
Histogram calculated using DETX and DETY for each event in the final _common_clean file
| Quadrant A | 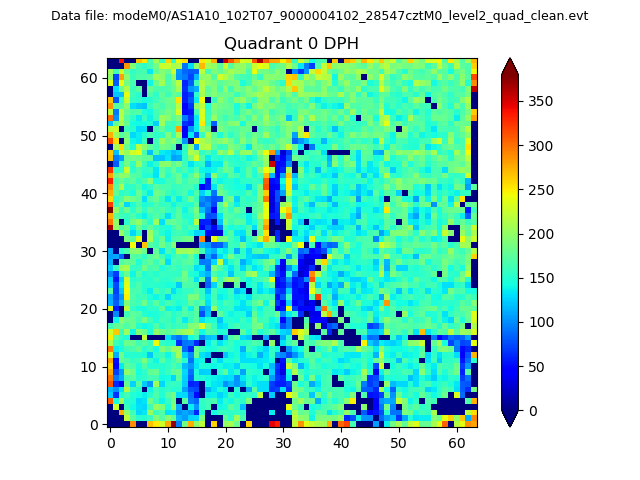 |
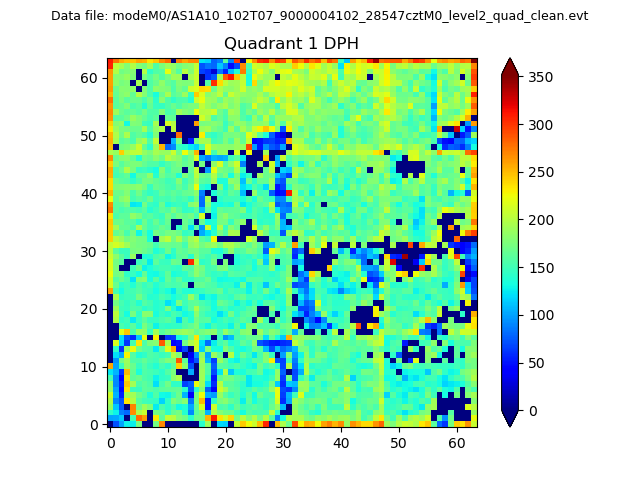 |
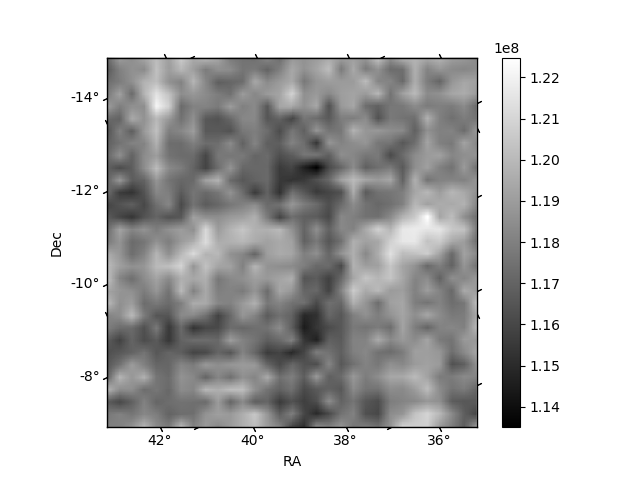
Quadrant B |
|---|---|---|---|
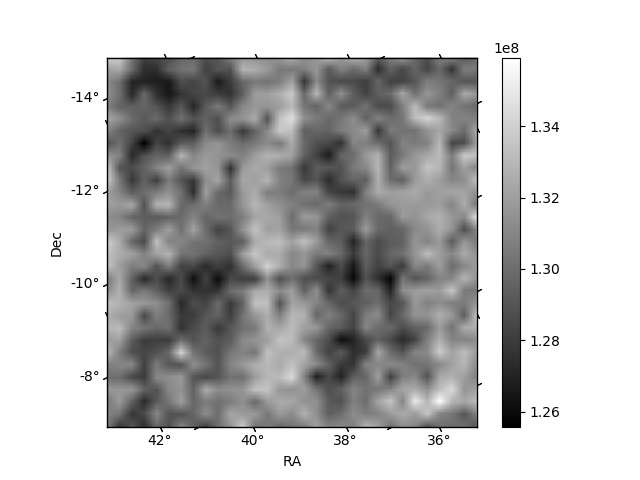
| Quadrant D | 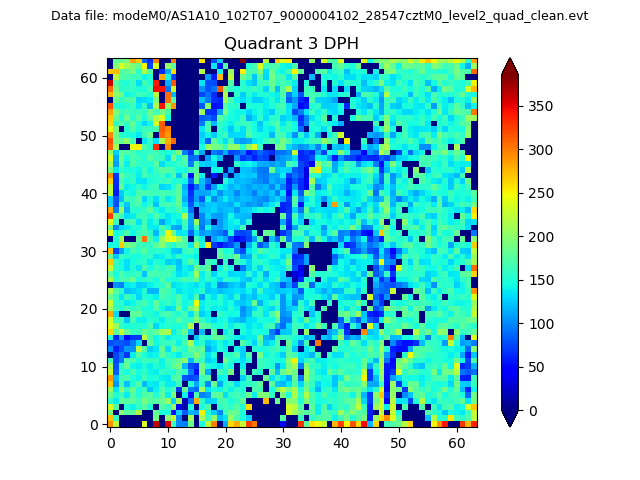 |
 |
Quadrant C |
| Plot type | Count rate plots | Images |
|---|---|---|
| Comparison with Poisson distribution Blue bars denote a histogram of data divided into 1 sec bins. Red curve is a Poisson curve with rate = median count rate of data. |
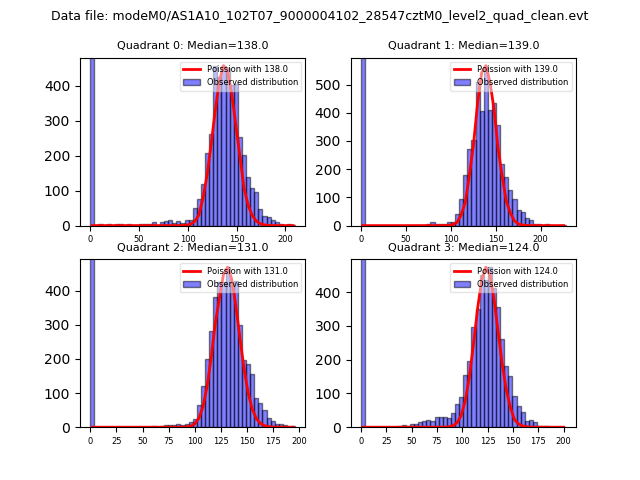 |
 |
| Quadrant-wise count rates Data is divided into 100 sec bins |
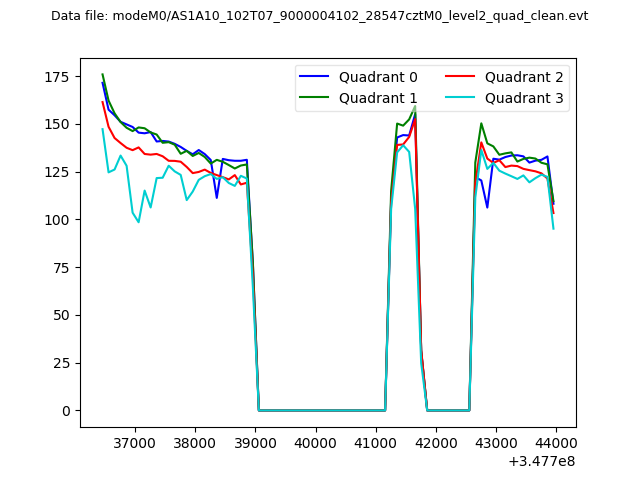 |
|
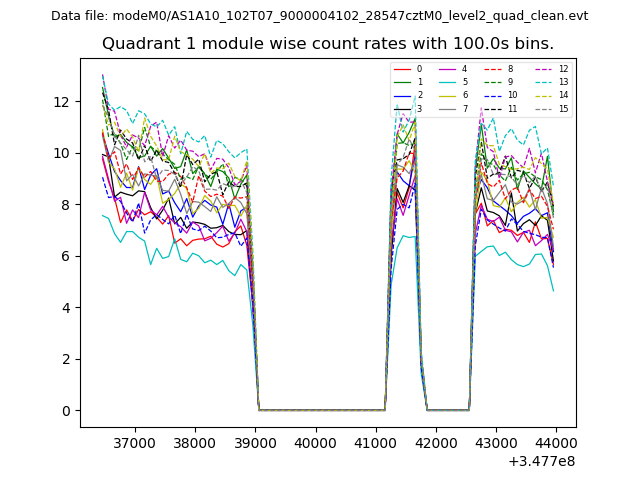
| Module-wise count rates for Quadrant A Data is divided into 100 sec bins |
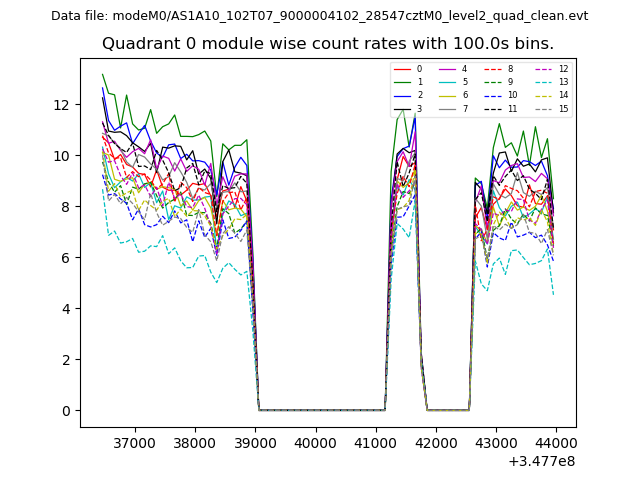 |
 |
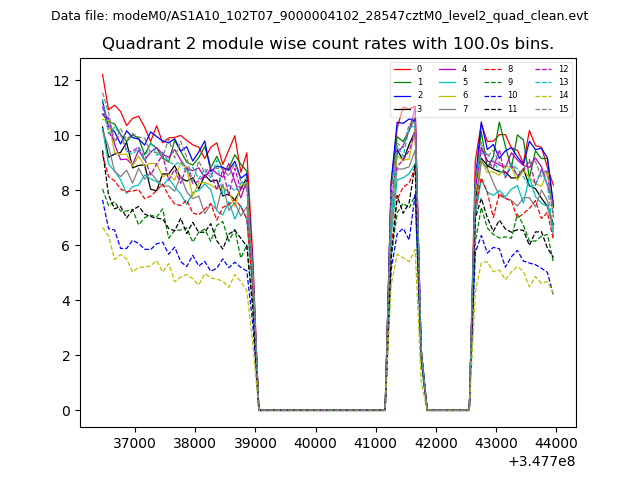
| Module-wise count rates for Quadrant B Data is divided into 100 sec bins |
 |
 |
| Module-wise count rates for Quadrant C Data is divided into 100 sec bins |
 |
 |
| Module-wise count rates for Quadrant D Data is divided into 100 sec bins |
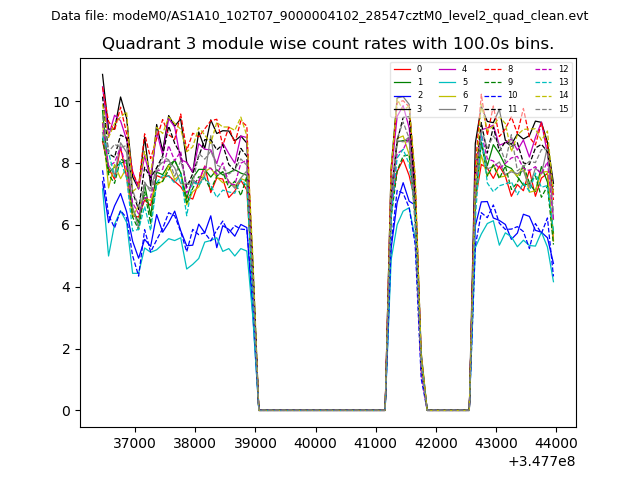 |
 |
| Parameter | Plot |
|---|---|
| CZT HV Monitor | 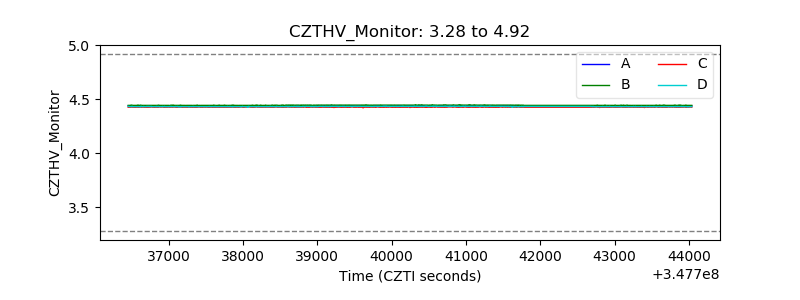 |
| D_VDD | 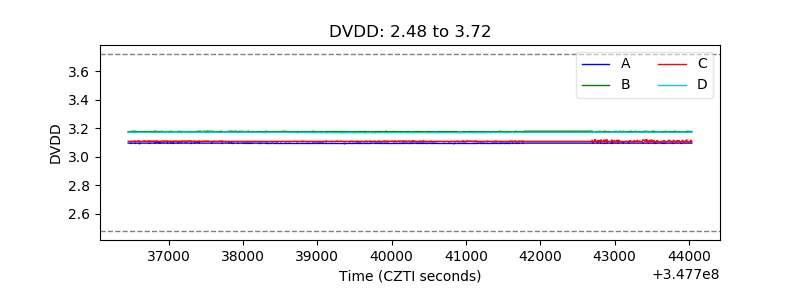 |
| Temperature 1 | 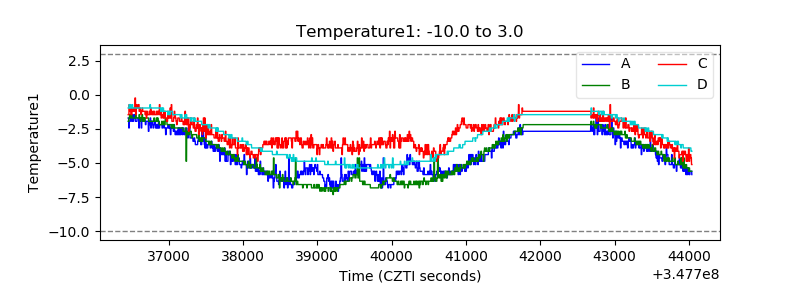 |
| Veto HV Monitor | 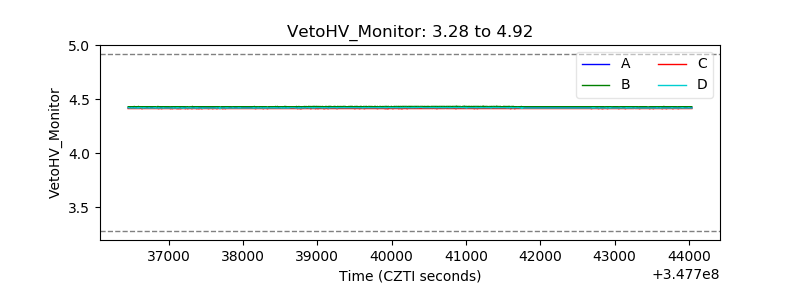 |
| Veto LLD | 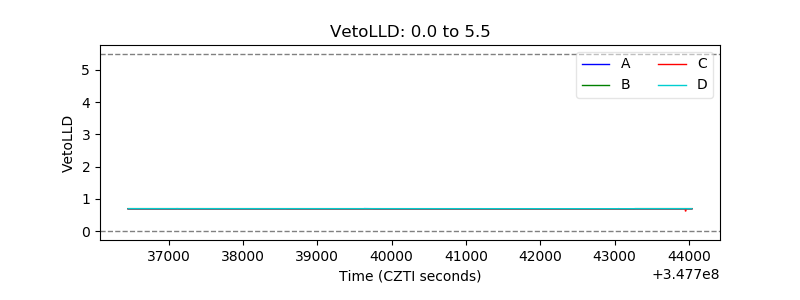 |
| Alpha Counter | 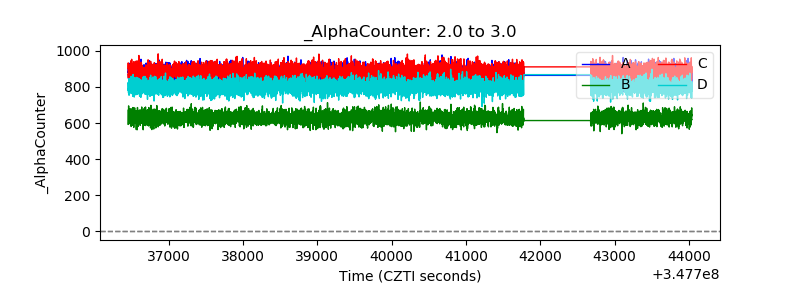 |
| _CPM_Rate |  |
| CZT Counter |  |
| +2.5 Volts monitor |  |
| +5 Volts monitor |  |
| _ROLL_ROT | 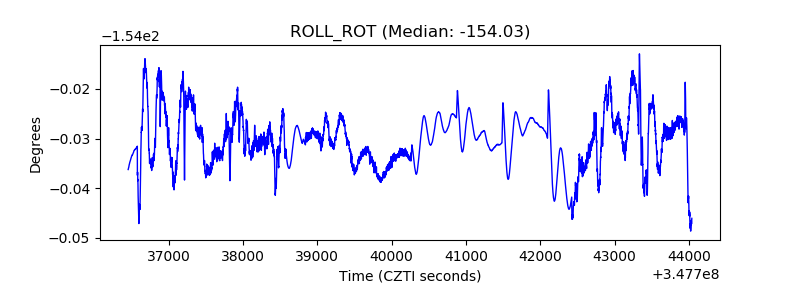 |
| _Roll_DEC | 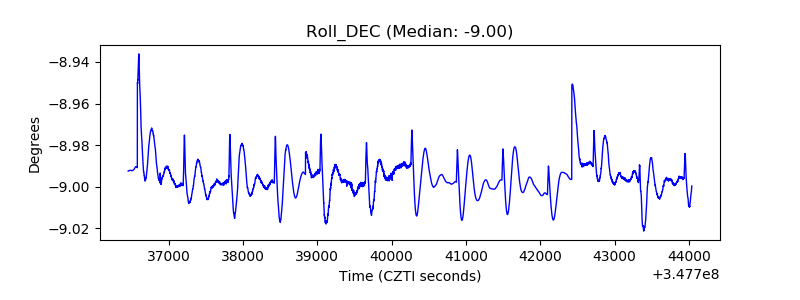 |
| _Roll_RA | 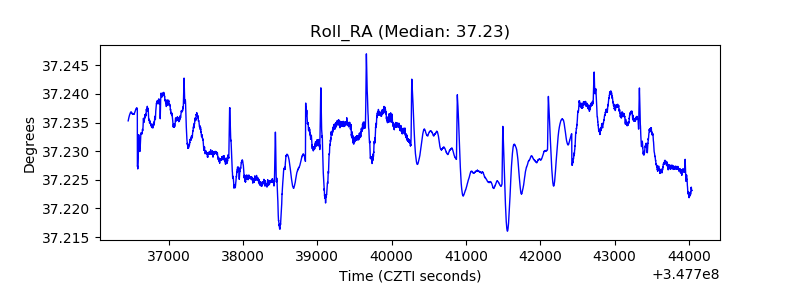 |
| Veto Counter | 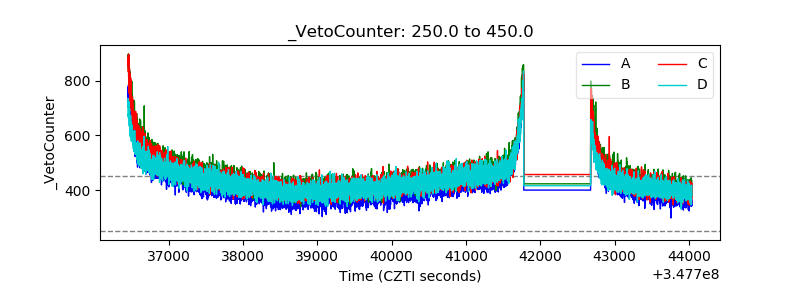 |