| Param | Original file | Final file |
|---|---|---|
| Filename | modeM0/AS1A10_102T07_9000004102_28548cztM0_level2.evt | modeM0/AS1A10_102T07_9000004102_28548cztM0_level2_quad_clean.evt |
| Size (bytes) | 593,228,160 | 101,664,000 |
| Size | 565.7 MB | 97.0 MB |
| Events in quadrant A | 4,606,887 | 654,261 |
| Events in quadrant B | 3,685,529 | 668,633 |
| Events in quadrant C | 3,513,560 | 634,410 |
| Events in quadrant D | 5,669,450 | 617,210 |
| Mode M0 | |||
|---|---|---|---|
| Quadrant | BADHDUFLAG | Total packets | Discarded packets |
| A | 0 | 18551 | 2 |
| B | 0 | 15604 | 2 |
| C | 0 | 15011 | 2 |
| D | 0 | 21867 | 6 |
| Mode SS | |||
|---|---|---|---|
| Quadrant | BADHDUFLAG | Total packets | Discarded packets |
| A | 0 | 144 | 0 |
| B | 0 | 144 | 0 |
| C | 0 | 144 | 0 |
| D | 0 | 144 | 0 |
| Mode M9 | |||
|---|---|---|---|
| Quadrant | BADHDUFLAG | Total packets | Discarded packets |
| A | 0 | 11 | 0 |
| B | 0 | 12 | 0 |
| C | 0 | 12 | 0 |
| D | 0 | 12 | 0 |
| Quadrant | Total seconds | Saturated seconds | Saturation percentage |
|---|---|---|---|
| A | 7252 | 216 | 2.978489% |
| B | 7252 | 81 | 1.116933% |
| C | 7252 | 81 | 1.116933% |
| D | 7251 | 351 | 4.840712% |
Noise dominated data is calculated using 1-second bins in cleaned event files. If a bin has >2000 counts, and if more than 50% of those come from <1% of pixels, then it is considered to be noise-dominated and hence unusable.
| Quadrant | # 1 sec bins | Bins with >0 counts | Bins with >2000 counts | High rate bins dominated by noise | Noise dominated (total time) | Noise dominated (detector-on time) | Marked lightcurve |
|---|---|---|---|---|---|---|---|
| A | 7767 | 7253 | 157 | 157 | 2.02% | 2.16% | 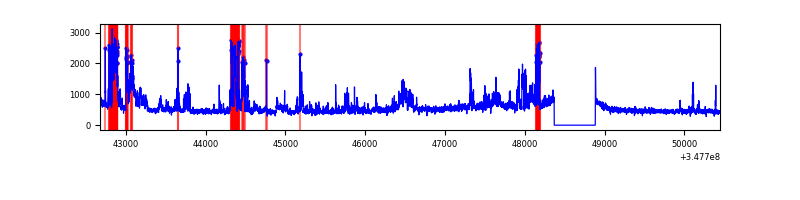 |
| B | 7767 | 7253 | 20 | 20 | 0.26% | 0.28% | 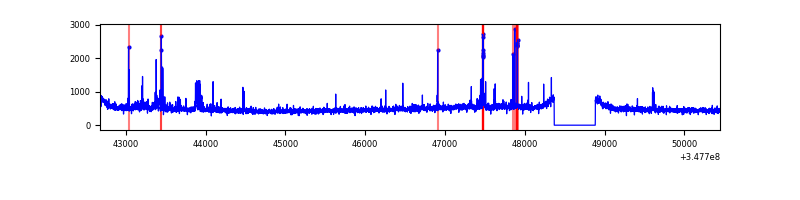 |
| C | 7767 | 7252 | 0 | 0 | 0.00% | 0.00% | 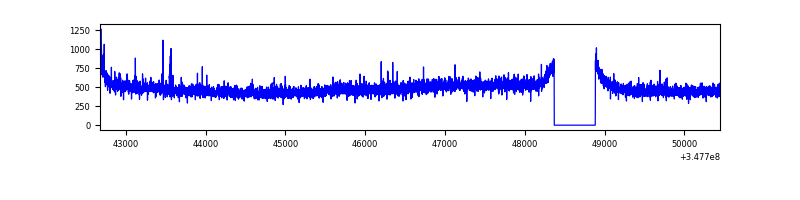 |
| D | 7765 | 7251 | 310 | 310 | 3.99% | 4.28% | 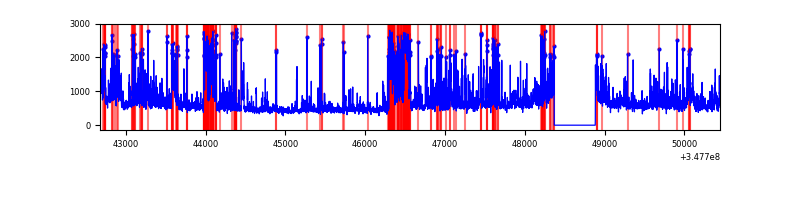 |
Top three noisy pixels from each quadrant. If the there are fewer than three noisy pixels in the level2.evt file, extra rows are filled as -1
| Pixel properties | Quadrant properties | ||||||
|---|---|---|---|---|---|---|---|
| Quadrant | DetID | PixID | Counts | Sigma | Mean | Median | Sigma |
| A | 15 | 174 | 738246 | 4150.06 | 882 | 864 | 177.7 |
| A | 14 | 238 | 454873 | 2555.21 | 882 | 864 | 177.7 |
| A | 13 | 254 | 14233 | 75.24 | 882 | 864 | 177.7 |
| B | 4 | 80 | 110480 | 645.75 | 882 | 861 | 169.8 |
| B | 10 | 245 | 72751 | 423.49 | 882 | 861 | 169.8 |
| B | 12 | 111 | 21093 | 119.18 | 882 | 861 | 169.8 |
| C | 14 | 238 | 137120 | 682.15 | 845 | 849 | 199.8 |
| C | 7 | 247 | 41345 | 202.71 | 845 | 849 | 199.8 |
| C | 3 | 233 | 14267 | 67.17 | 845 | 849 | 199.8 |
| D | 1 | 52 | 1426905 | 7087.98 | 843 | 819 | 201.2 |
| D | 8 | 195 | 781603 | 3880.68 | 843 | 819 | 201.2 |
| D | 2 | 250 | 154093 | 761.81 | 843 | 819 | 201.2 |
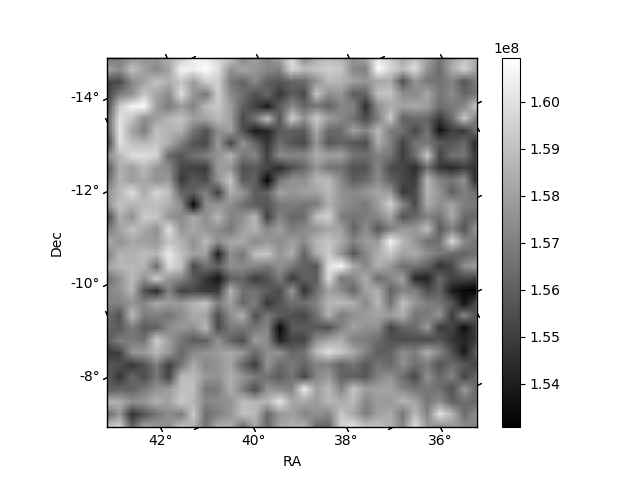
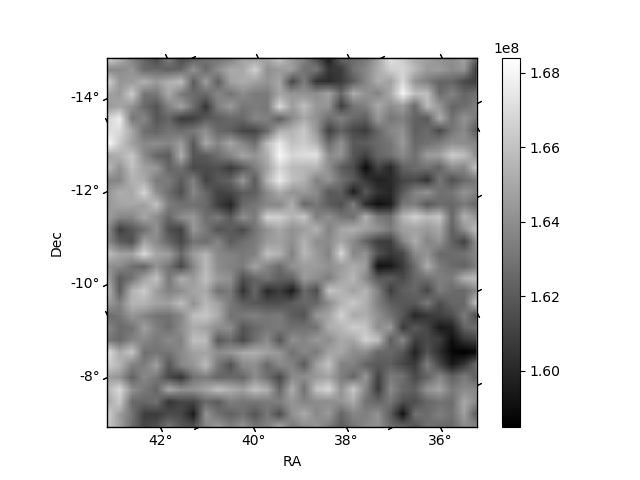
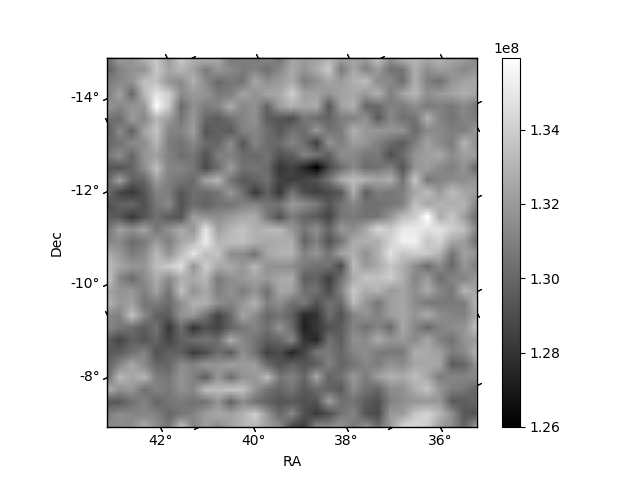
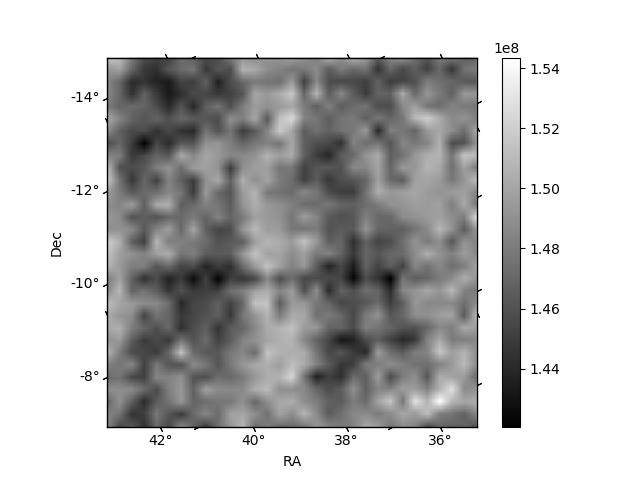
Histogram calculated using DETX and DETY for each event in the final _common_clean file
| Quadrant A | 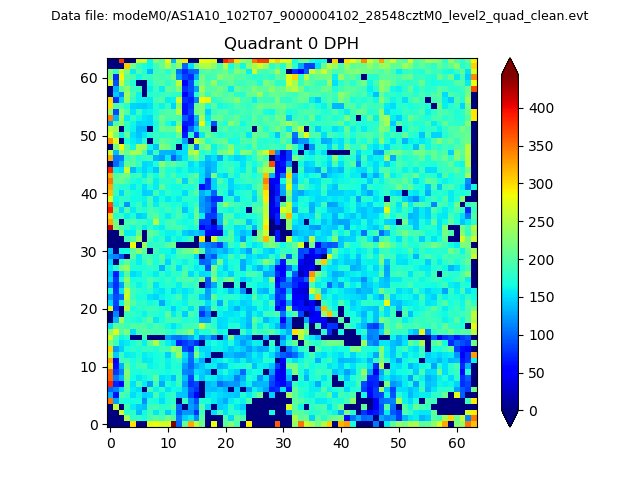 |
 |
Quadrant B |
|---|---|---|---|
| Quadrant D | 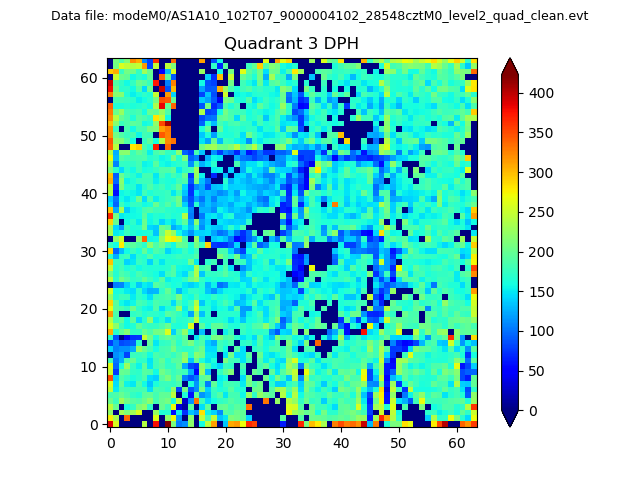 |
 |
Quadrant C |
| Plot type | Count rate plots | Images |
|---|---|---|
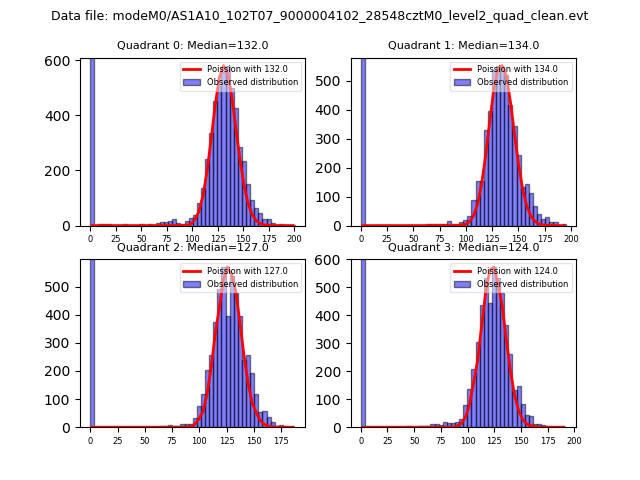
| Comparison with Poisson distribution Blue bars denote a histogram of data divided into 1 sec bins. Red curve is a Poisson curve with rate = median count rate of data. |
 |
 |
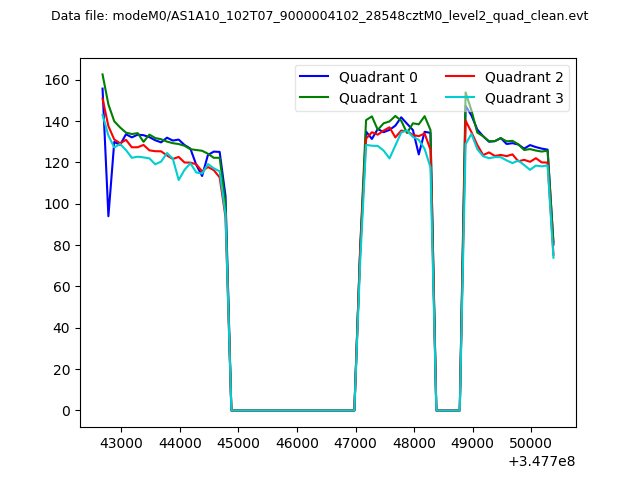
| Quadrant-wise count rates Data is divided into 100 sec bins |
 |
|
| Module-wise count rates for Quadrant A Data is divided into 100 sec bins |
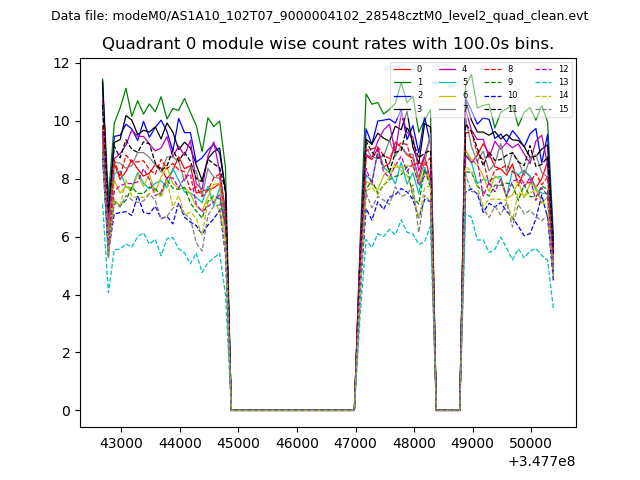 |
 |
| Module-wise count rates for Quadrant B Data is divided into 100 sec bins |
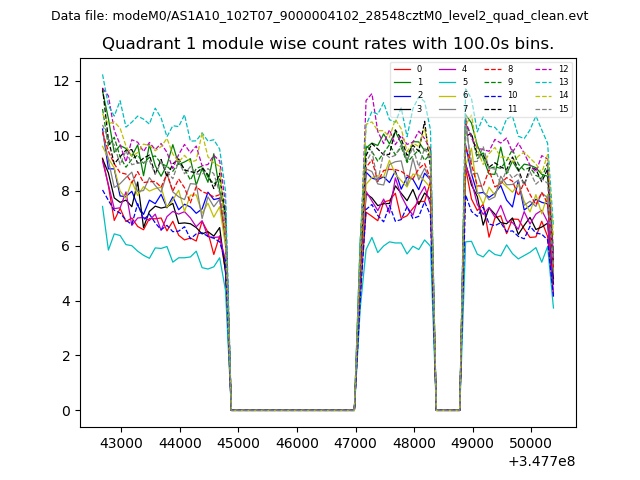 |
 |
| Module-wise count rates for Quadrant C Data is divided into 100 sec bins |
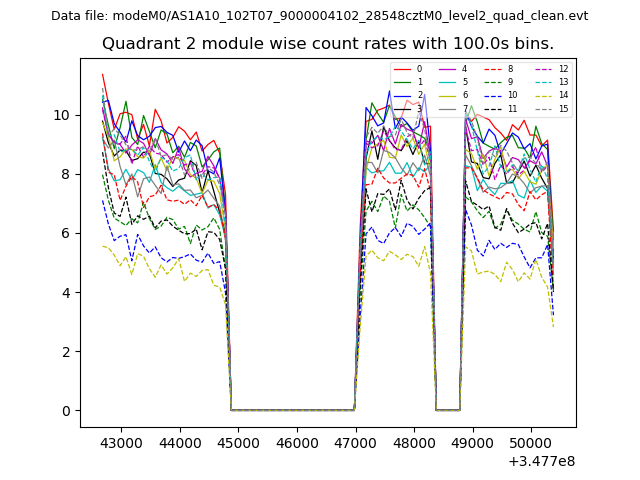 |
 |
| Module-wise count rates for Quadrant D Data is divided into 100 sec bins |
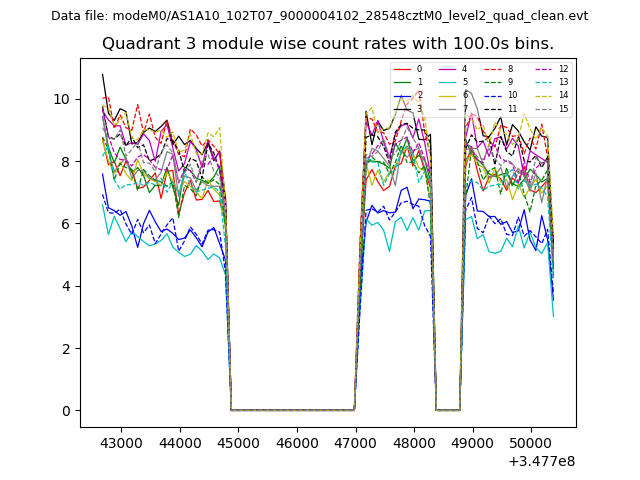 |
 |
| Parameter | Plot |
|---|---|
| CZT HV Monitor | 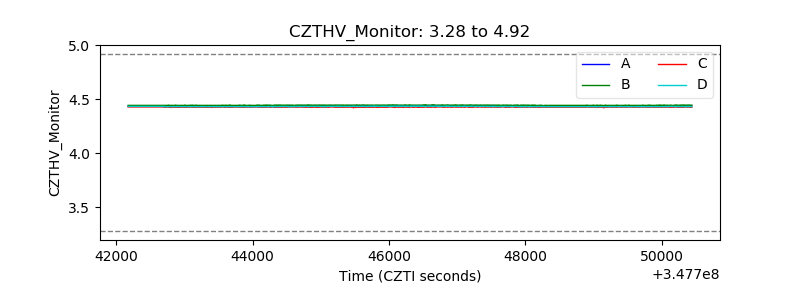 |
| D_VDD | 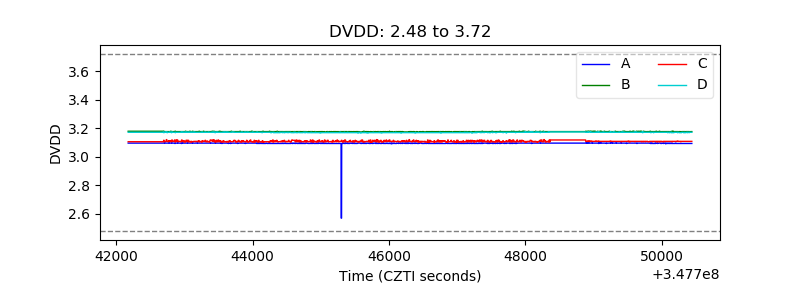 |
| Temperature 1 | 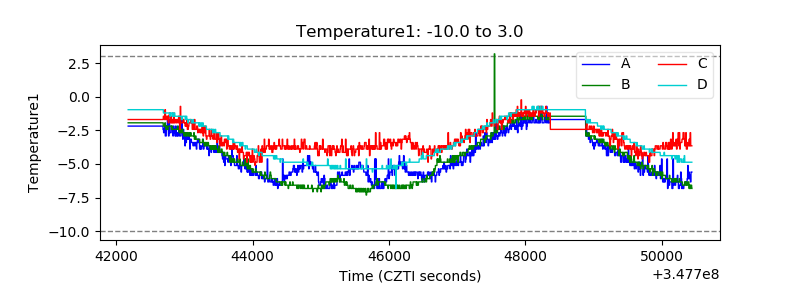 |
| Veto HV Monitor | 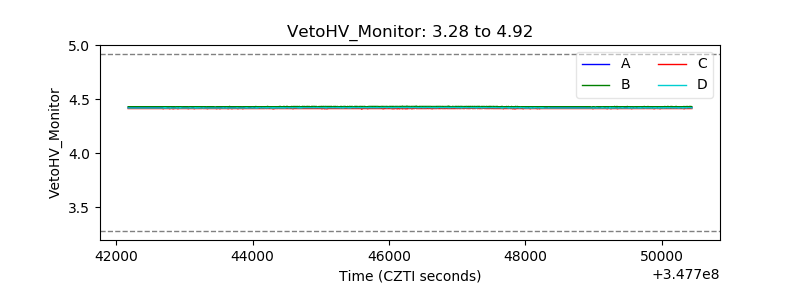 |
| Veto LLD |  |
| Alpha Counter | 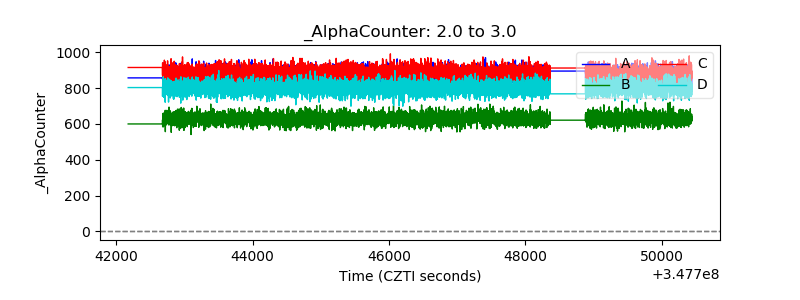 |
| _CPM_Rate | 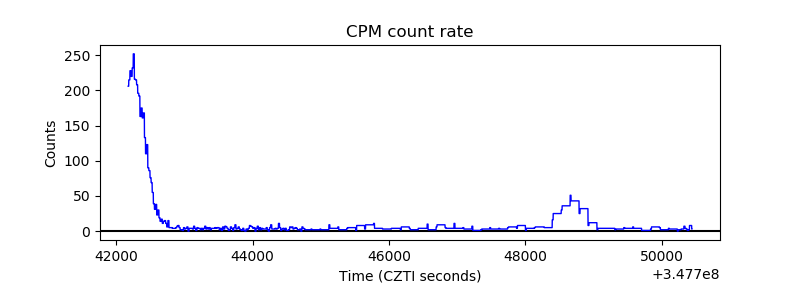 |
| CZT Counter |  |
| +2.5 Volts monitor |  |
| +5 Volts monitor |  |
| _ROLL_ROT | 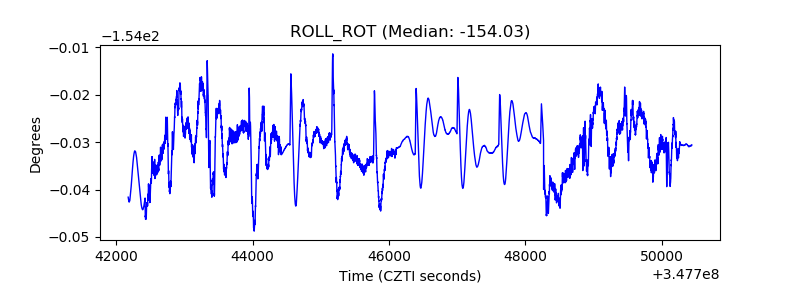 |
| _Roll_DEC | 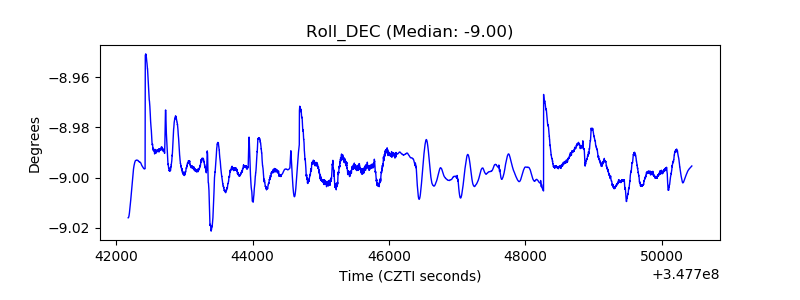 |
| _Roll_RA | 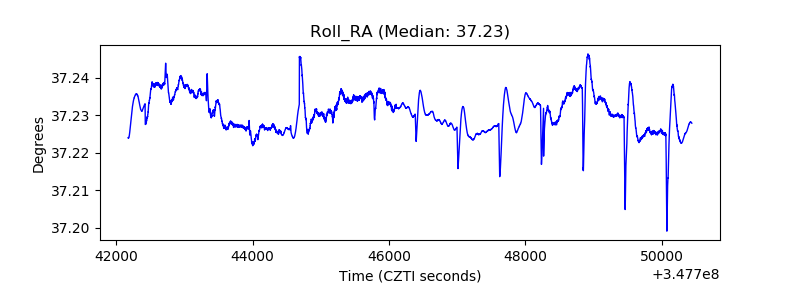 |
| Veto Counter | 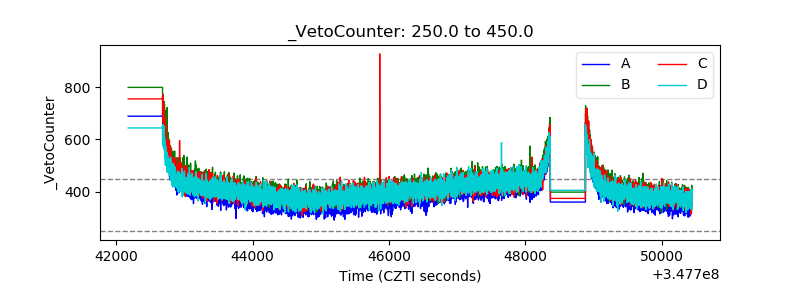 |