| Param | Original file | Final file |
|---|---|---|
| Filename | modeM0/AS1A10_102T07_9000004102_28550cztM0_level2.evt | modeM0/AS1A10_102T07_9000004102_28550cztM0_level2_quad_clean.evt |
| Size (bytes) | 573,664,320 | 97,606,080 |
| Size | 547.1 MB | 93.1 MB |
| Events in quadrant A | 3,876,330 | 623,817 |
| Events in quadrant B | 4,478,751 | 621,202 |
| Events in quadrant C | 3,717,518 | 593,461 |
| Events in quadrant D | 4,776,091 | 579,246 |
| Mode M0 | |||
|---|---|---|---|
| Quadrant | BADHDUFLAG | Total packets | Discarded packets |
| A | 0 | 16573 | 2 |
| B | 0 | 18288 | 2 |
| C | 0 | 16007 | 2 |
| D | 0 | 19300 | 3 |
| Mode SS | |||
|---|---|---|---|
| Quadrant | BADHDUFLAG | Total packets | Discarded packets |
| A | 0 | 160 | 0 |
| B | 0 | 160 | 0 |
| C | 0 | 160 | 0 |
| D | 0 | 160 | 0 |
| Mode M9 | |||
|---|---|---|---|
| Quadrant | BADHDUFLAG | Total packets | Discarded packets |
| A | 0 | 6 | 0 |
| B | 0 | 6 | 0 |
| C | 0 | 6 | 0 |
| D | 0 | 6 | 0 |
| Quadrant | Total seconds | Saturated seconds | Saturation percentage |
|---|---|---|---|
| A | 7731 | 53 | 0.685552% |
| B | 7732 | 263 | 3.401449% |
| C | 7732 | 113 | 1.461459% |
| D | 7731 | 274 | 3.544173% |
Noise dominated data is calculated using 1-second bins in cleaned event files. If a bin has >2000 counts, and if more than 50% of those come from <1% of pixels, then it is considered to be noise-dominated and hence unusable.
| Quadrant | # 1 sec bins | Bins with >0 counts | Bins with >2000 counts | High rate bins dominated by noise | Noise dominated (total time) | Noise dominated (detector-on time) | Marked lightcurve |
|---|---|---|---|---|---|---|---|
| A | 8366 | 7732 | 0 | 0 | 0.00% | 0.00% | 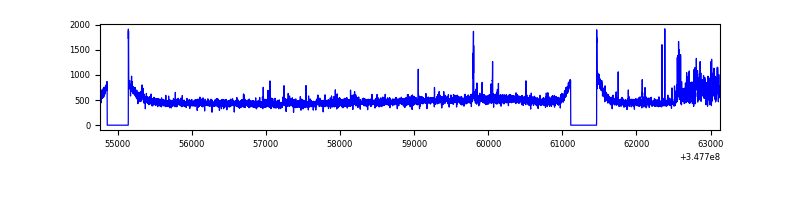 |
| B | 8367 | 7733 | 112 | 112 | 1.34% | 1.45% | 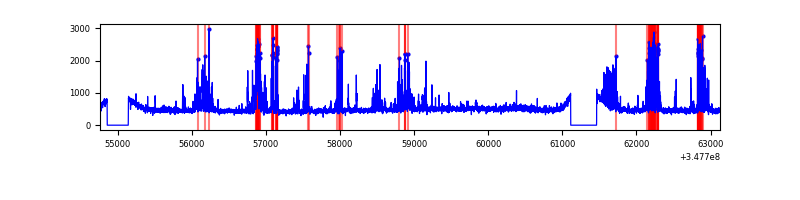 |
| C | 8367 | 7734 | 0 | 0 | 0.00% | 0.00% | 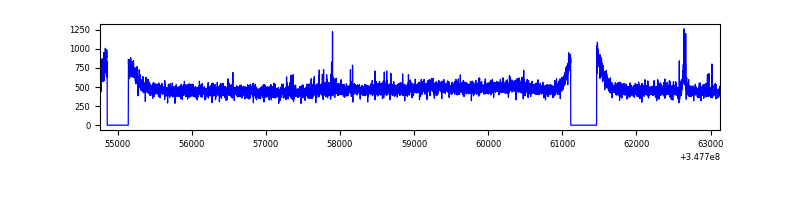 |
| D | 8366 | 7733 | 169 | 169 | 2.02% | 2.19% | 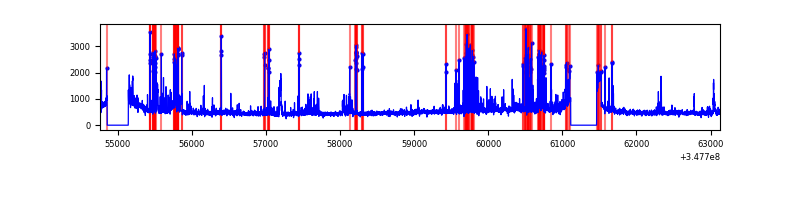 |
Top three noisy pixels from each quadrant. If the there are fewer than three noisy pixels in the level2.evt file, extra rows are filled as -1
| Pixel properties | Quadrant properties | ||||||
|---|---|---|---|---|---|---|---|
| Quadrant | DetID | PixID | Counts | Sigma | Mean | Median | Sigma |
| A | 15 | 174 | 217427 | 1128.6 | 942 | 921 | 191.8 |
| A | 13 | 254 | 14133 | 68.87 | 942 | 921 | 191.8 |
| A | 8 | 192 | 11287 | 54.04 | 942 | 921 | 191.8 |
| B | 4 | 171 | 793485 | 4375.47 | 931 | 907 | 181.1 |
| B | 12 | 111 | 22768 | 120.68 | 931 | 907 | 181.1 |
| B | 11 | 111 | 20371 | 107.45 | 931 | 907 | 181.1 |
| C | 14 | 238 | 144436 | 673.9 | 901 | 905 | 213.0 |
| C | 7 | 247 | 33495 | 153.02 | 901 | 905 | 213.0 |
| C | 7 | 220 | 19935 | 89.35 | 901 | 905 | 213.0 |
| D | 1 | 52 | 841082 | 3881.53 | 898 | 872 | 216.5 |
| D | 8 | 195 | 376309 | 1734.41 | 898 | 872 | 216.5 |
| D | 2 | 250 | 82051 | 375.02 | 898 | 872 | 216.5 |
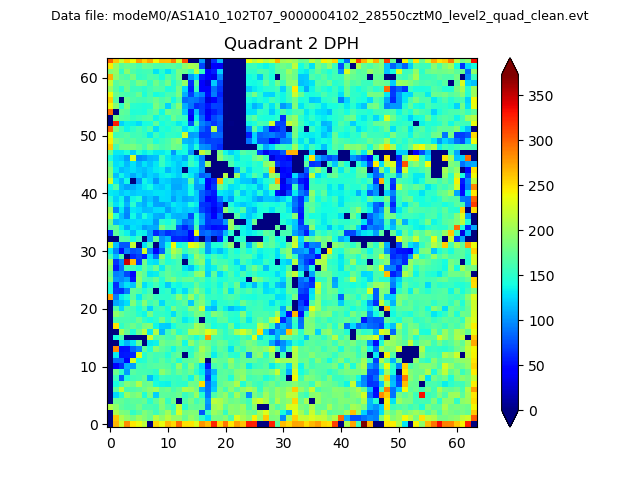
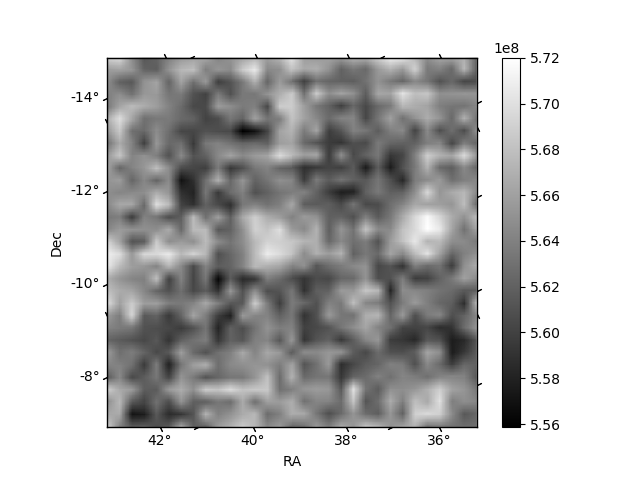
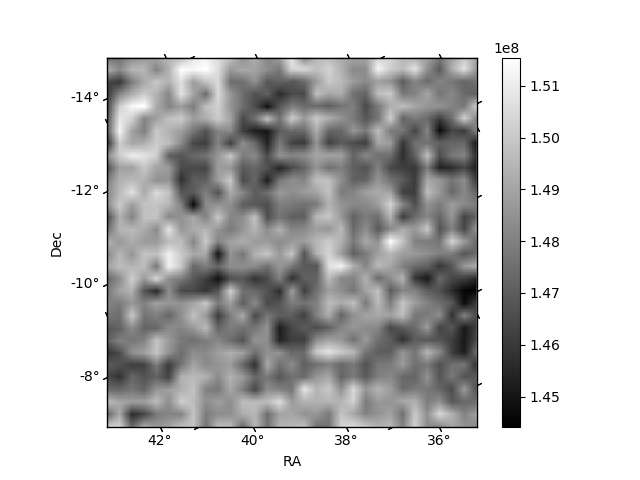
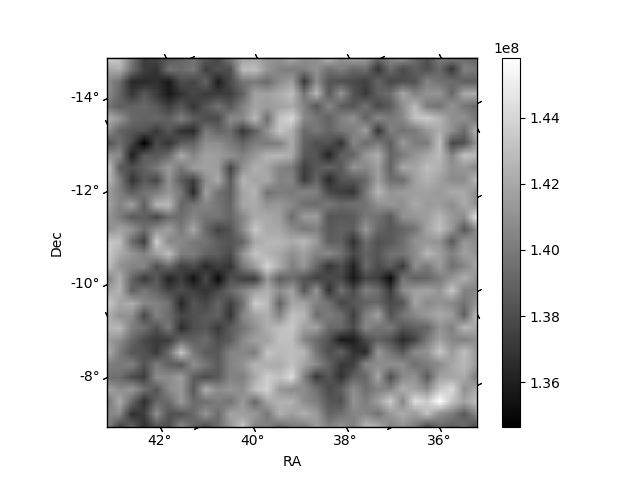
Histogram calculated using DETX and DETY for each event in the final _common_clean file
| Quadrant A | 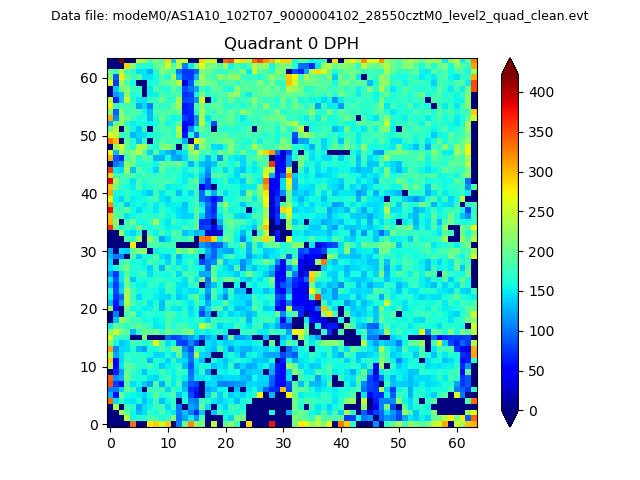 |
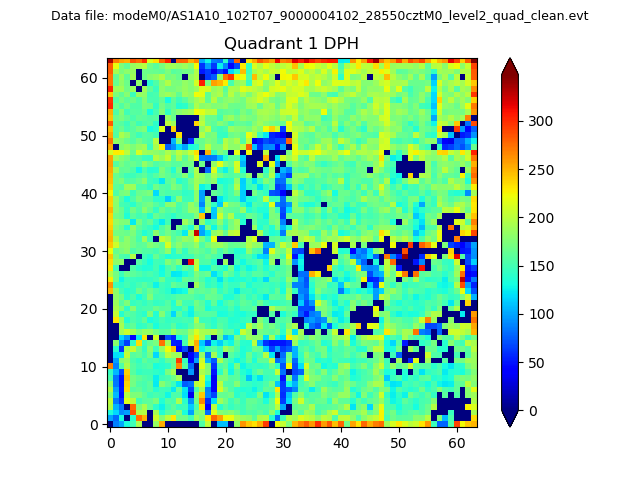 |
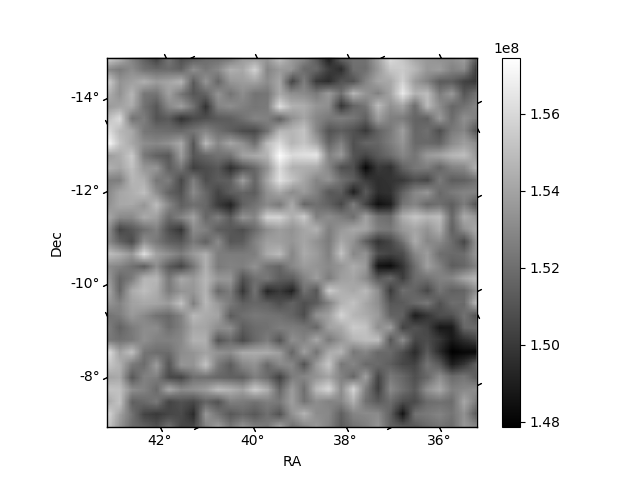
Quadrant B |
|---|---|---|---|
| Quadrant D | 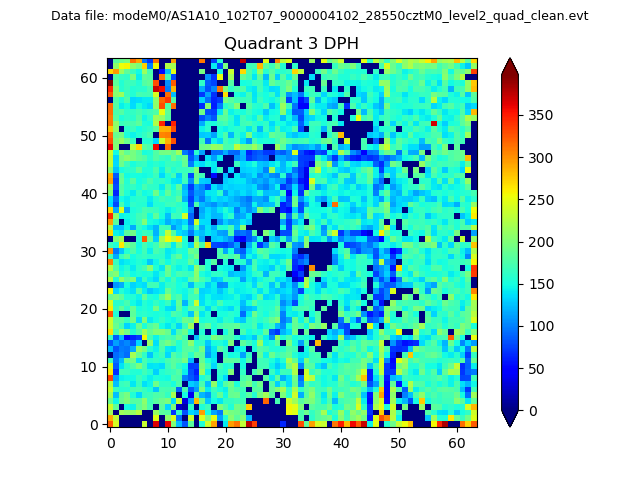 |
 |
Quadrant C |
| Plot type | Count rate plots | Images |
|---|---|---|
| Comparison with Poisson distribution Blue bars denote a histogram of data divided into 1 sec bins. Red curve is a Poisson curve with rate = median count rate of data. |
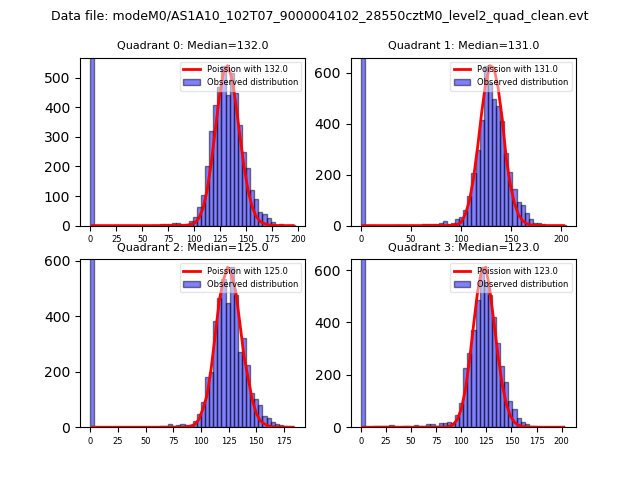 |
 |
| Quadrant-wise count rates Data is divided into 100 sec bins |
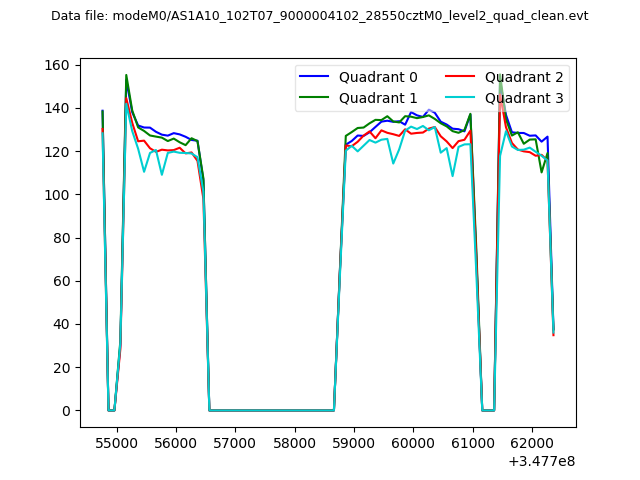 |
|
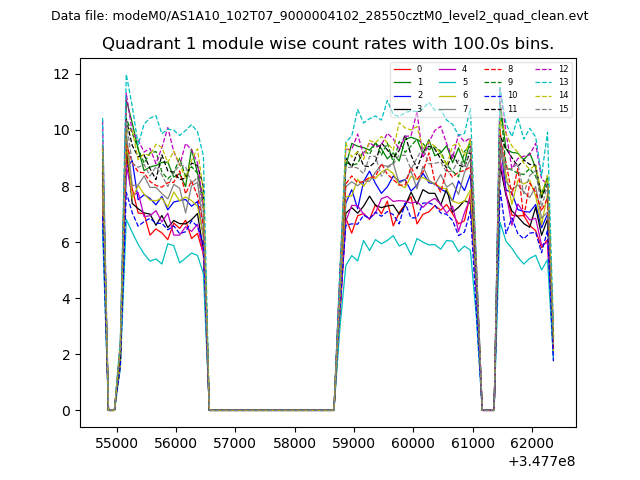
| Module-wise count rates for Quadrant A Data is divided into 100 sec bins |
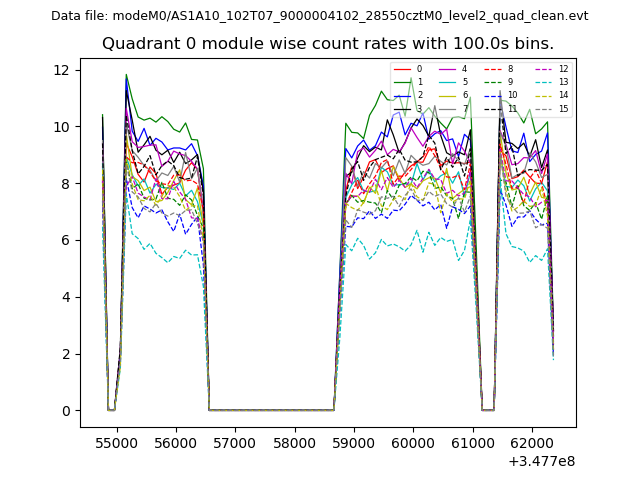 |
 |
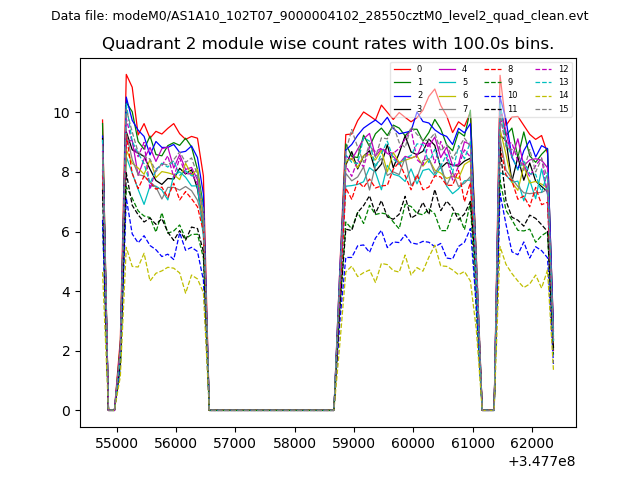
| Module-wise count rates for Quadrant B Data is divided into 100 sec bins |
 |
 |
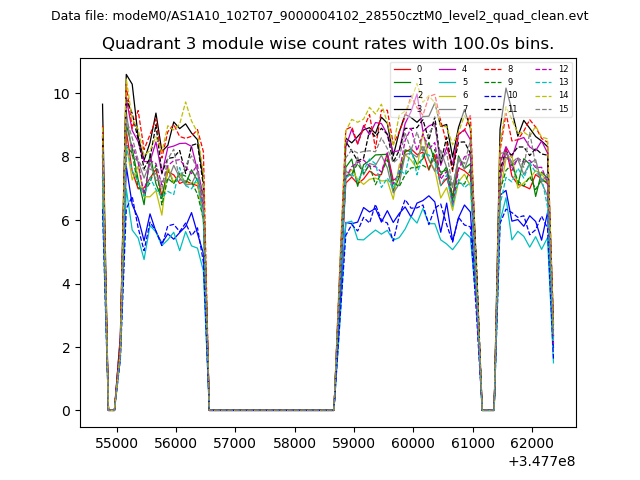
| Module-wise count rates for Quadrant C Data is divided into 100 sec bins |
 |
 |
| Module-wise count rates for Quadrant D Data is divided into 100 sec bins |
 |
 |
| Parameter | Plot |
|---|---|
| CZT HV Monitor | 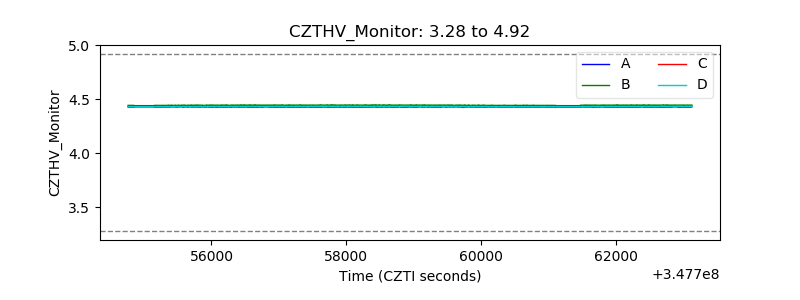 |
| D_VDD | 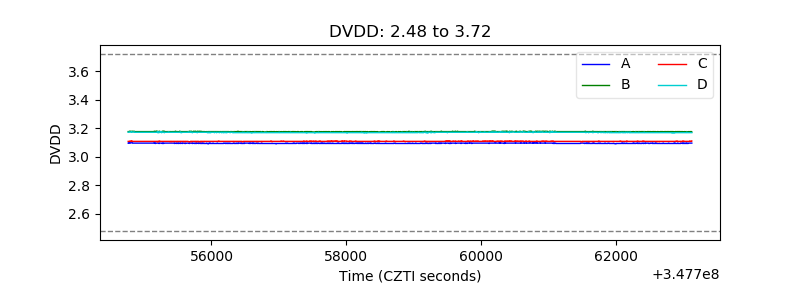 |
| Temperature 1 | 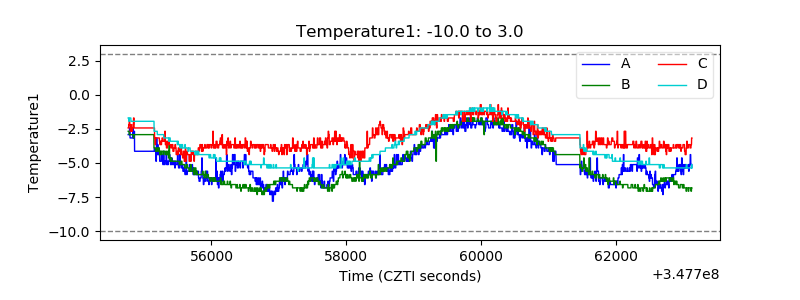 |
| Veto HV Monitor | 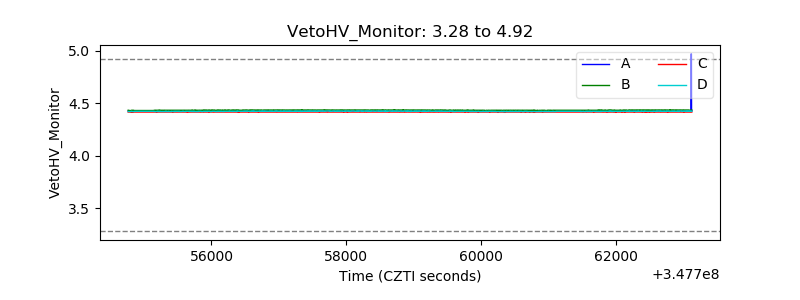 |
| Veto LLD |  |
| Alpha Counter | 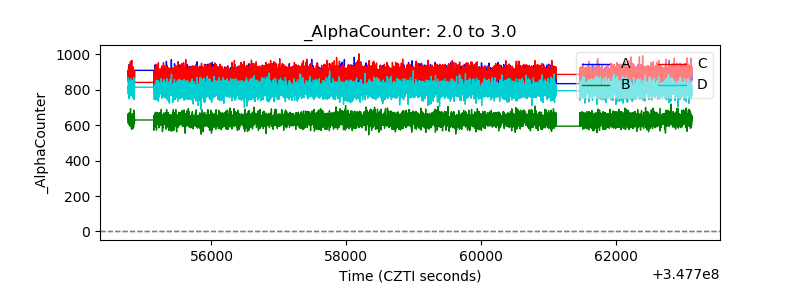 |
| _CPM_Rate | 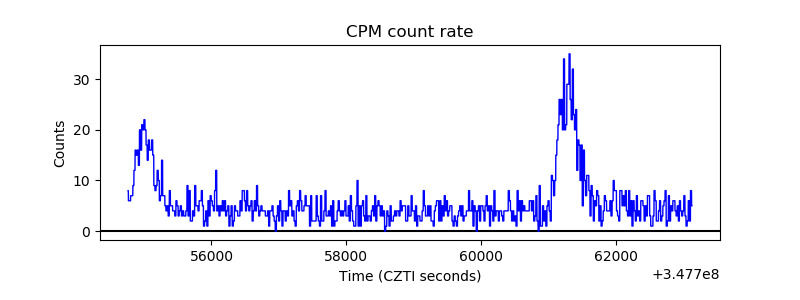 |
| CZT Counter | 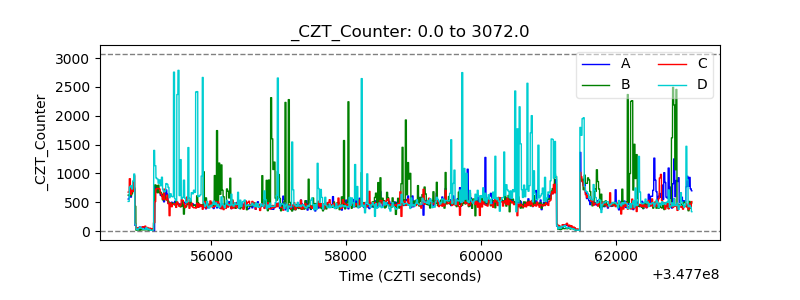 |
| +2.5 Volts monitor |  |
| +5 Volts monitor |  |
| _ROLL_ROT | 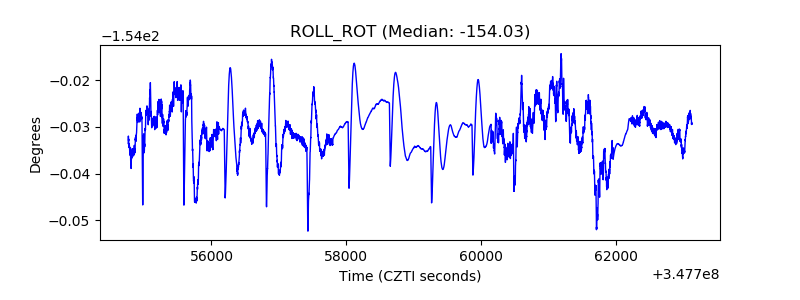 |
| _Roll_DEC | 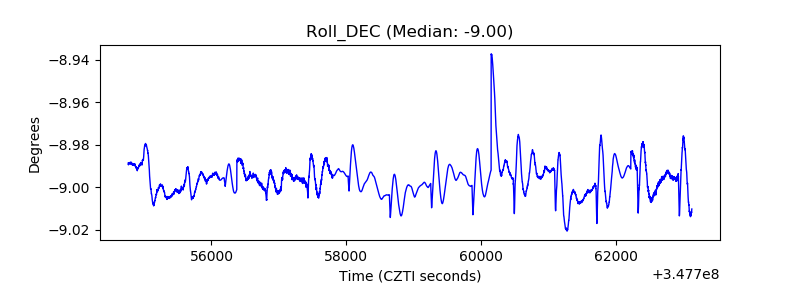 |
| _Roll_RA | 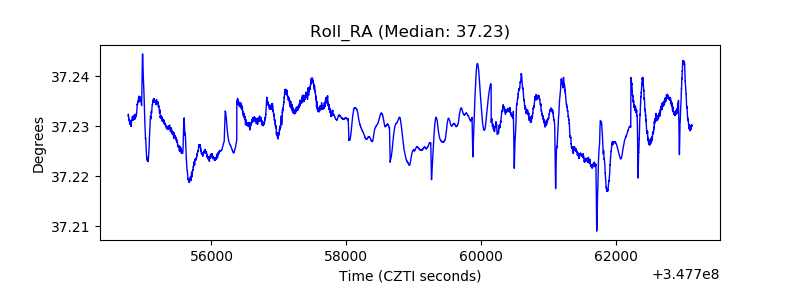 |
| Veto Counter | 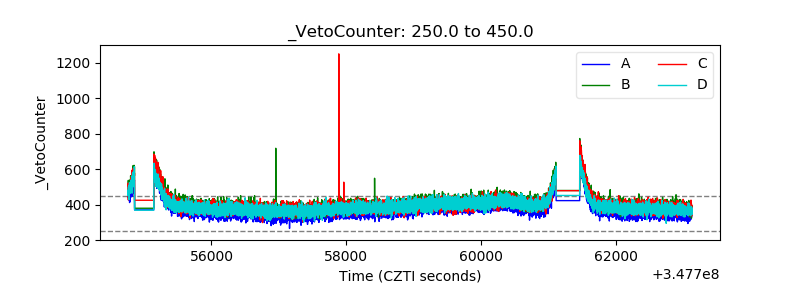 |