| Param | Original file | Final file |
|---|---|---|
| Filename | modeM0/AS1A10_102T07_9000004102_28553cztM0_level2.evt | modeM0/AS1A10_102T07_9000004102_28553cztM0_level2_quad_clean.evt |
| Size (bytes) | 1,656,233,280 | 218,704,320 |
| Size | 1.5 GB | 208.6 MB |
| Events in quadrant A | 10,356,028 | 1,375,992 |
| Events in quadrant B | 10,076,289 | 1,392,262 |
| Events in quadrant C | 9,298,444 | 1,336,928 |
| Events in quadrant D | 19,147,105 | 1,207,734 |
| Mode M0 | |||
|---|---|---|---|
| Quadrant | BADHDUFLAG | Total packets | Discarded packets |
| A | 0 | 42993 | 4 |
| B | 0 | 41833 | 4 |
| C | 0 | 39519 | 4 |
| D | 0 | 69722 | 4 |
| Mode SS | |||
|---|---|---|---|
| Quadrant | BADHDUFLAG | Total packets | Discarded packets |
| A | 0 | 386 | 0 |
| B | 0 | 386 | 0 |
| C | 0 | 386 | 0 |
| D | 0 | 386 | 0 |
| Mode M9 | |||
|---|---|---|---|
| Quadrant | BADHDUFLAG | Total packets | Discarded packets |
| A | 0 | 24 | 0 |
| B | 0 | 24 | 0 |
| C | 0 | 24 | 0 |
| D | 0 | 24 | 0 |
| Quadrant | Total seconds | Saturated seconds | Saturation percentage |
|---|---|---|---|
| A | 19018 | 456 | 2.397728% |
| B | 19018 | 484 | 2.544957% |
| C | 19018 | 292 | 1.535388% |
| D | 19019 | 2239 | 11.772438% |
Noise dominated data is calculated using 1-second bins in cleaned event files. If a bin has >2000 counts, and if more than 50% of those come from <1% of pixels, then it is considered to be noise-dominated and hence unusable.
| Quadrant | # 1 sec bins | Bins with >0 counts | Bins with >2000 counts | High rate bins dominated by noise | Noise dominated (total time) | Noise dominated (detector-on time) | Marked lightcurve |
|---|---|---|---|---|---|---|---|
| A | 21333 | 19019 | 163 | 163 | 0.76% | 0.86% | 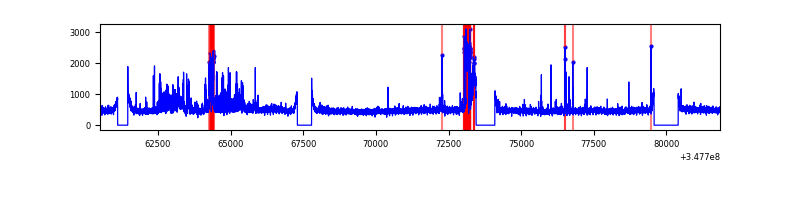 |
| B | 21333 | 19018 | 138 | 138 | 0.65% | 0.73% | 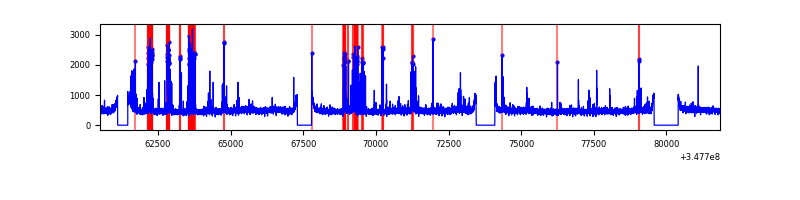 |
| C | 21333 | 19019 | 2 | 2 | 0.01% | 0.01% | 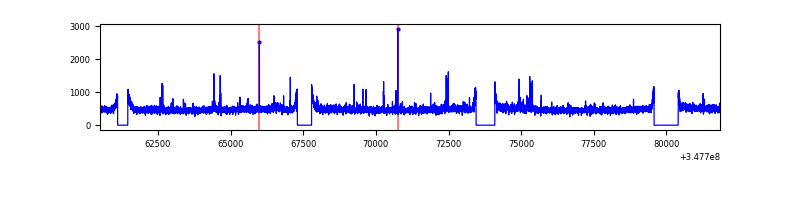 |
| D | 21333 | 19019 | 2158 | 2158 | 10.12% | 11.35% | 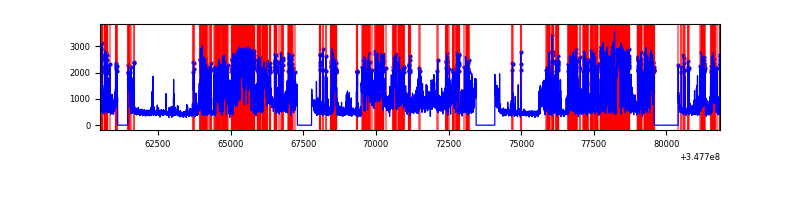 |
Top three noisy pixels from each quadrant. If the there are fewer than three noisy pixels in the level2.evt file, extra rows are filled as -1
| Pixel properties | Quadrant properties | ||||||
|---|---|---|---|---|---|---|---|
| Quadrant | DetID | PixID | Counts | Sigma | Mean | Median | Sigma |
| A | 15 | 174 | 1392837 | 2994.74 | 2309 | 2262 | 464.3 |
| A | 13 | 254 | 32104 | 64.27 | 2309 | 2262 | 464.3 |
| A | 5 | 98 | 29748 | 59.19 | 2309 | 2262 | 464.3 |
| B | 4 | 171 | 807297 | 1810.89 | 2299 | 2241 | 444.6 |
| B | 10 | 245 | 140786 | 311.64 | 2299 | 2241 | 444.6 |
| B | 12 | 111 | 56499 | 122.05 | 2299 | 2241 | 444.6 |
| C | 14 | 238 | 357350 | 677.14 | 2222 | 2233 | 524.4 |
| C | 7 | 247 | 145796 | 273.74 | 2222 | 2233 | 524.4 |
| C | 3 | 233 | 121082 | 226.62 | 2222 | 2233 | 524.4 |
| D | 1 | 52 | 8496338 | 16550.51 | 2146 | 2091 | 513.2 |
| D | 8 | 195 | 2262155 | 4403.59 | 2146 | 2091 | 513.2 |
| D | 2 | 250 | 91733 | 174.66 | 2146 | 2091 | 513.2 |
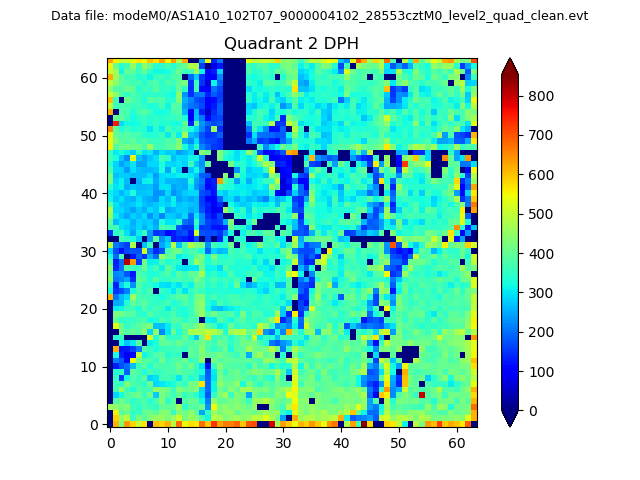
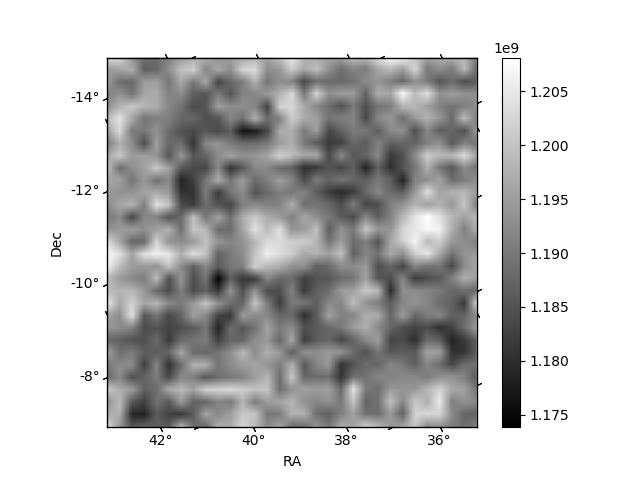
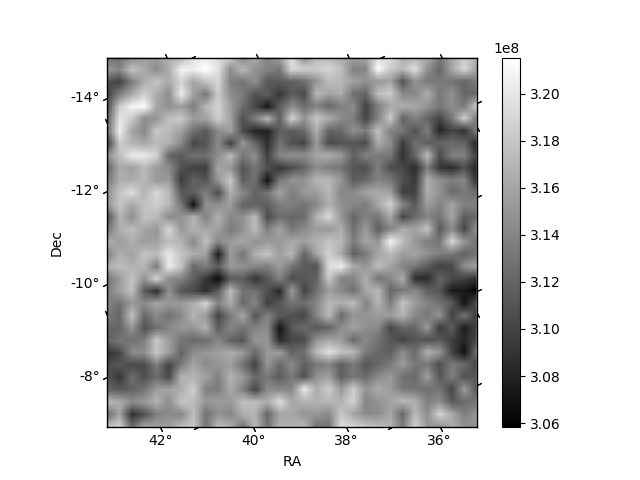
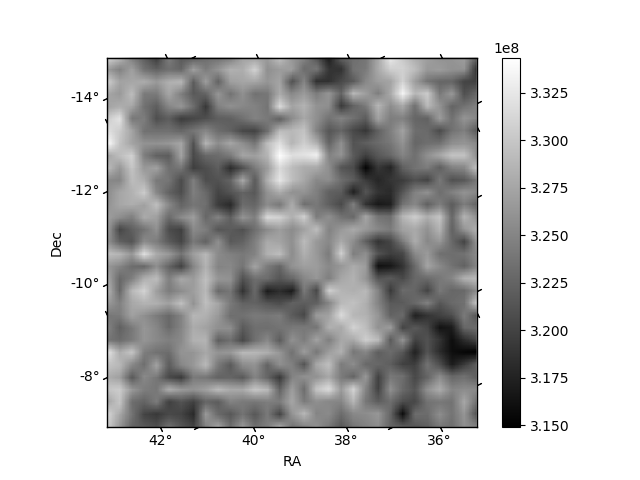
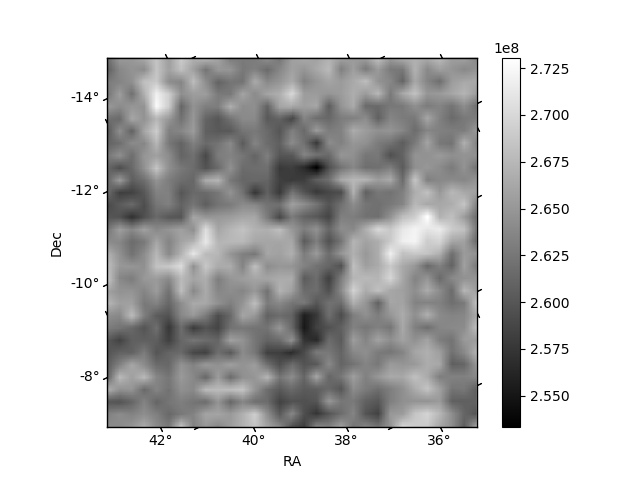
Histogram calculated using DETX and DETY for each event in the final _common_clean file
| Quadrant A | 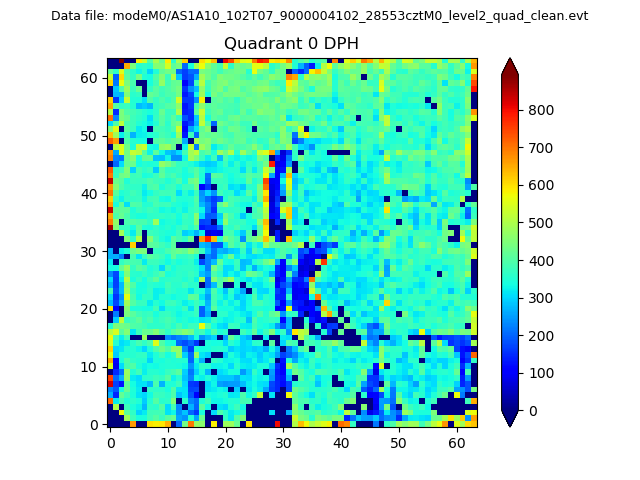 |
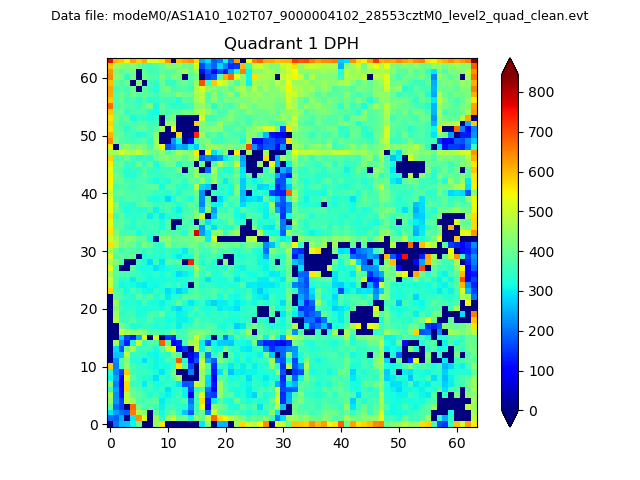 |
Quadrant B |
|---|---|---|---|
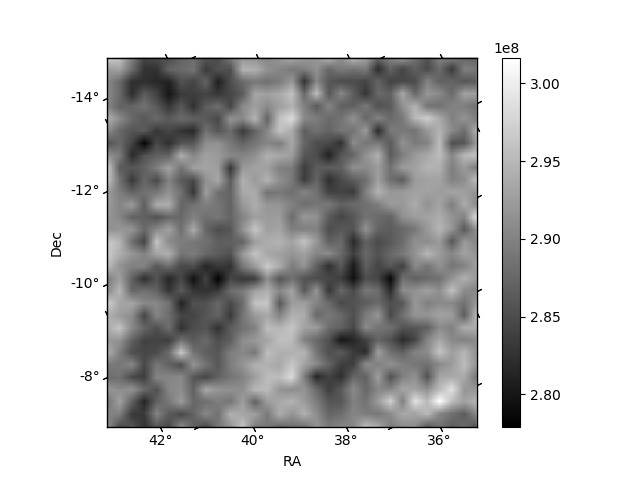
| Quadrant D | 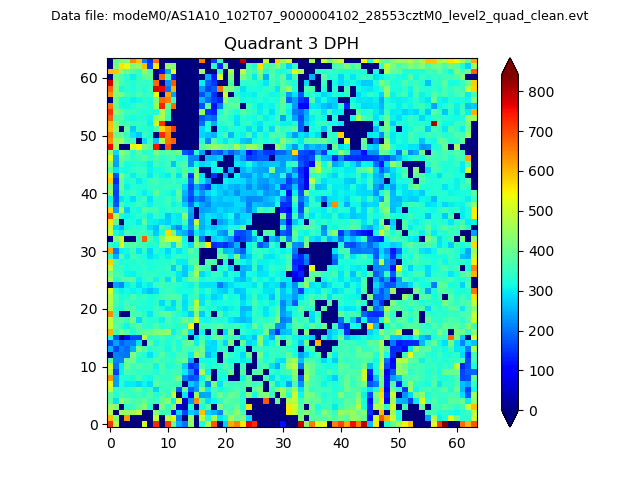 |
 |
Quadrant C |
| Plot type | Count rate plots | Images |
|---|---|---|
| Comparison with Poisson distribution Blue bars denote a histogram of data divided into 1 sec bins. Red curve is a Poisson curve with rate = median count rate of data. |
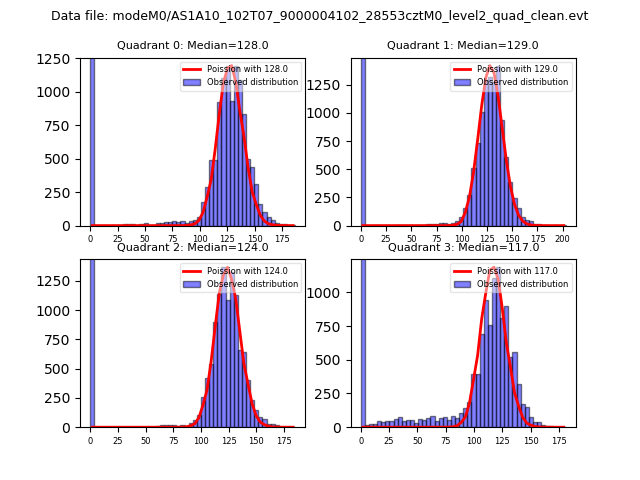 |
 |
| Quadrant-wise count rates Data is divided into 100 sec bins |
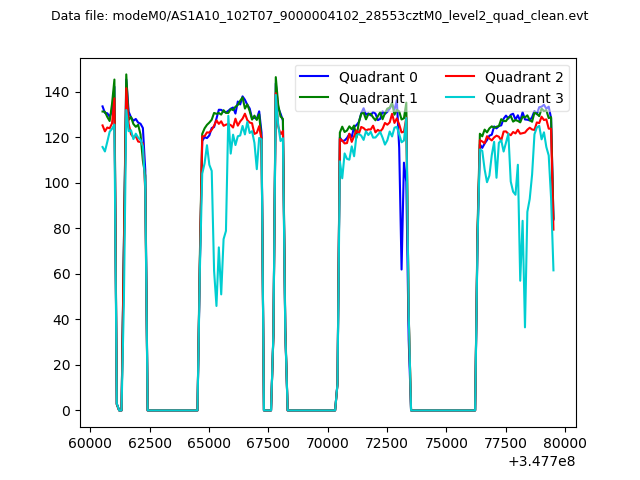 |
|
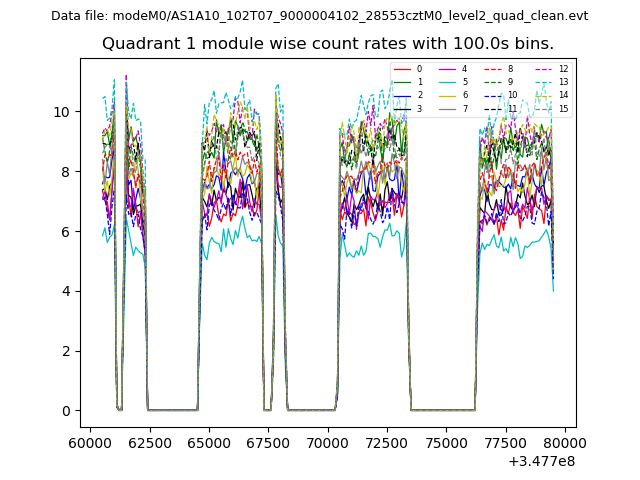
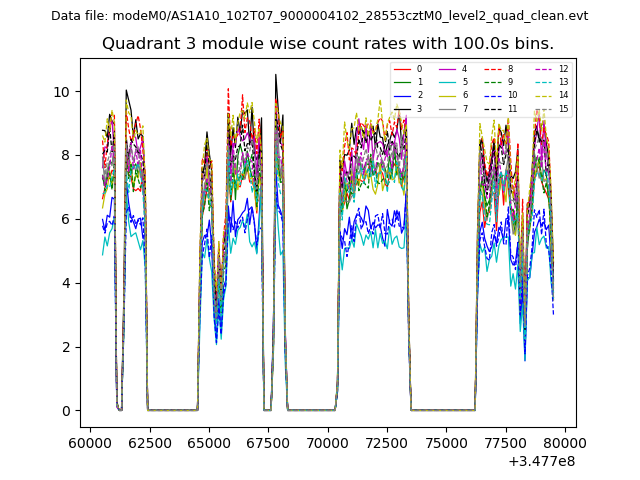
| Module-wise count rates for Quadrant A Data is divided into 100 sec bins |
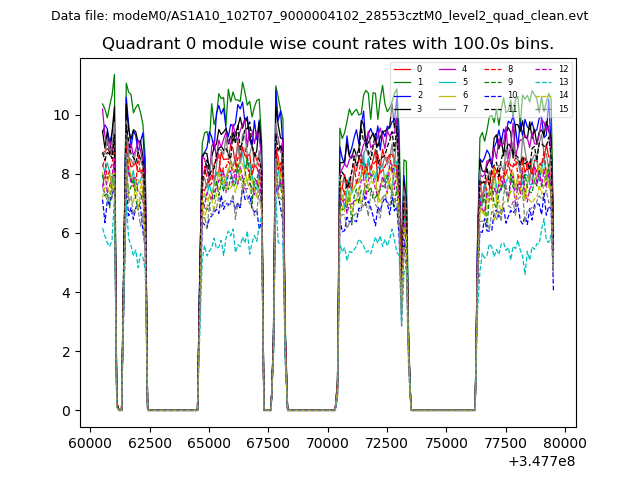 |
 |
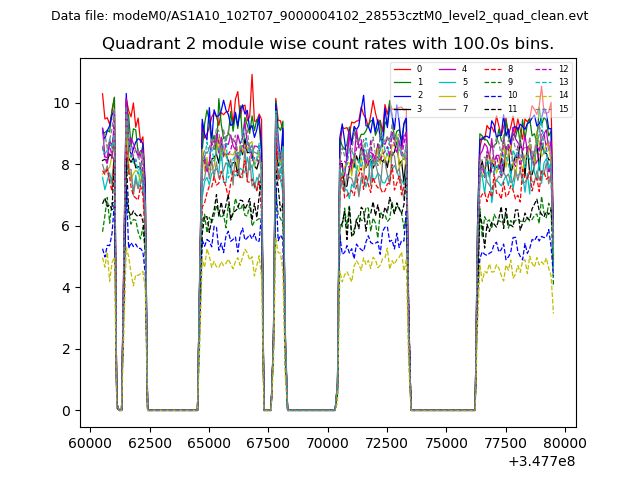
| Module-wise count rates for Quadrant B Data is divided into 100 sec bins |
 |
 |
| Module-wise count rates for Quadrant C Data is divided into 100 sec bins |
 |
 |
| Module-wise count rates for Quadrant D Data is divided into 100 sec bins |
 |
 |
| Parameter | Plot |
|---|---|
| CZT HV Monitor | 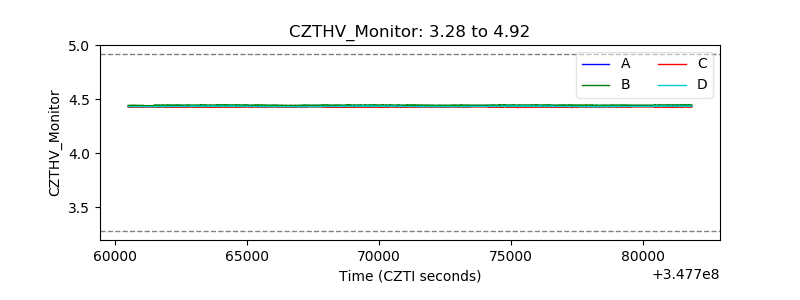 |
| D_VDD | 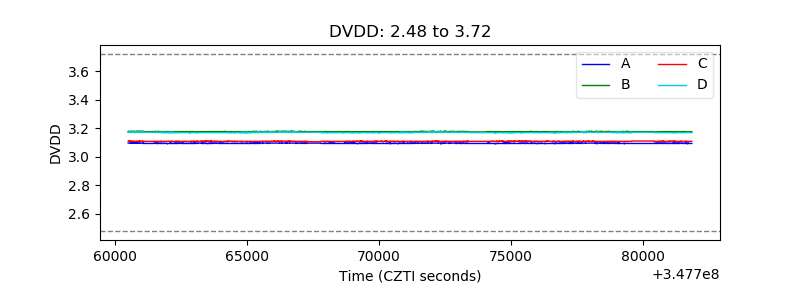 |
| Temperature 1 | 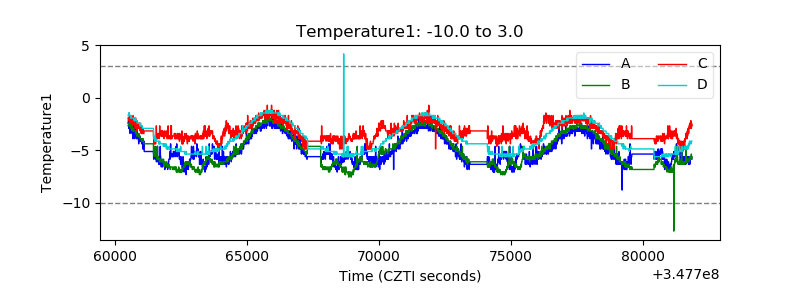 |
| Veto HV Monitor | 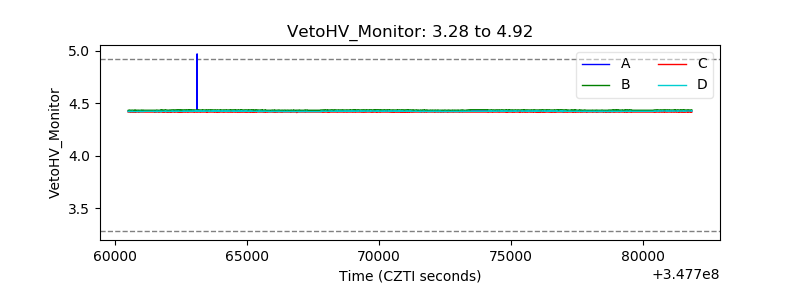 |
| Veto LLD | 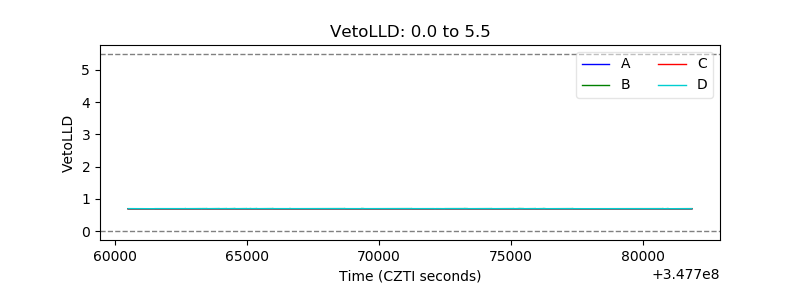 |
| Alpha Counter | 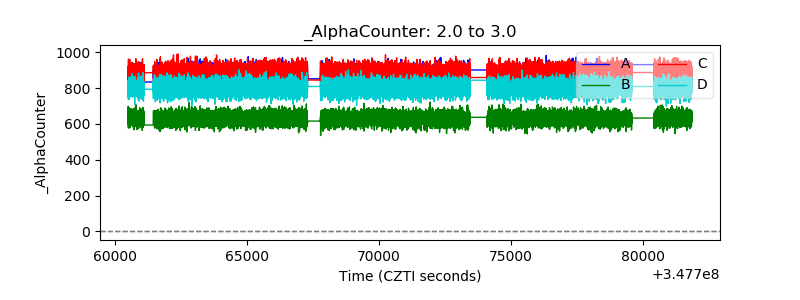 |
| _CPM_Rate | 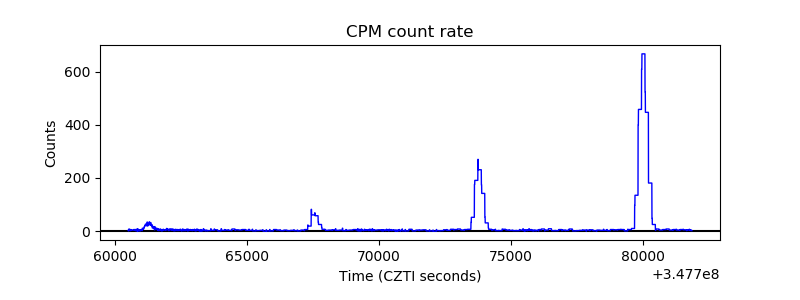 |
| CZT Counter | 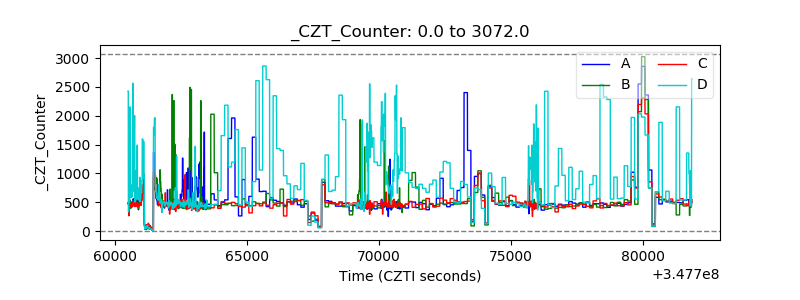 |
| +2.5 Volts monitor |  |
| +5 Volts monitor |  |
| _ROLL_ROT | 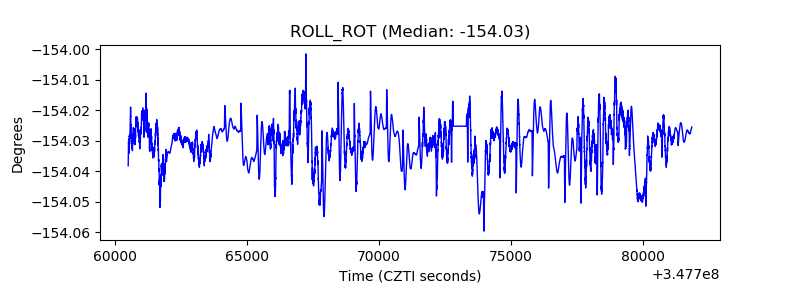 |
| _Roll_DEC | 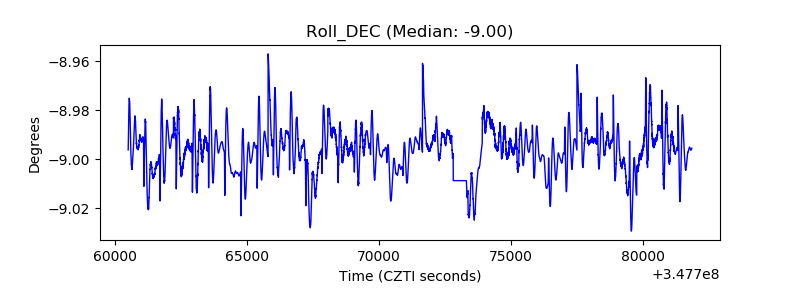 |
| _Roll_RA | 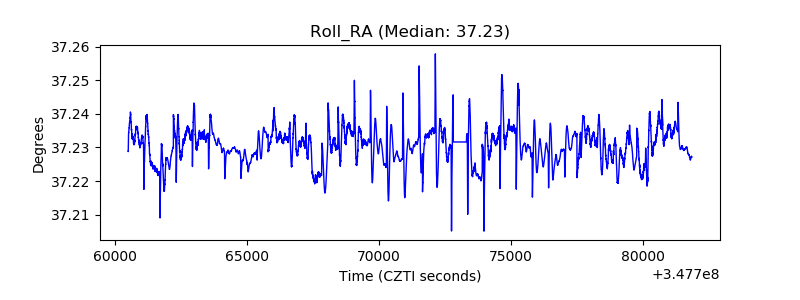 |
| Veto Counter | 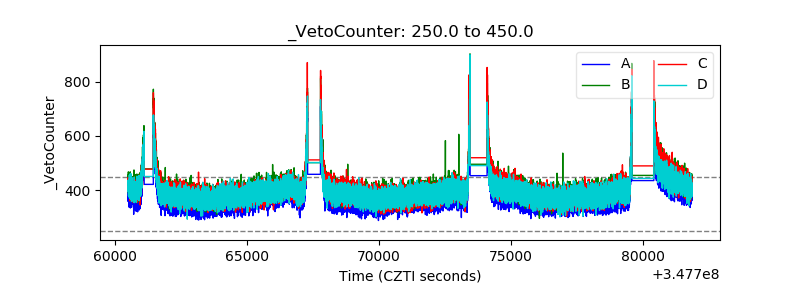 |