| Param | Original file | Final file |
|---|---|---|
| Filename | modeM0/AS1A10_102T07_9000004102_28556cztM0_level2.evt | modeM0/AS1A10_102T07_9000004102_28556cztM0_level2_quad_clean.evt |
| Size (bytes) | 489,234,240 | 85,682,880 |
| Size | 466.6 MB | 81.7 MB |
| Events in quadrant A | 3,432,417 | 547,253 |
| Events in quadrant B | 3,546,302 | 552,021 |
| Events in quadrant C | 3,423,262 | 521,752 |
| Events in quadrant D | 3,969,538 | 516,459 |
| Mode M0 | |||
|---|---|---|---|
| Quadrant | BADHDUFLAG | Total packets | Discarded packets |
| A | 0 | 14290 | 2 |
| B | 0 | 14710 | 2 |
| C | 0 | 14427 | 2 |
| D | 0 | 15878 | 2 |
| Mode SS | |||
|---|---|---|---|
| Quadrant | BADHDUFLAG | Total packets | Discarded packets |
| A | 0 | 132 | 0 |
| B | 0 | 132 | 0 |
| C | 0 | 132 | 0 |
| D | 0 | 132 | 0 |
| Mode M9 | |||
|---|---|---|---|
| Quadrant | BADHDUFLAG | Total packets | Discarded packets |
| A | 0 | 14 | 0 |
| B | 0 | 15 | 0 |
| C | 0 | 15 | 0 |
| D | 0 | 15 | 0 |
| Quadrant | Total seconds | Saturated seconds | Saturation percentage |
|---|---|---|---|
| A | 6560 | 94 | 1.432927% |
| B | 6560 | 130 | 1.981707% |
| C | 6560 | 140 | 2.134146% |
| D | 6560 | 91 | 1.387195% |
Noise dominated data is calculated using 1-second bins in cleaned event files. If a bin has >2000 counts, and if more than 50% of those come from <1% of pixels, then it is considered to be noise-dominated and hence unusable.
| Quadrant | # 1 sec bins | Bins with >0 counts | Bins with >2000 counts | High rate bins dominated by noise | Noise dominated (total time) | Noise dominated (detector-on time) | Marked lightcurve |
|---|---|---|---|---|---|---|---|
| A | 7655 | 6560 | 1 | 1 | 0.01% | 0.02% | 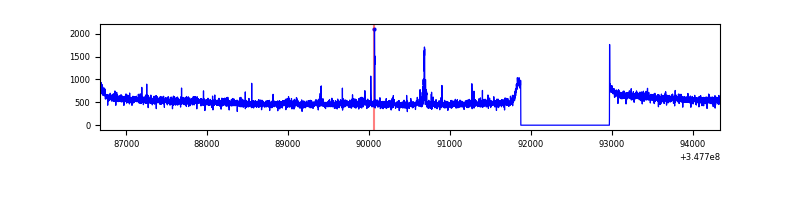 |
| B | 7655 | 6560 | 11 | 11 | 0.14% | 0.17% | 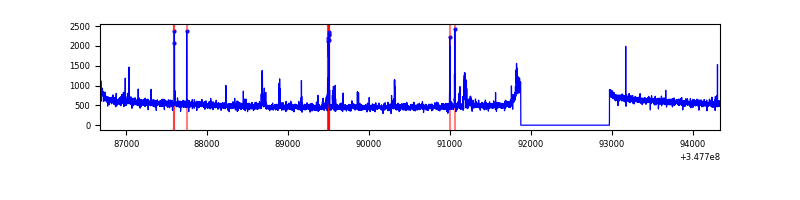 |
| C | 7655 | 6560 | 3 | 3 | 0.04% | 0.05% | 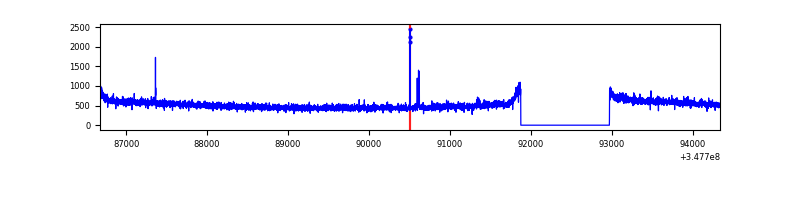 |
| D | 7655 | 6560 | 31 | 31 | 0.40% | 0.47% | 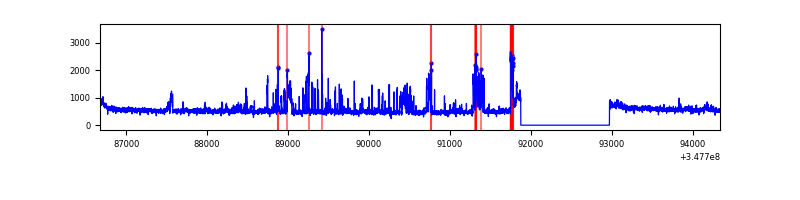 |
Top three noisy pixels from each quadrant. If the there are fewer than three noisy pixels in the level2.evt file, extra rows are filled as -1
| Pixel properties | Quadrant properties | ||||||
|---|---|---|---|---|---|---|---|
| Quadrant | DetID | PixID | Counts | Sigma | Mean | Median | Sigma |
| A | 15 | 174 | 55886 | 316.52 | 873 | 857 | 173.9 |
| A | 13 | 254 | 10013 | 52.66 | 873 | 857 | 173.9 |
| A | 3 | 137 | 8287 | 42.74 | 873 | 857 | 173.9 |
| B | 4 | 171 | 98988 | 592.66 | 864 | 841 | 165.6 |
| B | 10 | 245 | 42446 | 251.23 | 864 | 841 | 165.6 |
| B | 12 | 111 | 20162 | 116.67 | 864 | 841 | 165.6 |
| C | 14 | 238 | 133130 | 686.43 | 824 | 829 | 192.7 |
| C | 7 | 247 | 36278 | 183.92 | 824 | 829 | 192.7 |
| C | 3 | 233 | 28351 | 142.79 | 824 | 829 | 192.7 |
| D | 1 | 52 | 450650 | 2262.44 | 839 | 820 | 198.8 |
| D | 8 | 195 | 278214 | 1395.16 | 839 | 820 | 198.8 |
| D | 2 | 250 | 29246 | 142.97 | 839 | 820 | 198.8 |
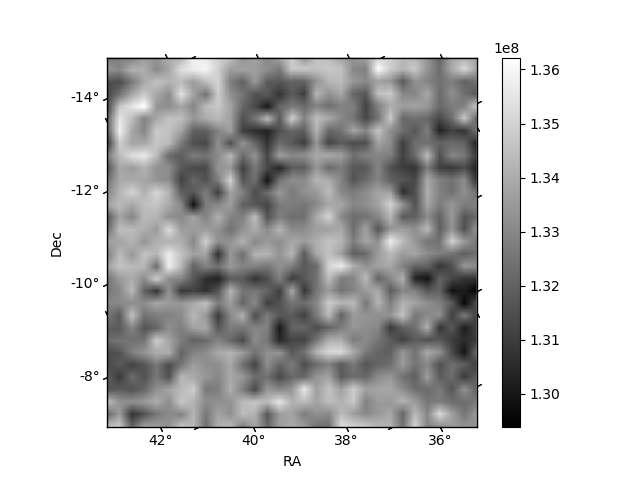
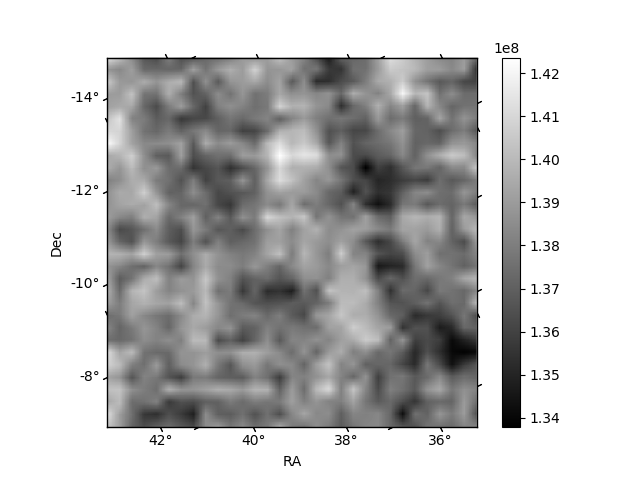
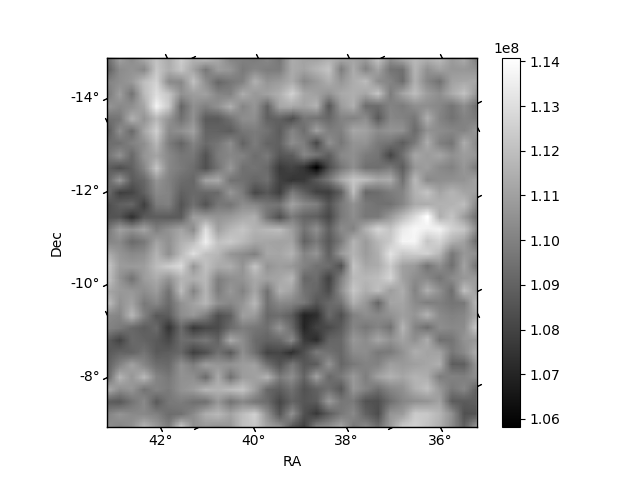
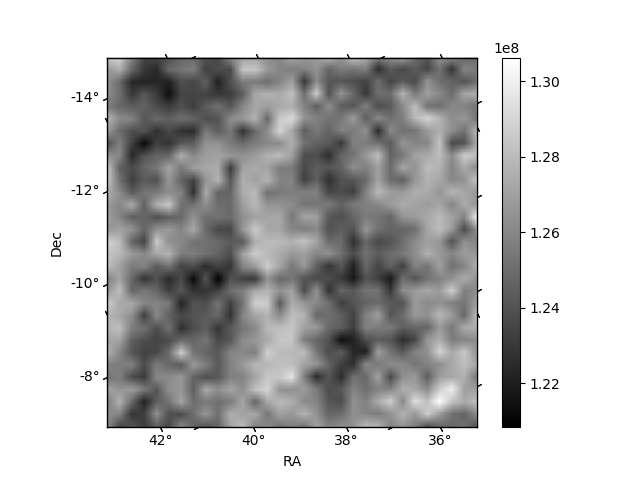
Histogram calculated using DETX and DETY for each event in the final _common_clean file
| Quadrant A | 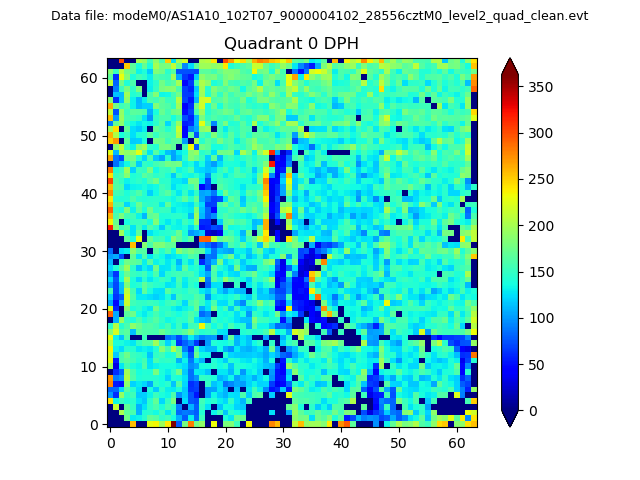 |
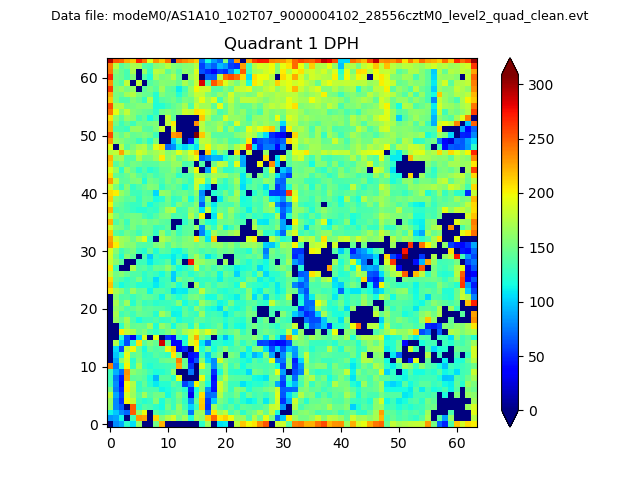 |
Quadrant B |
|---|---|---|---|
| Quadrant D | 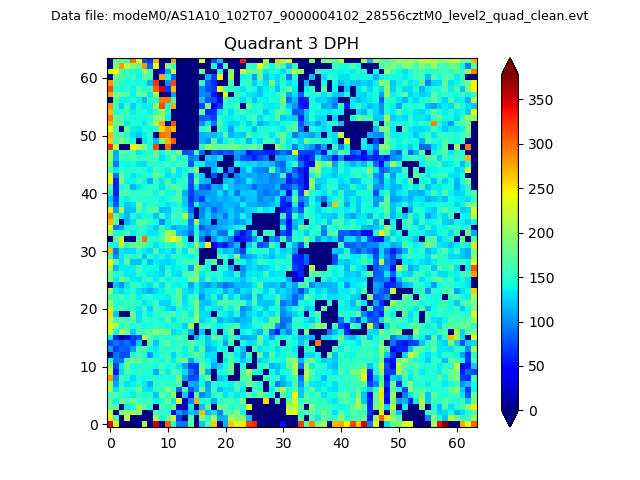 |
 |
Quadrant C |
| Plot type | Count rate plots | Images |
|---|---|---|
| Comparison with Poisson distribution Blue bars denote a histogram of data divided into 1 sec bins. Red curve is a Poisson curve with rate = median count rate of data. |
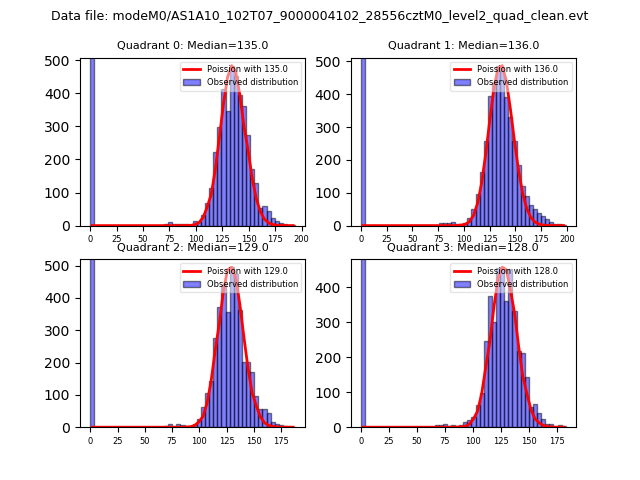 |
 |
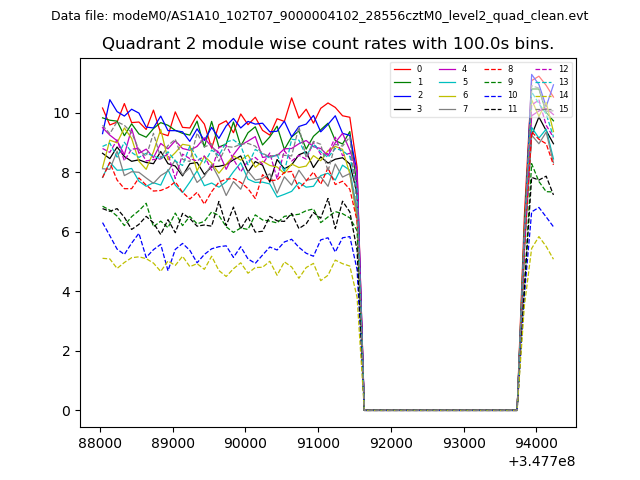
| Quadrant-wise count rates Data is divided into 100 sec bins |
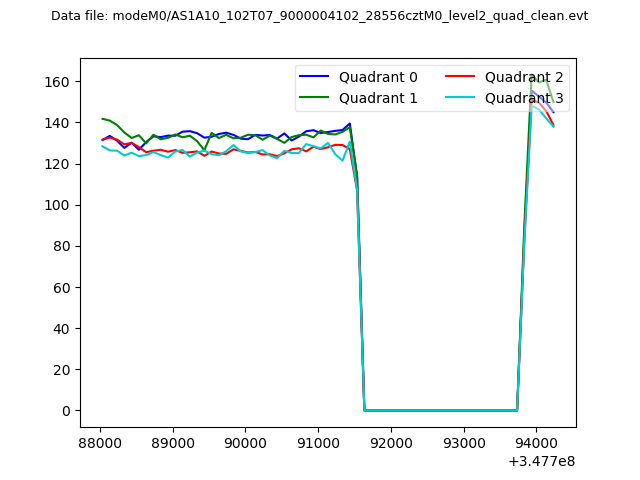 |
|
| Module-wise count rates for Quadrant A Data is divided into 100 sec bins |
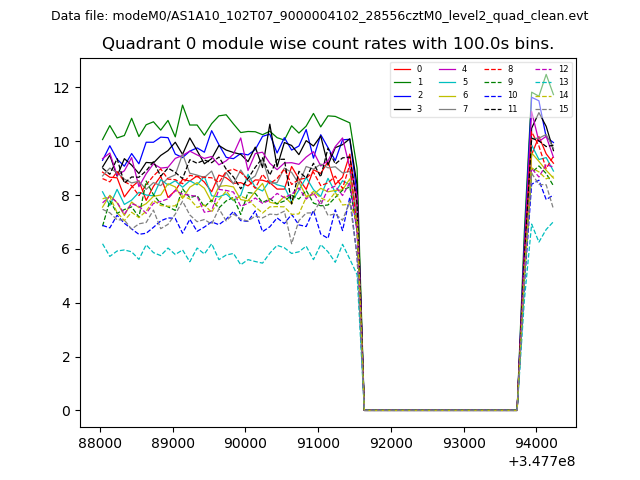 |
 |
| Module-wise count rates for Quadrant B Data is divided into 100 sec bins |
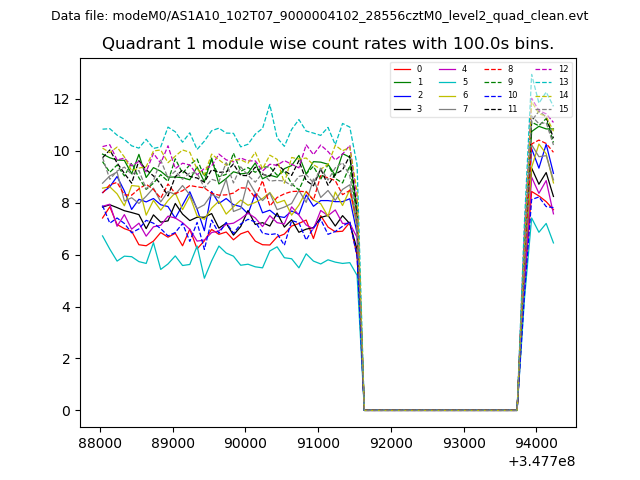 |
 |
| Module-wise count rates for Quadrant C Data is divided into 100 sec bins |
 |
 |
| Module-wise count rates for Quadrant D Data is divided into 100 sec bins |
 |
 |
| Parameter | Plot |
|---|---|
| CZT HV Monitor | 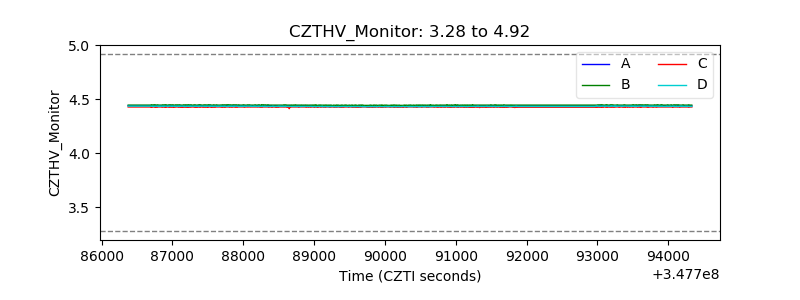 |
| D_VDD | 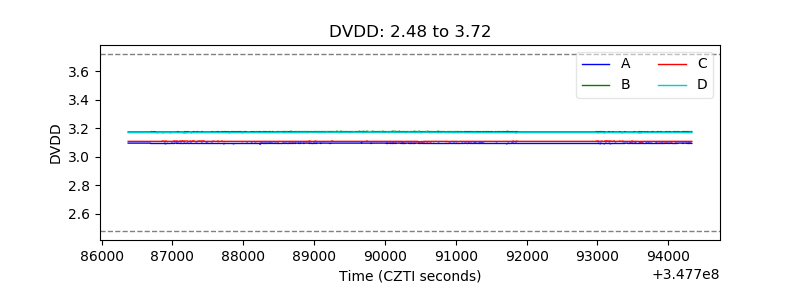 |
| Temperature 1 | 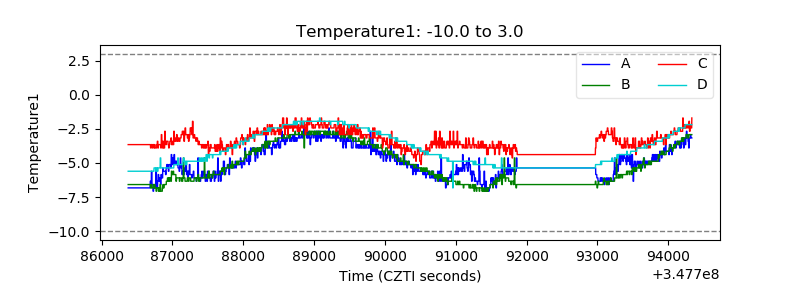 |
| Veto HV Monitor | 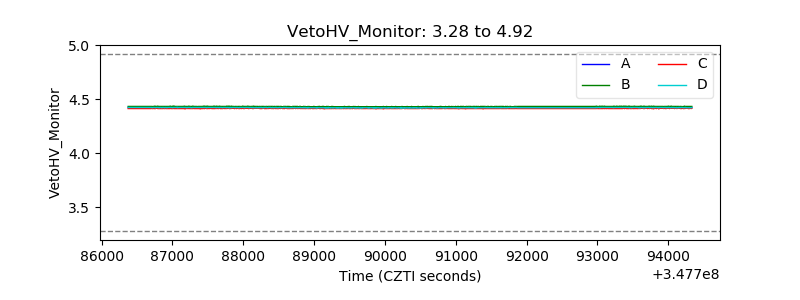 |
| Veto LLD | 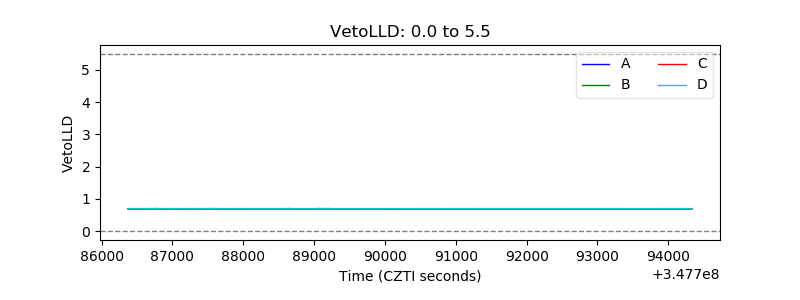 |
| Alpha Counter | 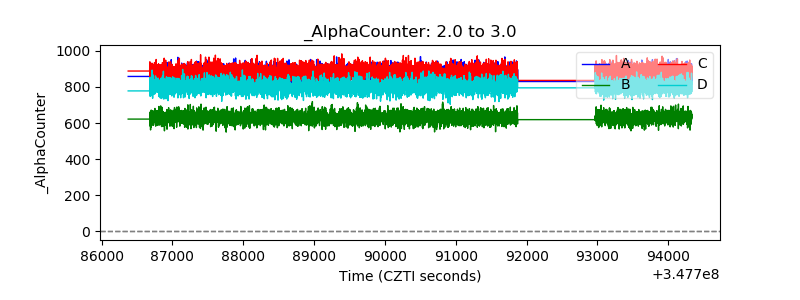 |
| _CPM_Rate | 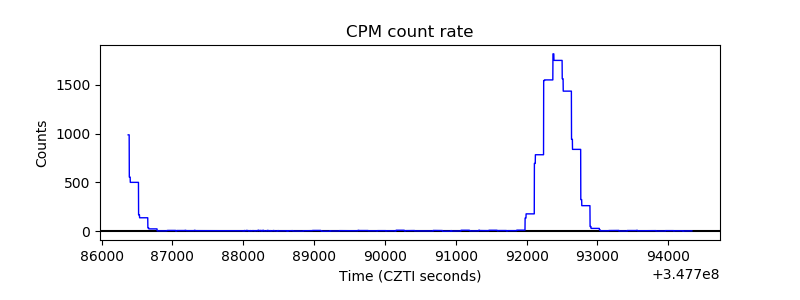 |
| CZT Counter |  |
| +2.5 Volts monitor |  |
| +5 Volts monitor |  |
| _ROLL_ROT |  |
| _Roll_DEC |  |
| _Roll_RA |  |
| Veto Counter |  |