| Param | Original file | Final file |
|---|---|---|
| Filename | modeM0/AS1A10_102T07_9000004102_28557cztM0_level2.evt | modeM0/AS1A10_102T07_9000004102_28557cztM0_level2_quad_clean.evt |
| Size (bytes) | 458,438,400 | 98,023,680 |
| Size | 437.2 MB | 93.5 MB |
| Events in quadrant A | 3,194,967 | 657,776 |
| Events in quadrant B | 3,340,666 | 663,953 |
| Events in quadrant C | 3,265,980 | 617,065 |
| Events in quadrant D | 3,678,172 | 613,958 |
| Mode M0 | |||
|---|---|---|---|
| Quadrant | BADHDUFLAG | Total packets | Discarded packets |
| A | 0 | 13300 | 1 |
| B | 0 | 13688 | 1 |
| C | 0 | 13448 | 1 |
| D | 0 | 14703 | 1 |
| Mode SS | |||
|---|---|---|---|
| Quadrant | BADHDUFLAG | Total packets | Discarded packets |
| A | 0 | 120 | 0 |
| B | 0 | 120 | 0 |
| C | 0 | 120 | 0 |
| D | 0 | 120 | 0 |
| Mode M9 | |||
|---|---|---|---|
| Quadrant | BADHDUFLAG | Total packets | Discarded packets |
| A | 0 | 12 | 0 |
| B | 0 | 12 | 0 |
| C | 0 | 12 | 0 |
| D | 0 | 12 | 0 |
| Quadrant | Total seconds | Saturated seconds | Saturation percentage |
|---|---|---|---|
| A | 5958 | 75 | 1.258812% |
| B | 5958 | 102 | 1.711984% |
| C | 5958 | 116 | 1.946962% |
| D | 5959 | 75 | 1.258600% |
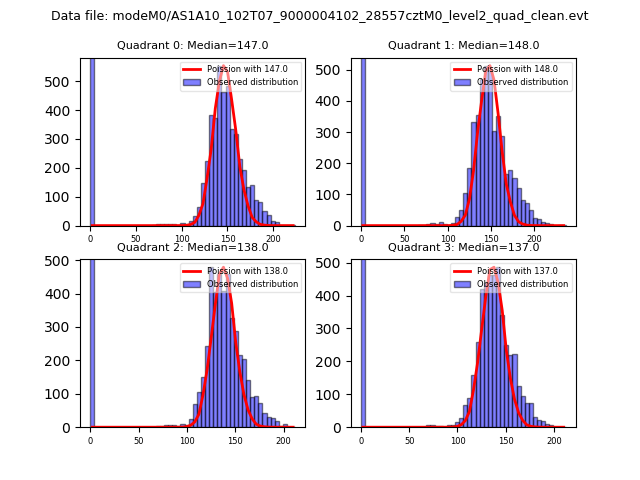
Noise dominated data is calculated using 1-second bins in cleaned event files. If a bin has >2000 counts, and if more than 50% of those come from <1% of pixels, then it is considered to be noise-dominated and hence unusable.
| Quadrant | # 1 sec bins | Bins with >0 counts | Bins with >2000 counts | High rate bins dominated by noise | Noise dominated (total time) | Noise dominated (detector-on time) | Marked lightcurve |
|---|---|---|---|---|---|---|---|
| A | 7153 | 5958 | 0 | 0 | 0.00% | 0.00% | 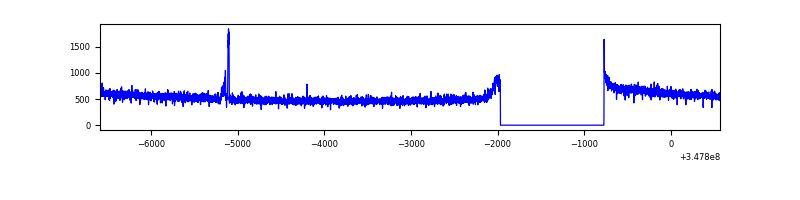 |
| B | 7153 | 5958 | 10 | 10 | 0.14% | 0.17% | 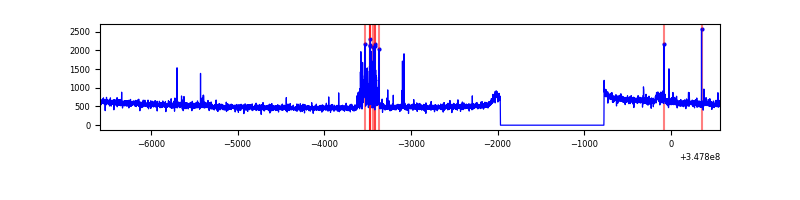 |
| C | 7153 | 5958 | 0 | 0 | 0.00% | 0.00% | 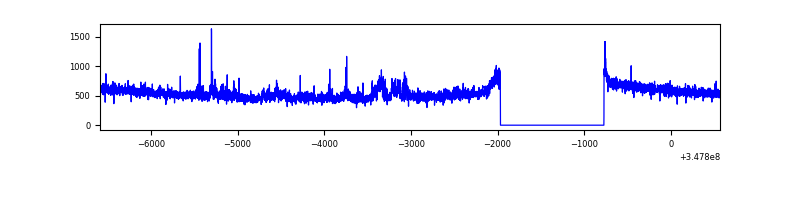 |
| D | 7154 | 5959 | 40 | 40 | 0.56% | 0.67% | 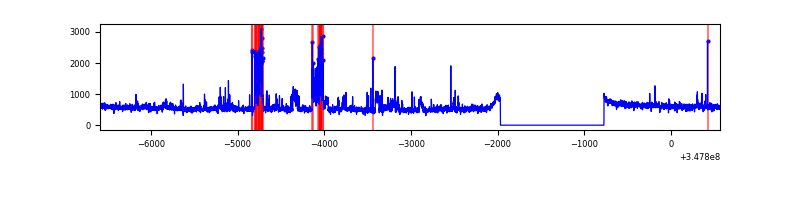 |
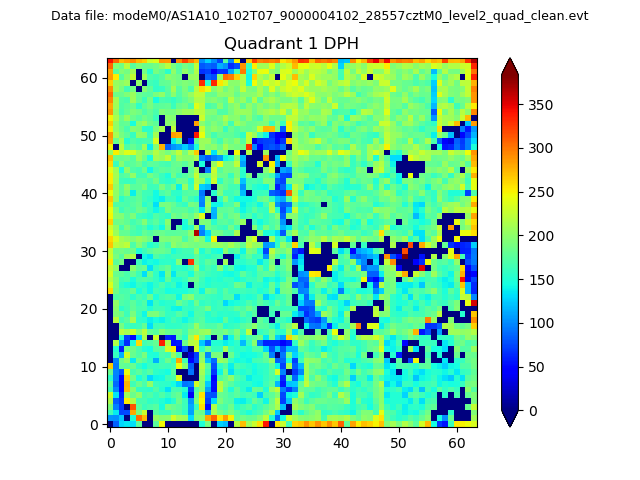
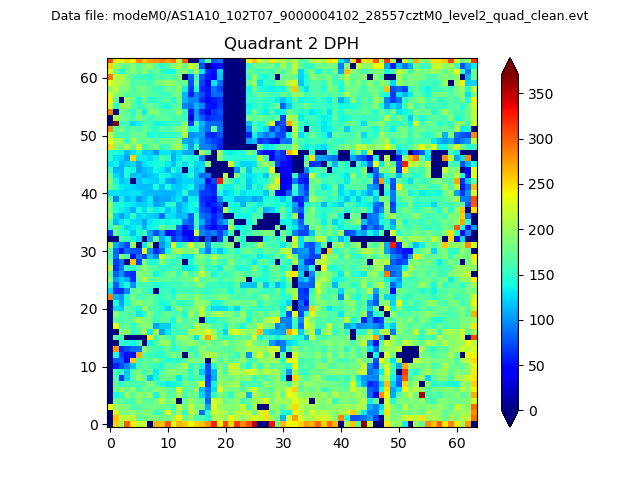
Top three noisy pixels from each quadrant. If the there are fewer than three noisy pixels in the level2.evt file, extra rows are filled as -1
| Pixel properties | Quadrant properties | ||||||
|---|---|---|---|---|---|---|---|
| Quadrant | DetID | PixID | Counts | Sigma | Mean | Median | Sigma |
| A | 15 | 174 | 43133 | 261.77 | 817 | 804 | 161.7 |
| A | 13 | 254 | 8945 | 50.35 | 817 | 804 | 161.7 |
| A | 3 | 137 | 7373 | 40.62 | 817 | 804 | 161.7 |
| B | 4 | 171 | 133588 | 864.35 | 804 | 787 | 153.6 |
| B | 10 | 245 | 29704 | 188.21 | 804 | 787 | 153.6 |
| B | 12 | 111 | 18504 | 115.31 | 804 | 787 | 153.6 |
| C | 3 | 233 | 127414 | 713.51 | 761 | 767 | 177.5 |
| C | 14 | 238 | 124057 | 694.6 | 761 | 767 | 177.5 |
| C | 7 | 247 | 51034 | 283.2 | 761 | 767 | 177.5 |
| D | 8 | 195 | 471174 | 2571.8 | 781 | 764 | 182.9 |
| D | 1 | 52 | 198137 | 1079.07 | 781 | 764 | 182.9 |
| D | 2 | 234 | 22222 | 117.31 | 781 | 764 | 182.9 |
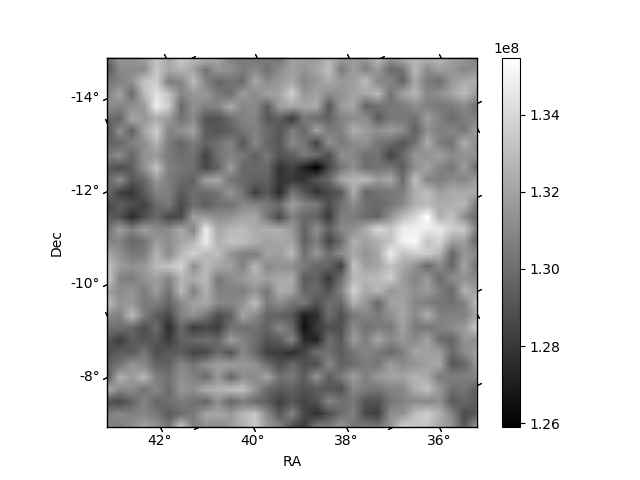
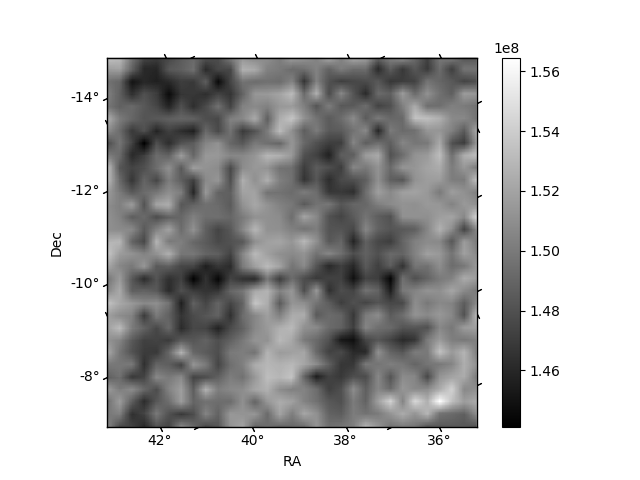
Histogram calculated using DETX and DETY for each event in the final _common_clean file
| Quadrant A | 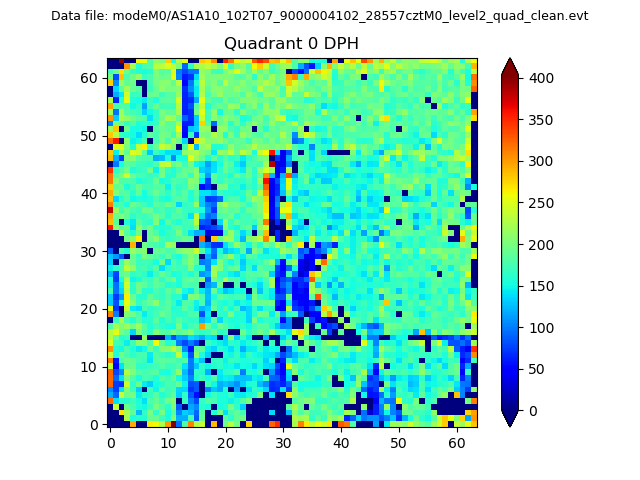 |
 |
Quadrant B |
|---|---|---|---|
| Quadrant D | 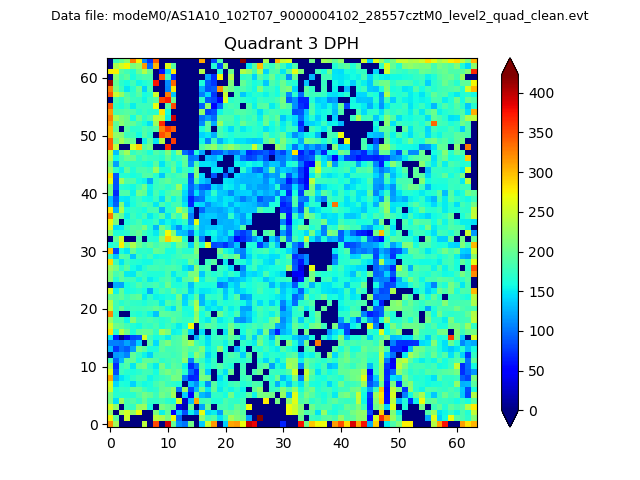 |
 |
Quadrant C |
| Plot type | Count rate plots | Images |
|---|---|---|
| Comparison with Poisson distribution Blue bars denote a histogram of data divided into 1 sec bins. Red curve is a Poisson curve with rate = median count rate of data. |
 |
 |
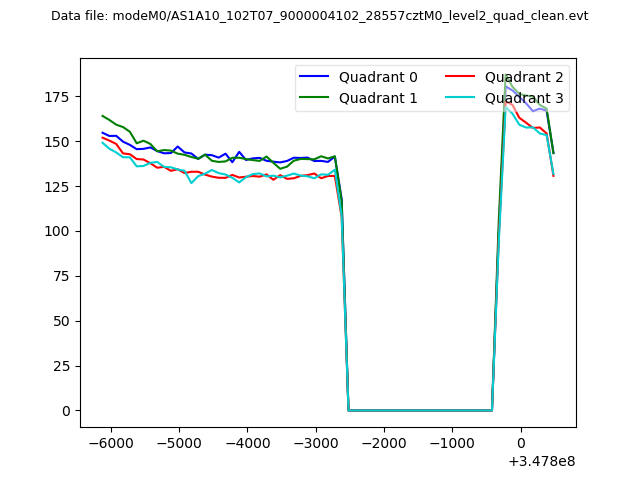
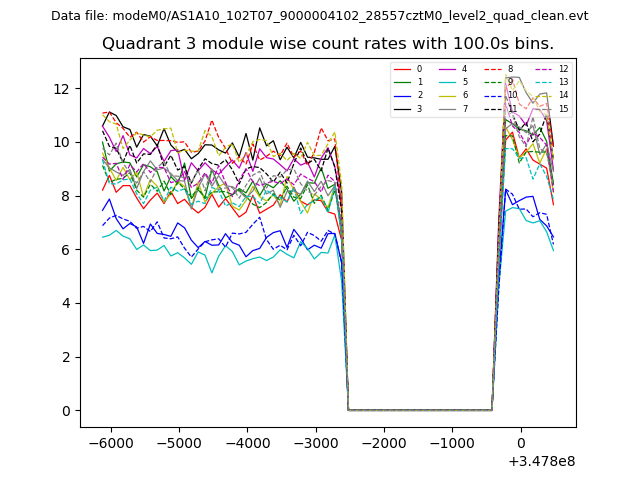
| Quadrant-wise count rates Data is divided into 100 sec bins |
 |
|
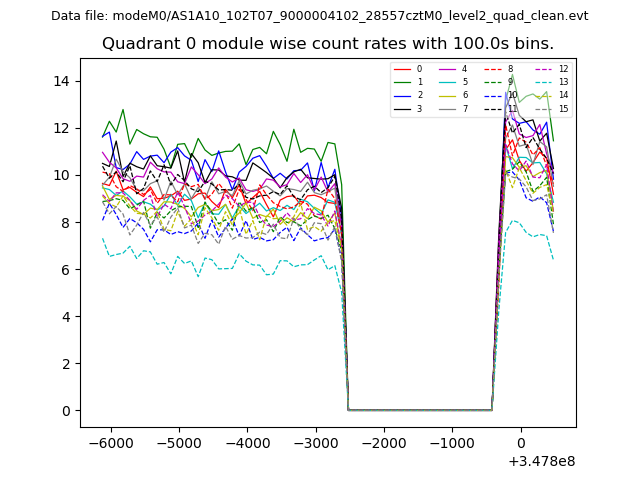
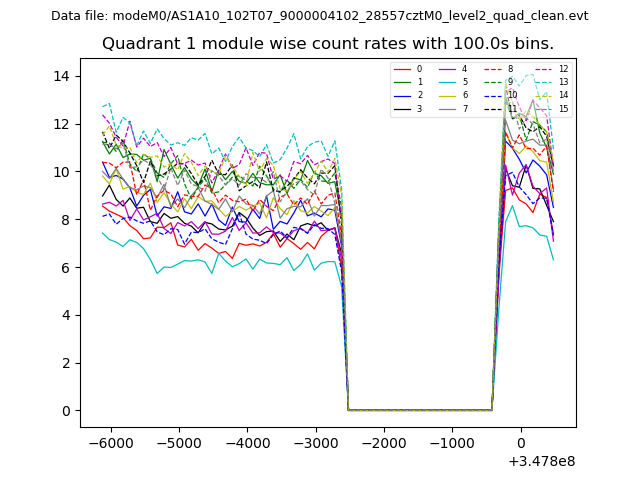
| Module-wise count rates for Quadrant A Data is divided into 100 sec bins |
 |
 |
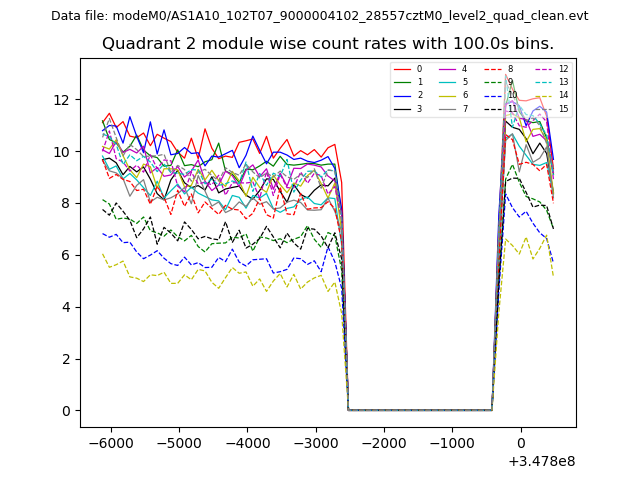
| Module-wise count rates for Quadrant B Data is divided into 100 sec bins |
 |
 |
| Module-wise count rates for Quadrant C Data is divided into 100 sec bins |
 |
 |
| Module-wise count rates for Quadrant D Data is divided into 100 sec bins |
 |
 |
| Parameter | Plot |
|---|---|
| CZT HV Monitor | 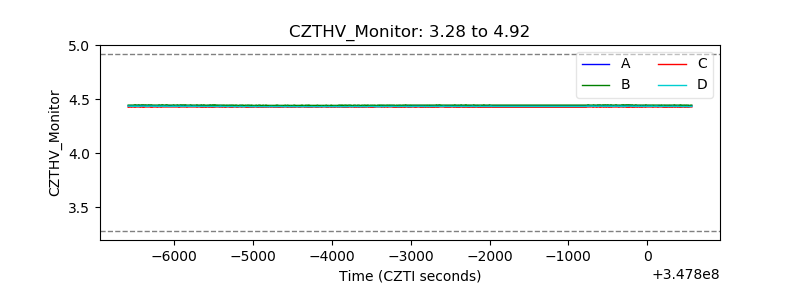 |
| D_VDD | 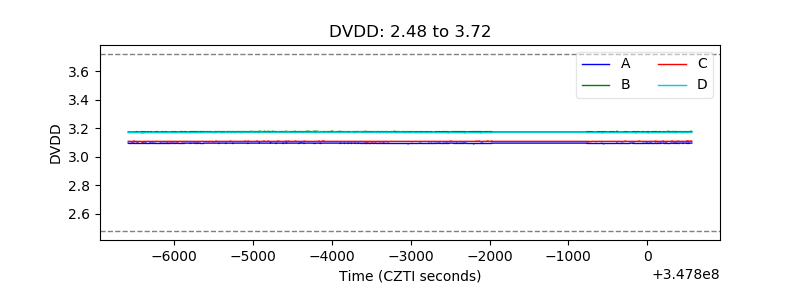 |
| Temperature 1 | 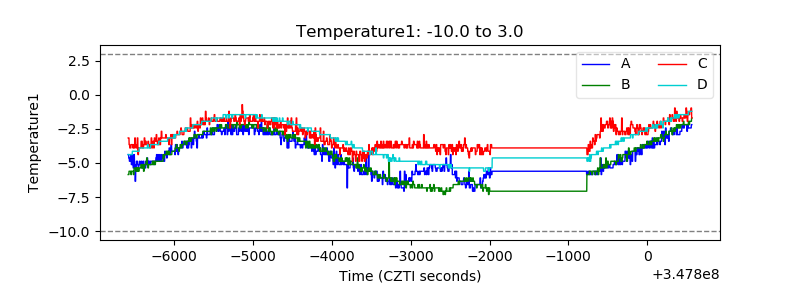 |
| Veto HV Monitor | 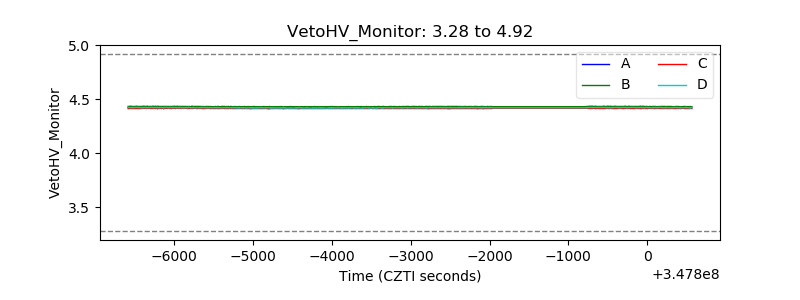 |
| Veto LLD | 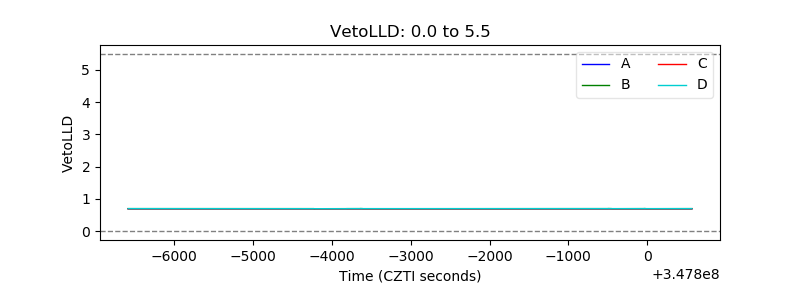 |
| Alpha Counter | 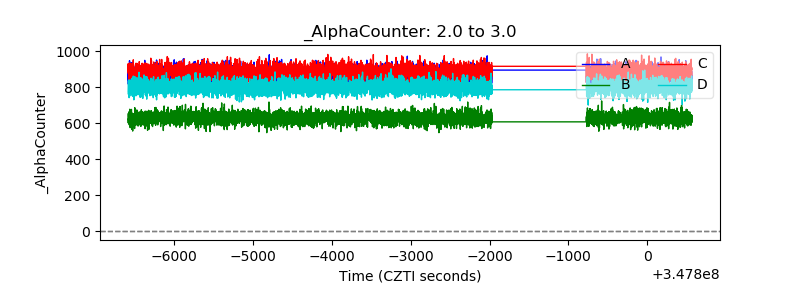 |
| _CPM_Rate | 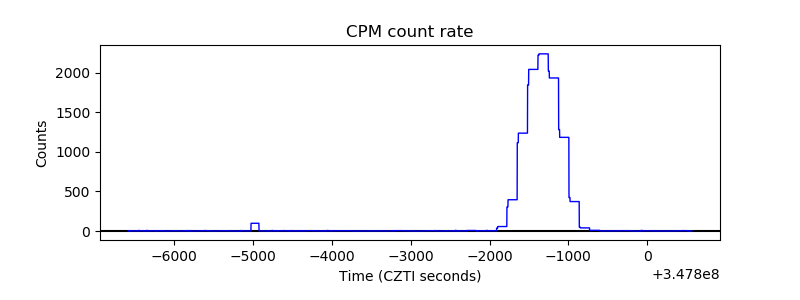 |
| CZT Counter | 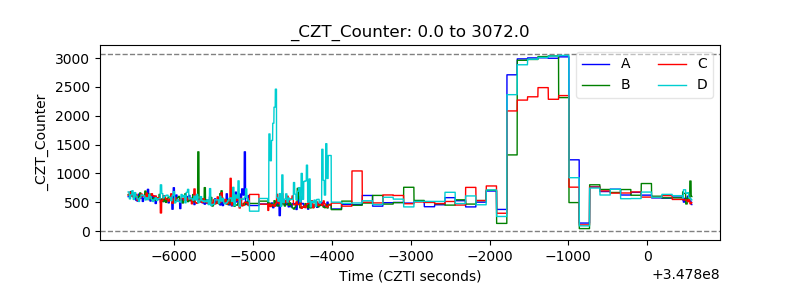 |
| +2.5 Volts monitor |  |
| +5 Volts monitor | 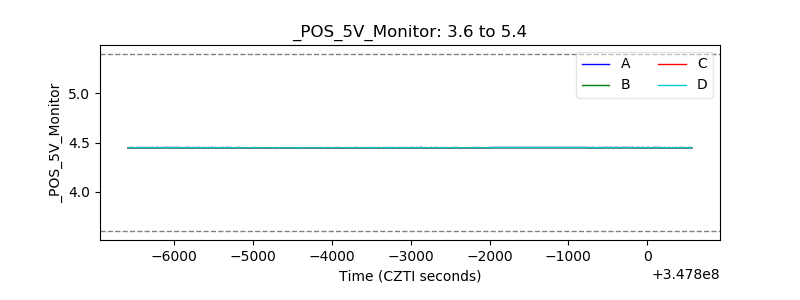 |
| _ROLL_ROT |  |
| _Roll_DEC |  |
| _Roll_RA | 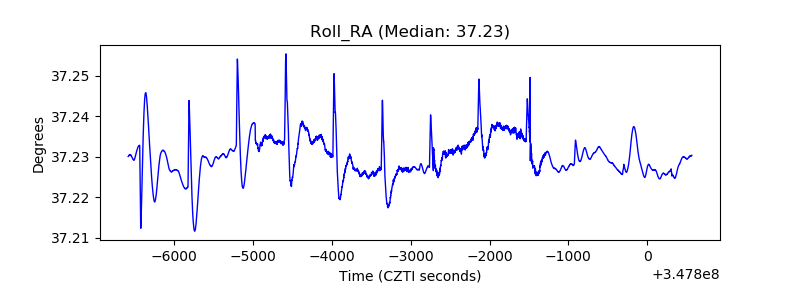 |
| Veto Counter | 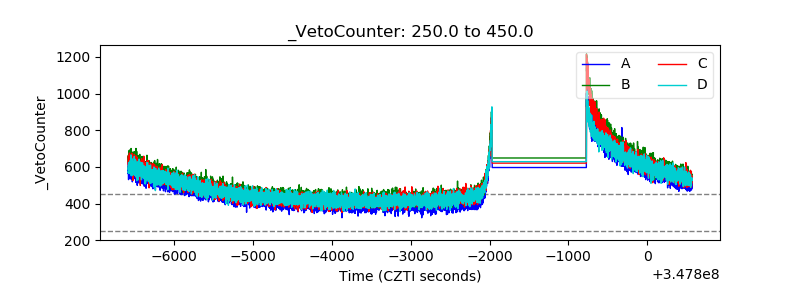 |