| Param | Original file | Final file |
|---|---|---|
| Filename | modeM0/AS1A10_102T07_9000004102_28558cztM0_level2.evt | modeM0/AS1A10_102T07_9000004102_28558cztM0_level2_quad_clean.evt |
| Size (bytes) | 2,740,495,680 | 444,507,840 |
| Size | 2.6 GB | 423.9 MB |
| Events in quadrant A | 17,480,393 | 2,912,342 |
| Events in quadrant B | 17,362,218 | 2,926,689 |
| Events in quadrant C | 16,170,233 | 2,781,479 |
| Events in quadrant D | 29,786,535 | 2,601,034 |
| Mode M0 | |||
|---|---|---|---|
| Quadrant | BADHDUFLAG | Total packets | Discarded packets |
| A | 0 | 72726 | 5 |
| B | 0 | 72091 | 5 |
| C | 0 | 68605 | 5 |
| D | 0 | 110043 | 10 |
| Mode SS | |||
|---|---|---|---|
| Quadrant | BADHDUFLAG | Total packets | Discarded packets |
| A | 0 | 660 | 0 |
| B | 0 | 660 | 0 |
| C | 0 | 660 | 0 |
| D | 0 | 660 | 0 |
| Mode M9 | |||
|---|---|---|---|
| Quadrant | BADHDUFLAG | Total packets | Discarded packets |
| A | 0 | 45 | 0 |
| B | 0 | 45 | 0 |
| C | 0 | 45 | 0 |
| D | 0 | 45 | 0 |
| Quadrant | Total seconds | Saturated seconds | Saturation percentage |
|---|---|---|---|
| A | 32634 | 664 | 2.034688% |
| B | 32635 | 750 | 2.298146% |
| C | 32635 | 517 | 1.584189% |
| D | 32634 | 2978 | 9.125452% |
Noise dominated data is calculated using 1-second bins in cleaned event files. If a bin has >2000 counts, and if more than 50% of those come from <1% of pixels, then it is considered to be noise-dominated and hence unusable.
| Quadrant | # 1 sec bins | Bins with >0 counts | Bins with >2000 counts | High rate bins dominated by noise | Noise dominated (total time) | Noise dominated (detector-on time) | Marked lightcurve |
|---|---|---|---|---|---|---|---|
| A | 44648 | 32634 | 190 | 190 | 0.43% | 0.58% | 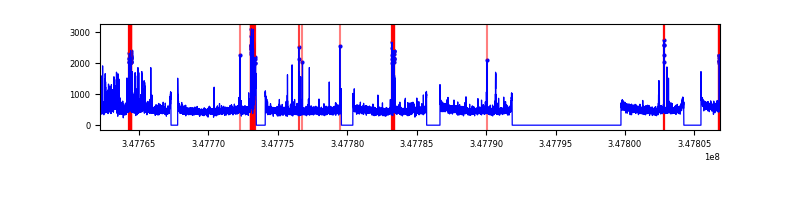 |
| B | 44649 | 32635 | 241 | 241 | 0.54% | 0.74% | 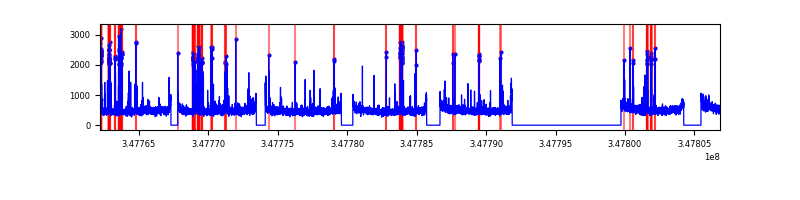 |
| C | 44649 | 32635 | 5 | 5 | 0.01% | 0.02% | 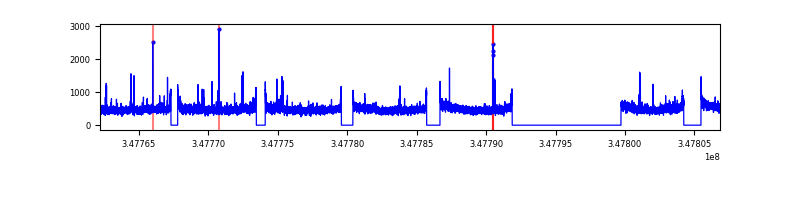 |
| D | 44648 | 32634 | 2906 | 2906 | 6.51% | 8.90% | 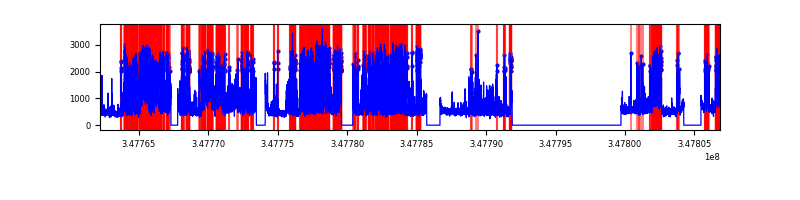 |
Top three noisy pixels from each quadrant. If the there are fewer than three noisy pixels in the level2.evt file, extra rows are filled as -1
| Pixel properties | Quadrant properties | ||||||
|---|---|---|---|---|---|---|---|
| Quadrant | DetID | PixID | Counts | Sigma | Mean | Median | Sigma |
| A | 15 | 174 | 1693205 | 2072.78 | 4080 | 3996 | 814.9 |
| A | 13 | 254 | 53278 | 60.47 | 4080 | 3996 | 814.9 |
| A | 3 | 137 | 39822 | 43.96 | 4080 | 3996 | 814.9 |
| B | 4 | 171 | 793220 | 1026.84 | 4033 | 3942 | 768.6 |
| B | 10 | 245 | 445331 | 574.24 | 4033 | 3942 | 768.6 |
| B | 10 | 246 | 155787 | 197.55 | 4033 | 3942 | 768.6 |
| C | 14 | 238 | 625369 | 683.69 | 3878 | 3907 | 909.0 |
| C | 7 | 247 | 252914 | 273.94 | 3878 | 3907 | 909.0 |
| C | 3 | 233 | 162566 | 174.54 | 3878 | 3907 | 909.0 |
| D | 1 | 52 | 10966209 | 12202.88 | 3817 | 3726 | 898.4 |
| D | 8 | 195 | 3966623 | 4411.3 | 3817 | 3726 | 898.4 |
| D | 10 | 199 | 123998 | 133.88 | 3817 | 3726 | 898.4 |
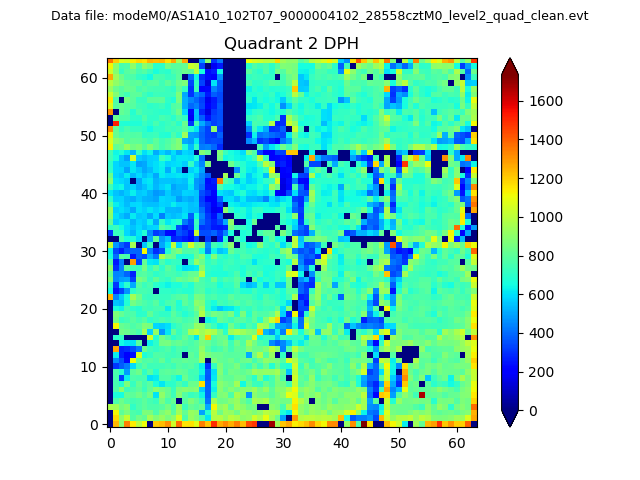
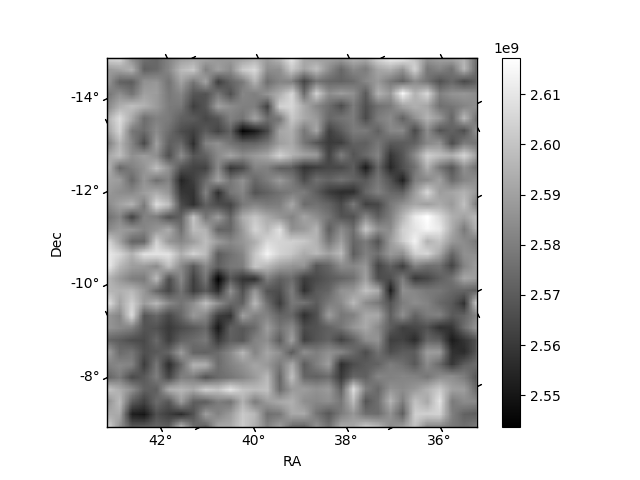
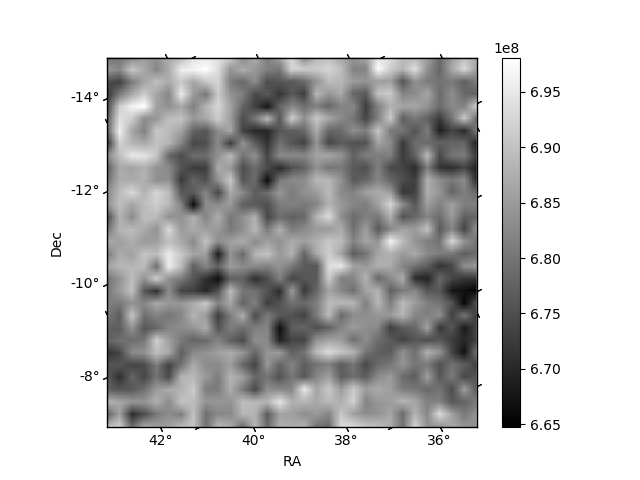
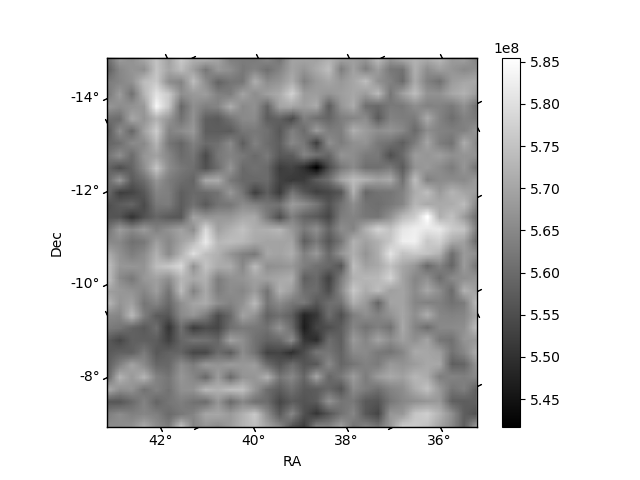
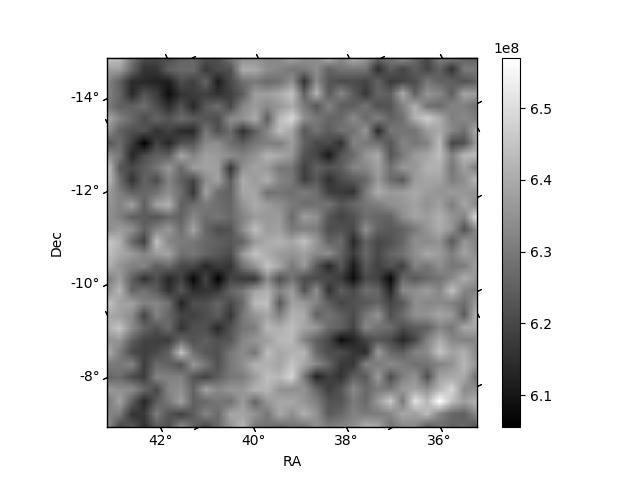
Histogram calculated using DETX and DETY for each event in the final _common_clean file
| Quadrant A | 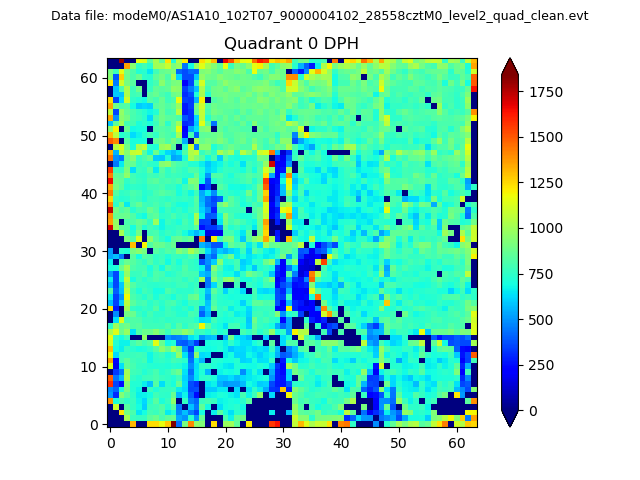 |
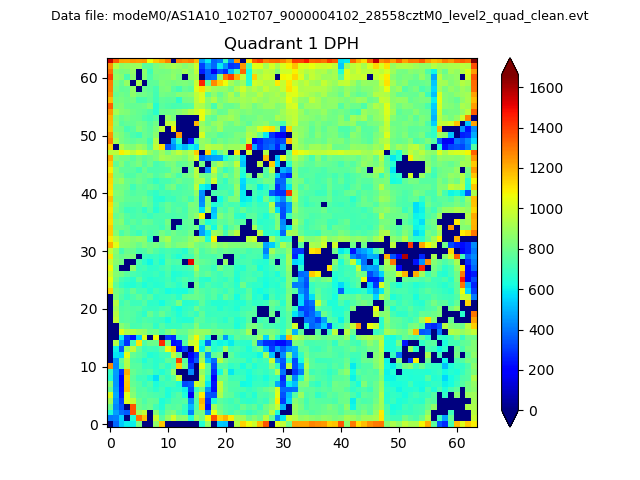 |
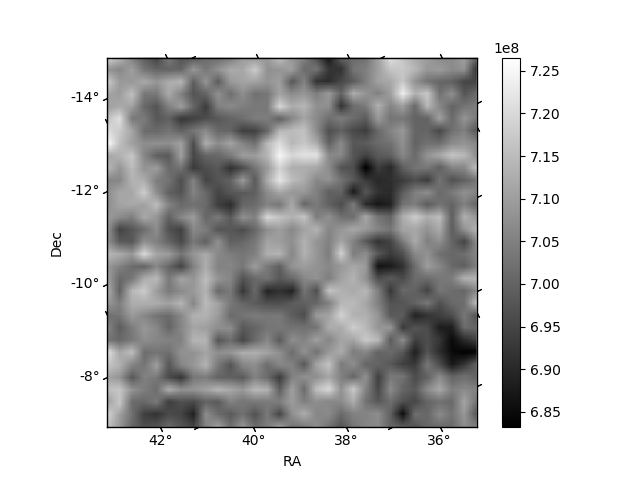
Quadrant B |
|---|---|---|---|
| Quadrant D | 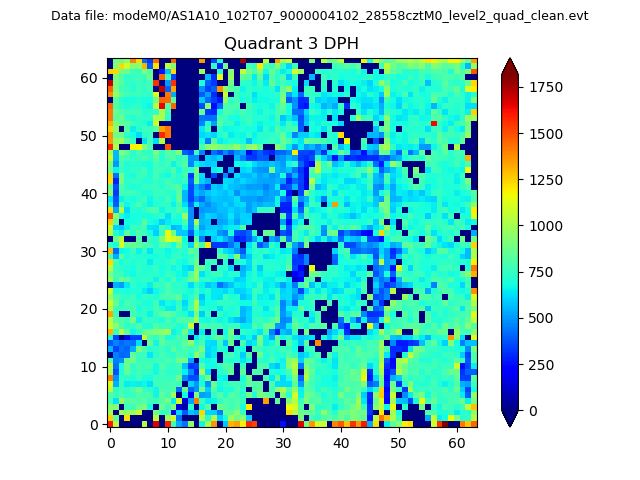 |
 |
Quadrant C |
| Plot type | Count rate plots | Images |
|---|---|---|
| Comparison with Poisson distribution Blue bars denote a histogram of data divided into 1 sec bins. Red curve is a Poisson curve with rate = median count rate of data. |
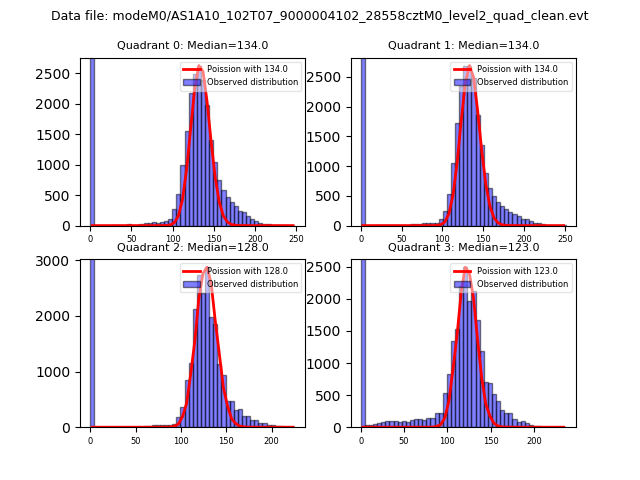 |
 |
| Quadrant-wise count rates Data is divided into 100 sec bins |
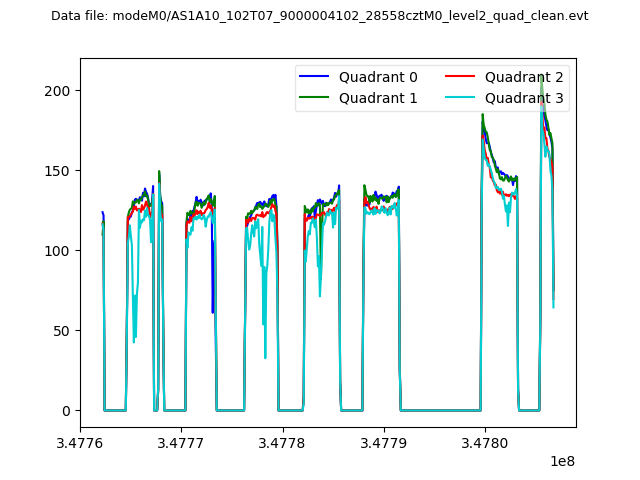 |
|
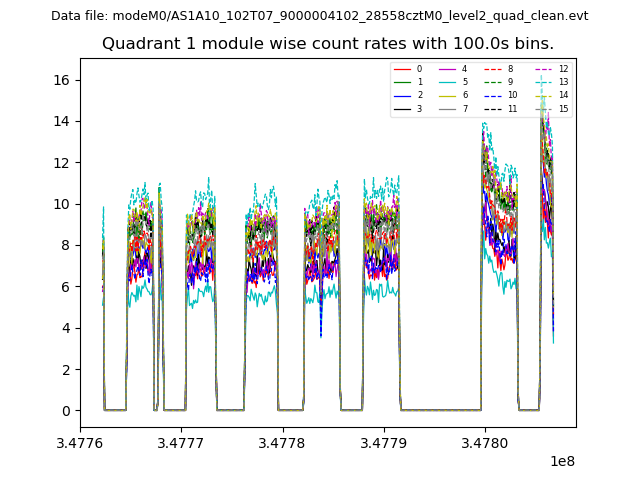
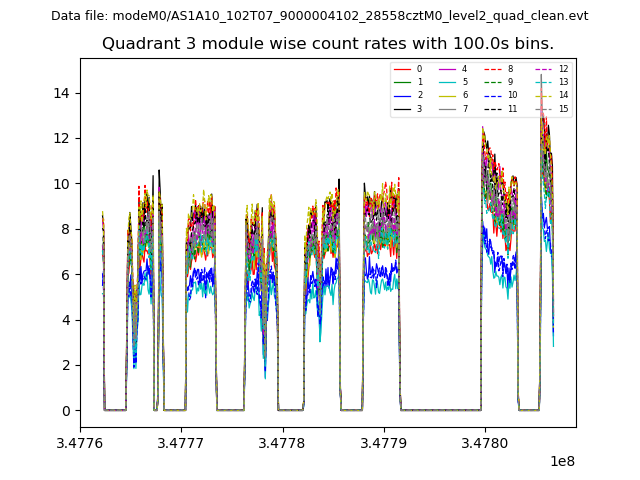
| Module-wise count rates for Quadrant A Data is divided into 100 sec bins |
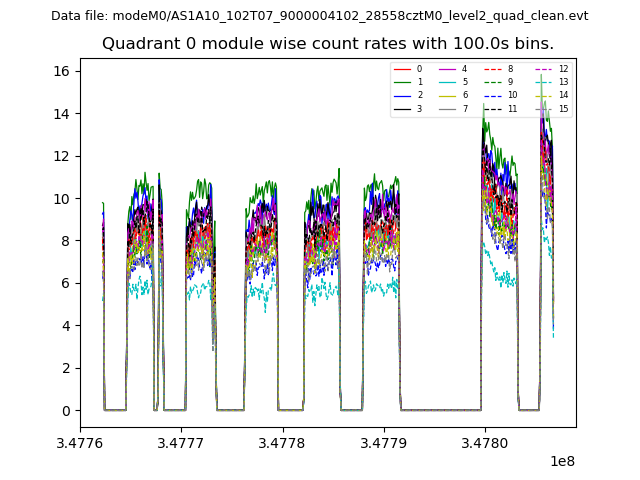 |
 |
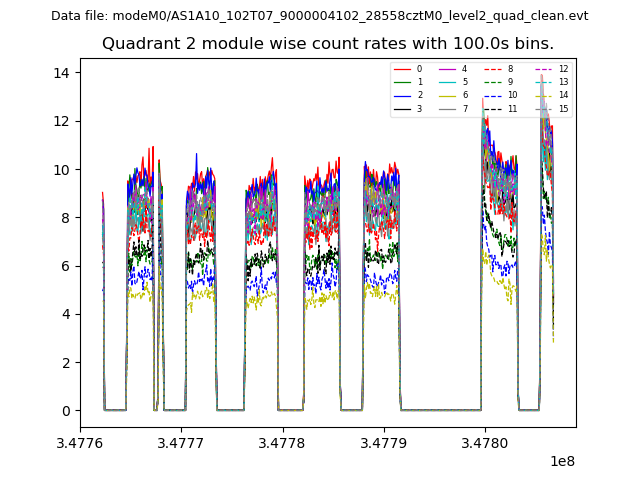
| Module-wise count rates for Quadrant B Data is divided into 100 sec bins |
 |
 |
| Module-wise count rates for Quadrant C Data is divided into 100 sec bins |
 |
 |
| Module-wise count rates for Quadrant D Data is divided into 100 sec bins |
 |
 |
| Parameter | Plot |
|---|---|
| CZT HV Monitor | 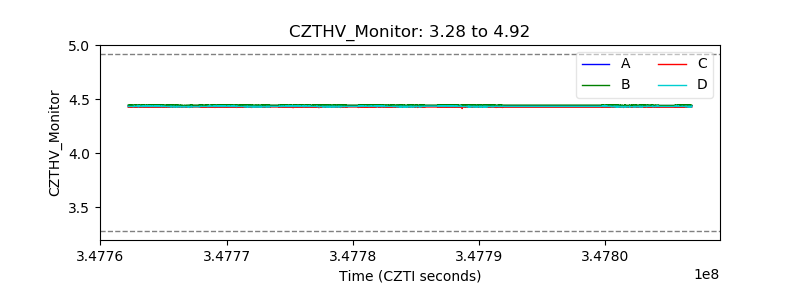 |
| D_VDD | 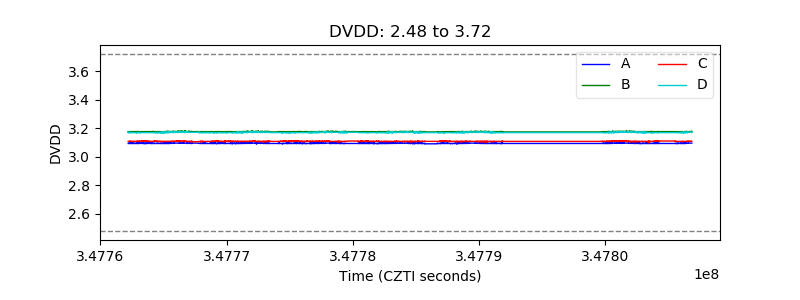 |
| Temperature 1 | 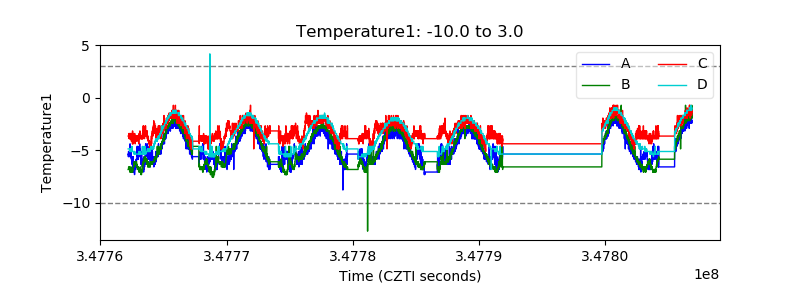 |
| Veto HV Monitor | 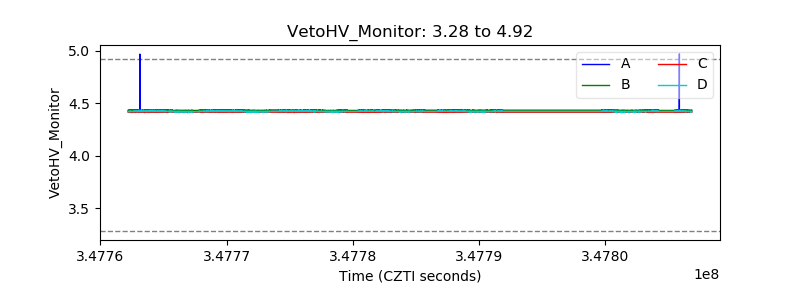 |
| Veto LLD | 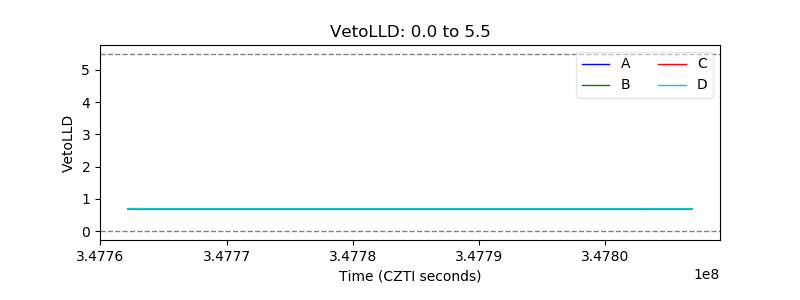 |
| Alpha Counter | 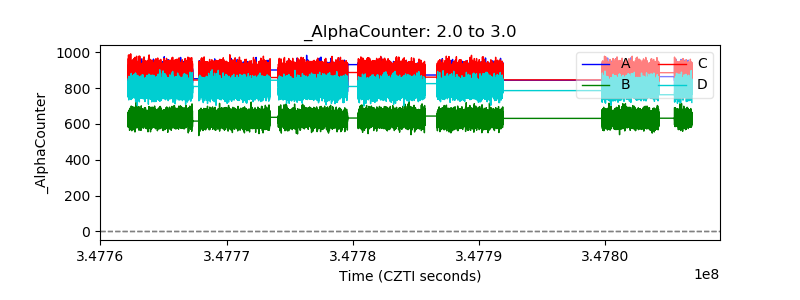 |
| _CPM_Rate | 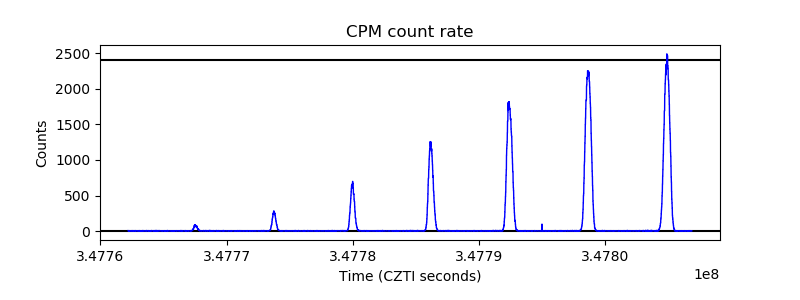 |
| CZT Counter | 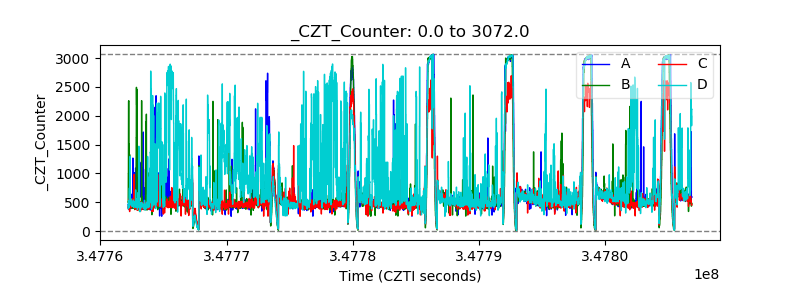 |
| +2.5 Volts monitor |  |
| +5 Volts monitor | 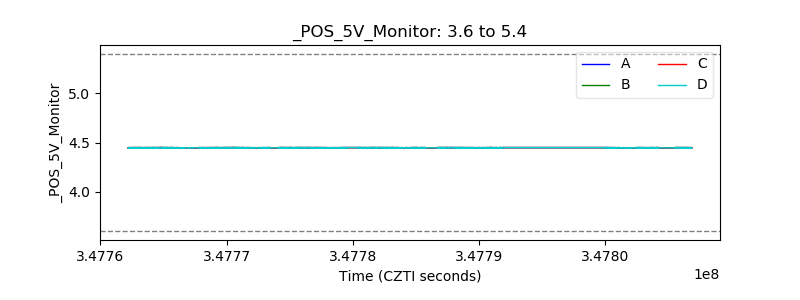 |
| _ROLL_ROT | 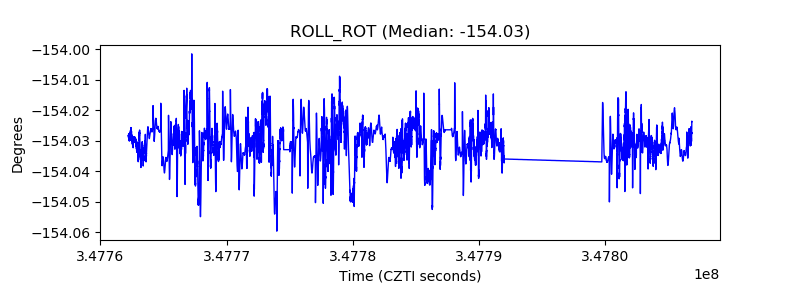 |
| _Roll_DEC | 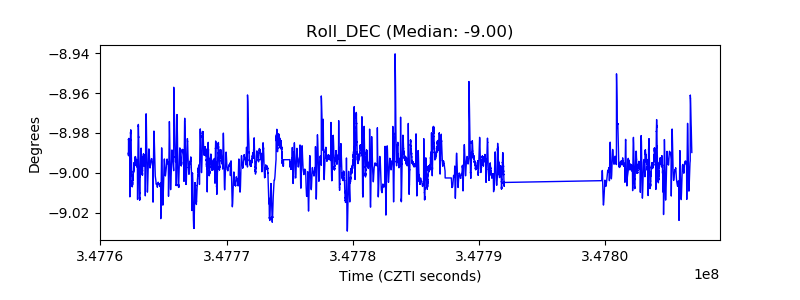 |
| _Roll_RA | 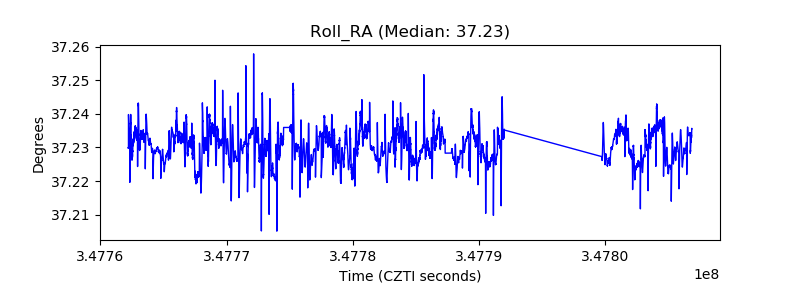 |
| Veto Counter | 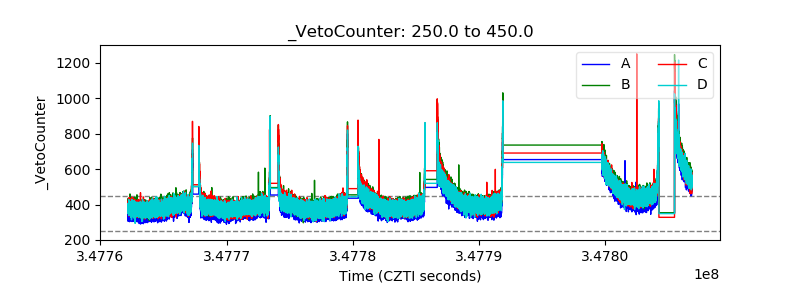 |