| Param | Original file | Final file |
|---|---|---|
| Filename | modeM0/AS1A10_102T07_9000004102_28559cztM0_level2.evt | modeM0/AS1A10_102T07_9000004102_28559cztM0_level2_quad_clean.evt |
| Size (bytes) | 516,873,600 | 111,968,640 |
| Size | 492.9 MB | 106.8 MB |
| Events in quadrant A | 3,720,230 | 771,144 |
| Events in quadrant B | 3,414,737 | 777,409 |
| Events in quadrant C | 3,215,081 | 717,634 |
| Events in quadrant D | 4,893,464 | 702,495 |
| Mode M0 | |||
|---|---|---|---|
| Quadrant | BADHDUFLAG | Total packets | Discarded packets |
| A | 0 | 15052 | 1 |
| B | 0 | 14041 | 1 |
| C | 0 | 13276 | 1 |
| D | 0 | 18632 | 1 |
| Mode SS | |||
|---|---|---|---|
| Quadrant | BADHDUFLAG | Total packets | Discarded packets |
| A | 0 | 124 | 0 |
| B | 0 | 124 | 0 |
| C | 0 | 122 | 0 |
| D | 0 | 122 | 0 |
| Mode M9 | |||
|---|---|---|---|
| Quadrant | BADHDUFLAG | Total packets | Discarded packets |
| A | 0 | 13 | 0 |
| B | 0 | 13 | 0 |
| C | 0 | 13 | 0 |
| D | 0 | 13 | 0 |
| Quadrant | Total seconds | Saturated seconds | Saturation percentage |
|---|---|---|---|
| A | 6050 | 159 | 2.628099% |
| B | 6051 | 134 | 2.214510% |
| C | 6051 | 139 | 2.297141% |
| D | 6050 | 232 | 3.834711% |
Noise dominated data is calculated using 1-second bins in cleaned event files. If a bin has >2000 counts, and if more than 50% of those come from <1% of pixels, then it is considered to be noise-dominated and hence unusable.
| Quadrant | # 1 sec bins | Bins with >0 counts | Bins with >2000 counts | High rate bins dominated by noise | Noise dominated (total time) | Noise dominated (detector-on time) | Marked lightcurve |
|---|---|---|---|---|---|---|---|
| A | 7326 | 6050 | 46 | 46 | 0.63% | 0.76% | 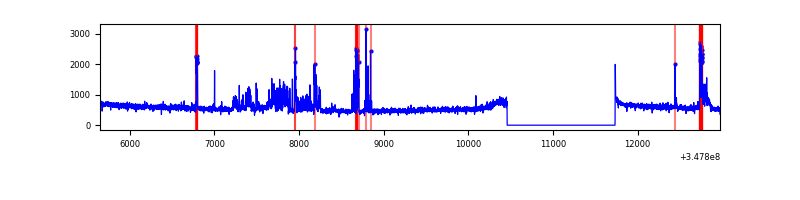 |
| B | 7327 | 6051 | 3 | 3 | 0.04% | 0.05% | 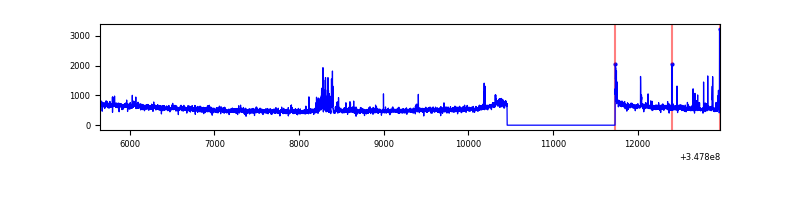 |
| C | 7327 | 6051 | 0 | 0 | 0.00% | 0.00% | 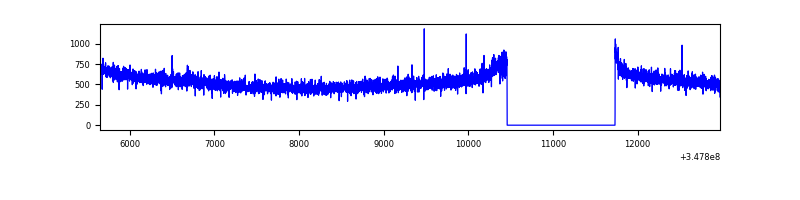 |
| D | 7326 | 6050 | 169 | 169 | 2.31% | 2.79% | 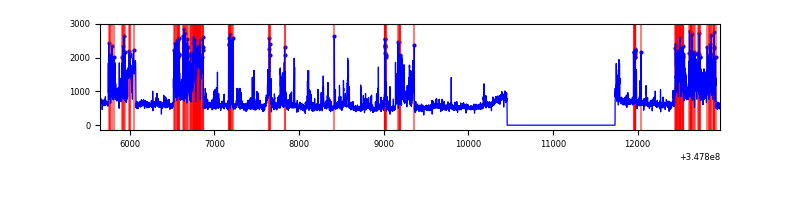 |
Top three noisy pixels from each quadrant. If the there are fewer than three noisy pixels in the level2.evt file, extra rows are filled as -1
| Pixel properties | Quadrant properties | ||||||
|---|---|---|---|---|---|---|---|
| Quadrant | DetID | PixID | Counts | Sigma | Mean | Median | Sigma |
| A | 15 | 174 | 461337 | 2750.1 | 844 | 831 | 167.5 |
| A | 13 | 254 | 10502 | 57.75 | 844 | 831 | 167.5 |
| A | 3 | 137 | 7421 | 39.35 | 844 | 831 | 167.5 |
| B | 4 | 171 | 89019 | 563.55 | 828 | 811 | 156.5 |
| B | 10 | 245 | 36736 | 229.52 | 828 | 811 | 156.5 |
| B | 15 | 33 | 18305 | 111.77 | 828 | 811 | 156.5 |
| C | 14 | 238 | 129394 | 707.89 | 782 | 787 | 181.7 |
| C | 7 | 247 | 32711 | 175.72 | 782 | 787 | 181.7 |
| C | 3 | 233 | 5450 | 25.67 | 782 | 787 | 181.7 |
| D | 8 | 195 | 1303557 | 6878.04 | 801 | 783 | 189.4 |
| D | 1 | 52 | 372036 | 1960.04 | 801 | 783 | 189.4 |
| D | 13 | 104 | 73943 | 386.25 | 801 | 783 | 189.4 |
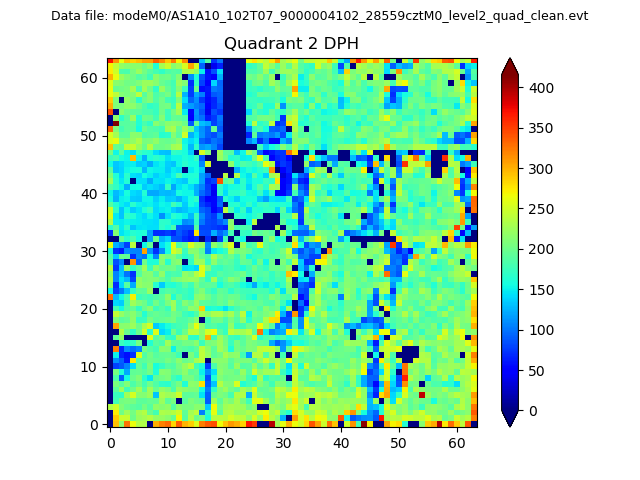
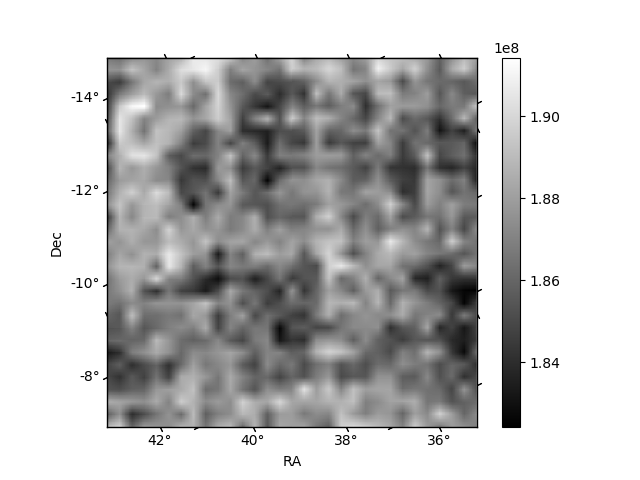
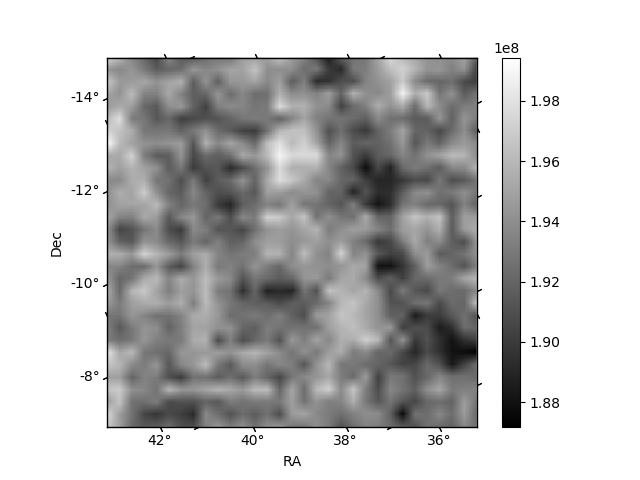
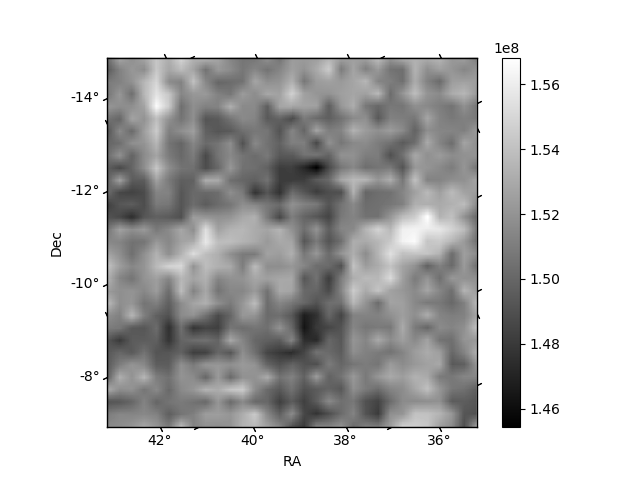
Histogram calculated using DETX and DETY for each event in the final _common_clean file
| Quadrant A |  |
 |
Quadrant B |
|---|---|---|---|
| Quadrant D | 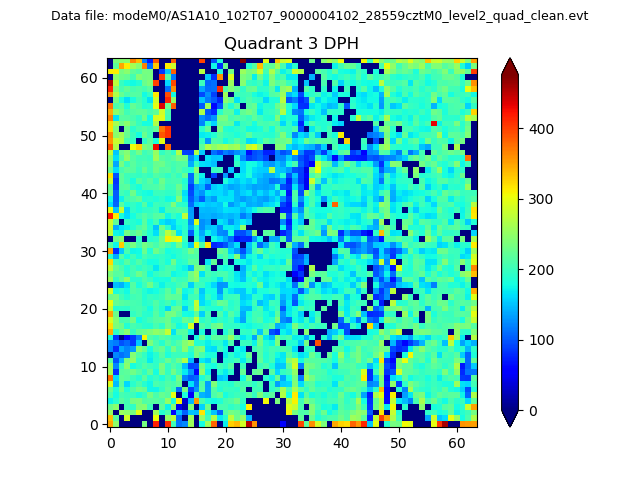 |
 |
Quadrant C |
| Plot type | Count rate plots | Images |
|---|---|---|
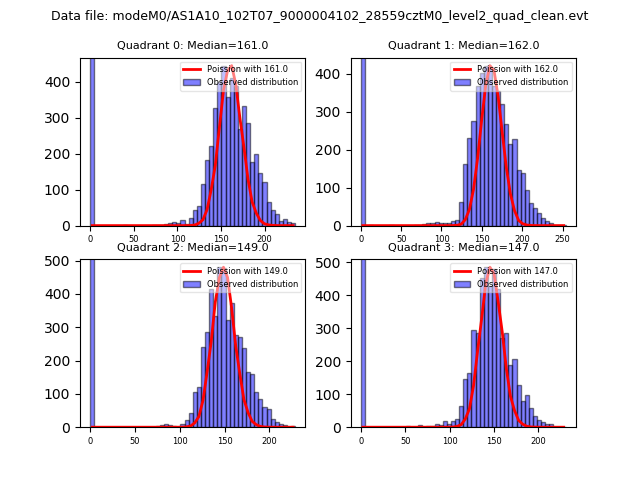
| Comparison with Poisson distribution Blue bars denote a histogram of data divided into 1 sec bins. Red curve is a Poisson curve with rate = median count rate of data. |
 |
 |
| Quadrant-wise count rates Data is divided into 100 sec bins |
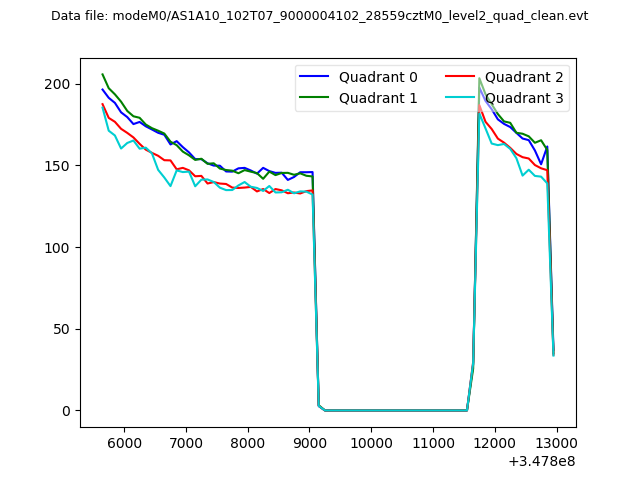 |
|
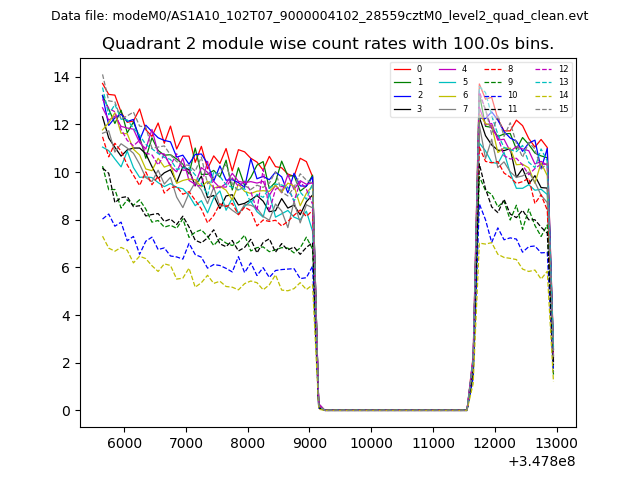
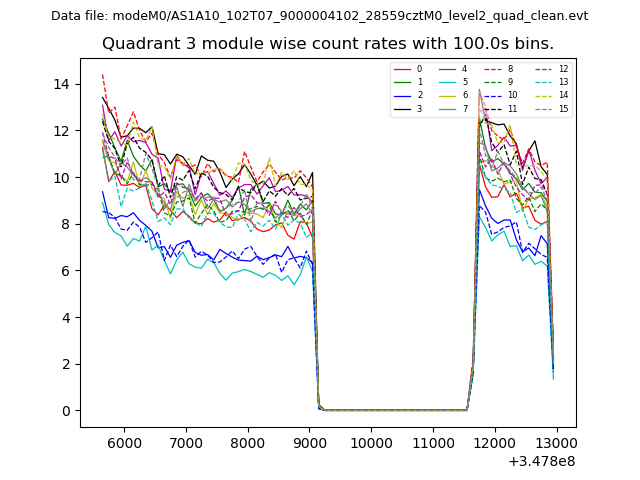
| Module-wise count rates for Quadrant A Data is divided into 100 sec bins |
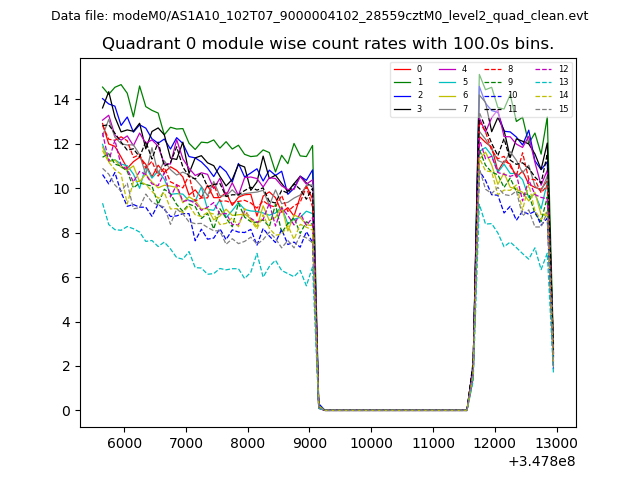 |
 |
| Module-wise count rates for Quadrant B Data is divided into 100 sec bins |
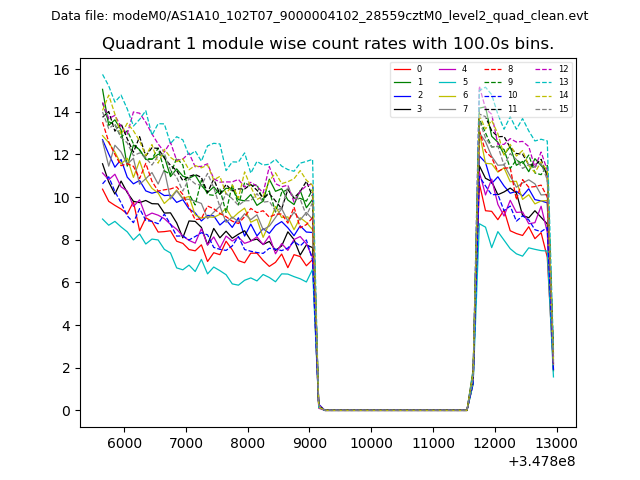 |
 |
| Module-wise count rates for Quadrant C Data is divided into 100 sec bins |
 |
 |
| Module-wise count rates for Quadrant D Data is divided into 100 sec bins |
 |
 |
| Parameter | Plot |
|---|---|
| CZT HV Monitor | 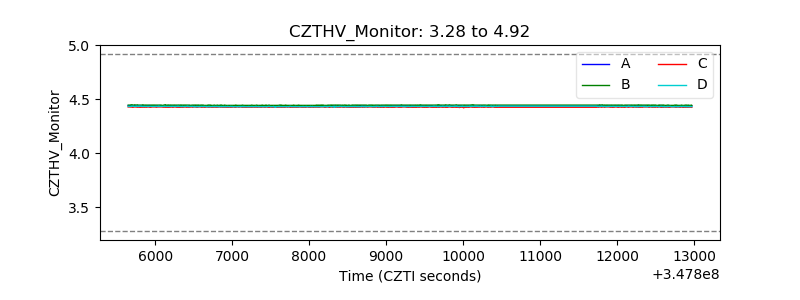 |
| D_VDD | 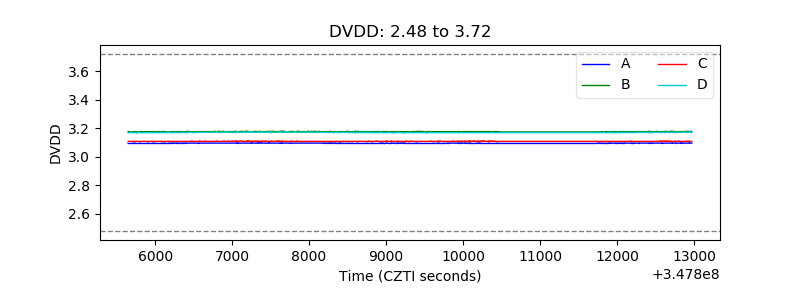 |
| Temperature 1 | 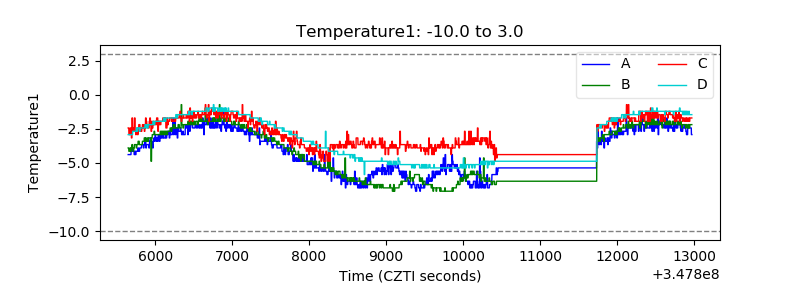 |
| Veto HV Monitor | 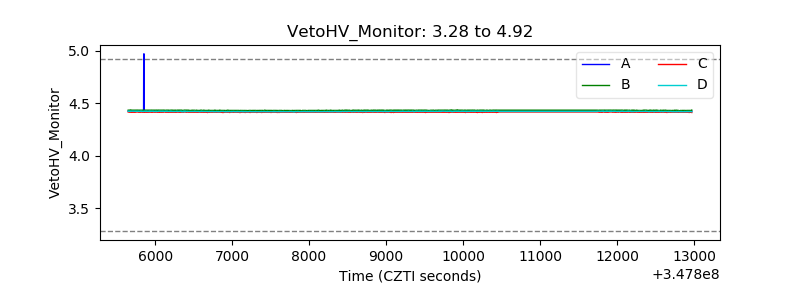 |
| Veto LLD | 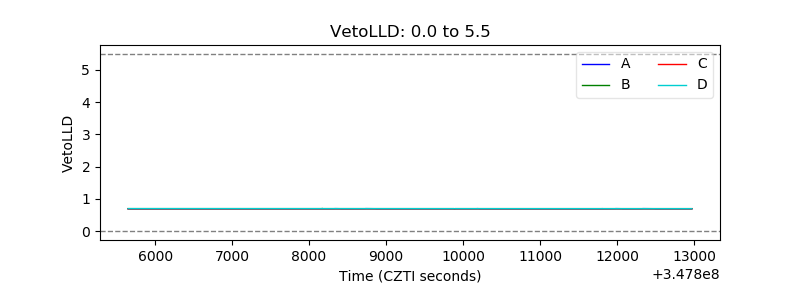 |
| Alpha Counter | 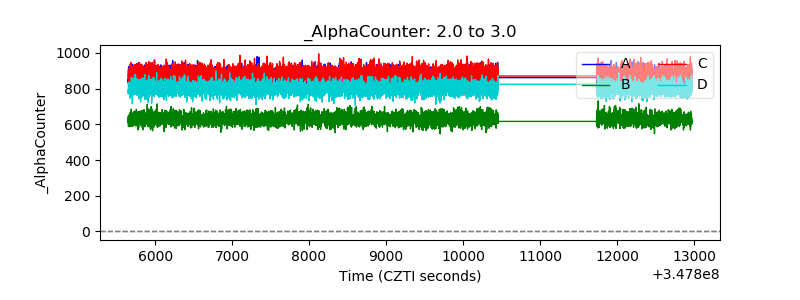 |
| _CPM_Rate | 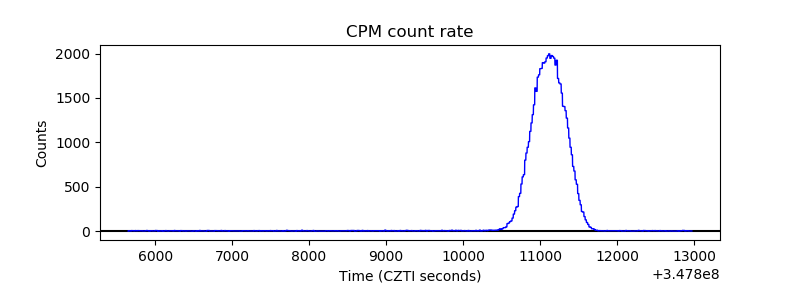 |
| CZT Counter | 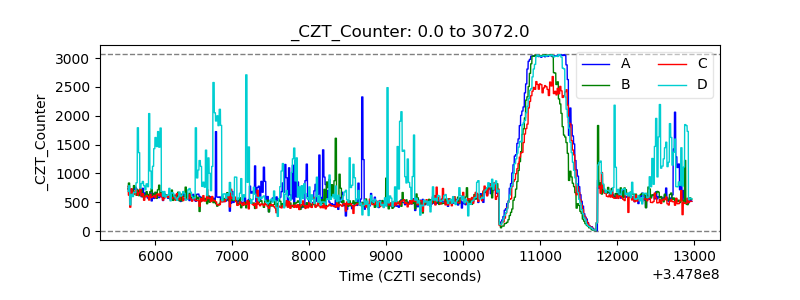 |
| +2.5 Volts monitor | 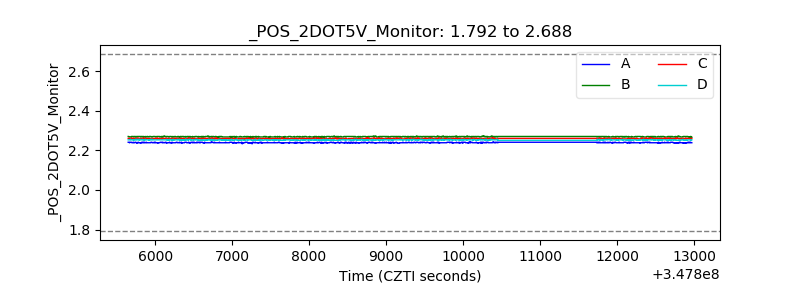 |
| +5 Volts monitor |  |
| _ROLL_ROT | 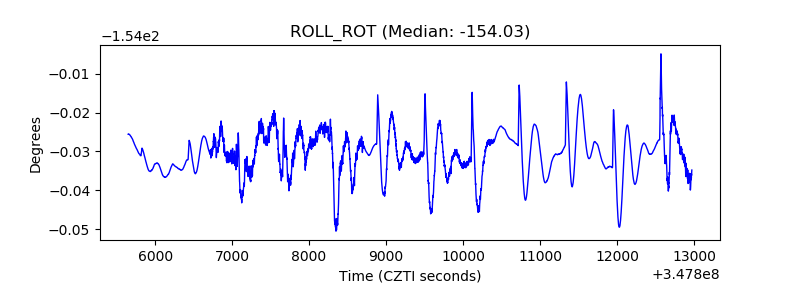 |
| _Roll_DEC | 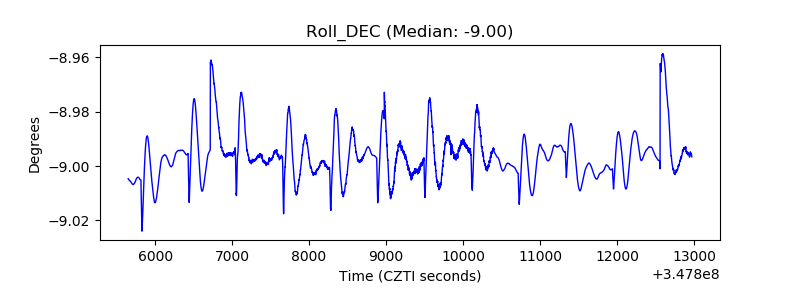 |
| _Roll_RA | 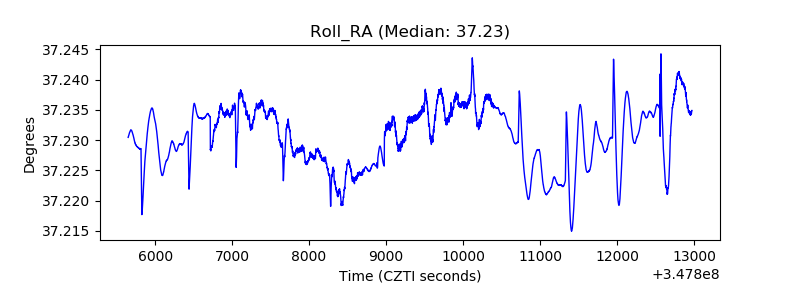 |
| Veto Counter | 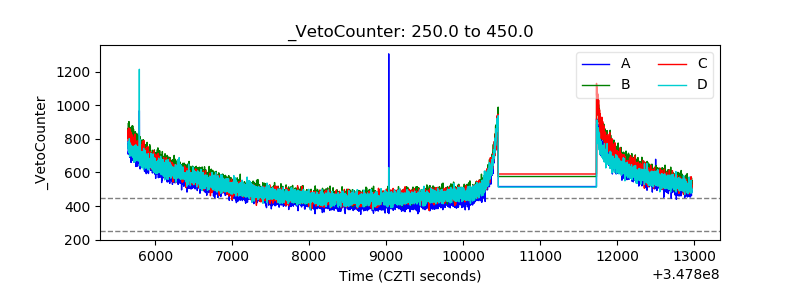 |