| Param | Original file | Final file |
|---|---|---|
| Filename | modeM0/AS1A10_102T07_9000004102_28563cztM0_level2.evt | modeM0/AS1A10_102T07_9000004102_28563cztM0_level2_quad_clean.evt |
| Size (bytes) | 530,688,960 | 90,521,280 |
| Size | 506.1 MB | 86.3 MB |
| Events in quadrant A | 3,397,358 | 592,272 |
| Events in quadrant B | 3,288,712 | 594,866 |
| Events in quadrant C | 3,309,353 | 560,378 |
| Events in quadrant D | 5,629,816 | 534,257 |
| Mode M0 | |||
|---|---|---|---|
| Quadrant | BADHDUFLAG | Total packets | Discarded packets |
| A | 0 | 14297 | 2 |
| B | 0 | 13916 | 2 |
| C | 0 | 13973 | 2 |
| D | 0 | 21099 | 2 |
| Mode SS | |||
|---|---|---|---|
| Quadrant | BADHDUFLAG | Total packets | Discarded packets |
| A | 0 | 134 | 0 |
| B | 0 | 134 | 0 |
| C | 0 | 134 | 0 |
| D | 0 | 134 | 0 |
| Mode M9 | |||
|---|---|---|---|
| Quadrant | BADHDUFLAG | Total packets | Discarded packets |
| A | 0 | 12 | 0 |
| B | 0 | 13 | 0 |
| C | 0 | 13 | 0 |
| D | 0 | 13 | 0 |
| Quadrant | Total seconds | Saturated seconds | Saturation percentage |
|---|---|---|---|
| A | 6587 | 71 | 1.077881% |
| B | 6587 | 83 | 1.260058% |
| C | 6587 | 103 | 1.563686% |
| D | 6587 | 464 | 7.044178% |
Noise dominated data is calculated using 1-second bins in cleaned event files. If a bin has >2000 counts, and if more than 50% of those come from <1% of pixels, then it is considered to be noise-dominated and hence unusable.
| Quadrant | # 1 sec bins | Bins with >0 counts | Bins with >2000 counts | High rate bins dominated by noise | Noise dominated (total time) | Noise dominated (detector-on time) | Marked lightcurve |
|---|---|---|---|---|---|---|---|
| A | 7277 | 6588 | 4 | 4 | 0.05% | 0.06% | 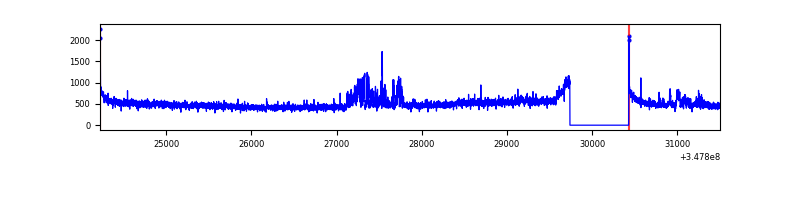 |
| B | 7277 | 6587 | 0 | 0 | 0.00% | 0.00% | 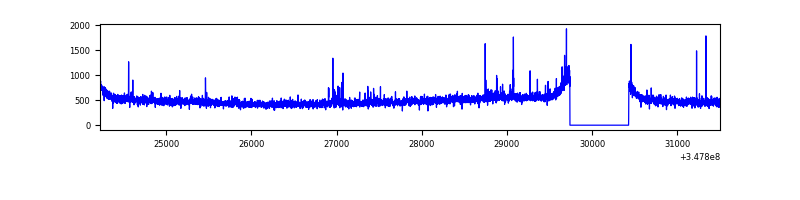 |
| C | 7277 | 6588 | 4 | 4 | 0.05% | 0.06% | 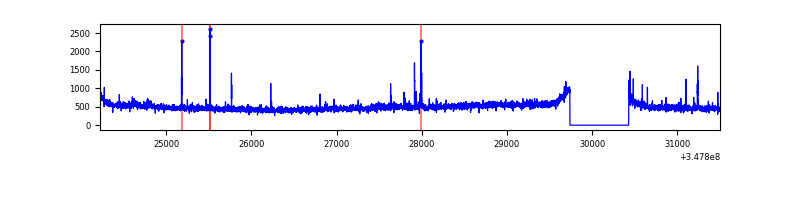 |
| D | 7277 | 6587 | 753 | 753 | 10.35% | 11.43% | 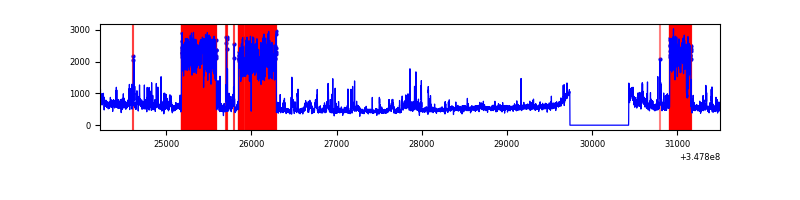 |
Top three noisy pixels from each quadrant. If the there are fewer than three noisy pixels in the level2.evt file, extra rows are filled as -1
| Pixel properties | Quadrant properties | ||||||
|---|---|---|---|---|---|---|---|
| Quadrant | DetID | PixID | Counts | Sigma | Mean | Median | Sigma |
| A | 15 | 174 | 191287 | 1142.95 | 827 | 811 | 166.7 |
| A | 8 | 192 | 13295 | 74.91 | 827 | 811 | 166.7 |
| A | 13 | 254 | 11356 | 63.28 | 827 | 811 | 166.7 |
| B | 4 | 171 | 34509 | 213.49 | 818 | 797 | 157.9 |
| B | 12 | 111 | 19816 | 120.44 | 818 | 797 | 157.9 |
| B | 0 | 230 | 18723 | 113.52 | 818 | 797 | 157.9 |
| C | 14 | 238 | 126483 | 683.26 | 782 | 787 | 184.0 |
| C | 7 | 247 | 122116 | 659.52 | 782 | 787 | 184.0 |
| C | 3 | 233 | 11471 | 58.08 | 782 | 787 | 184.0 |
| D | 8 | 195 | 2013053 | 10791.36 | 781 | 761 | 186.5 |
| D | 1 | 52 | 480333 | 2571.81 | 781 | 761 | 186.5 |
| D | 2 | 250 | 63146 | 334.55 | 781 | 761 | 186.5 |
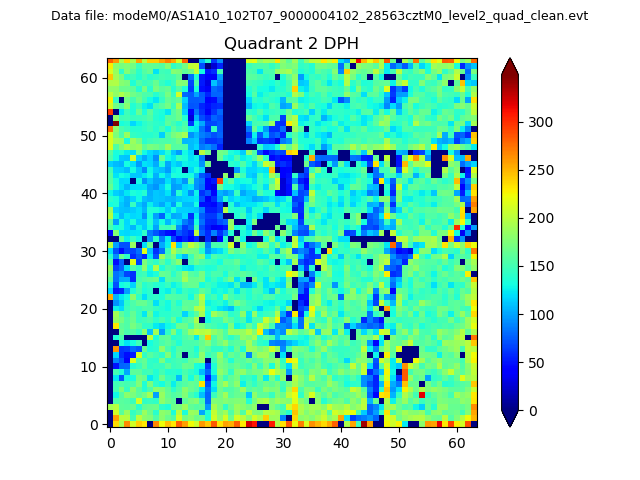
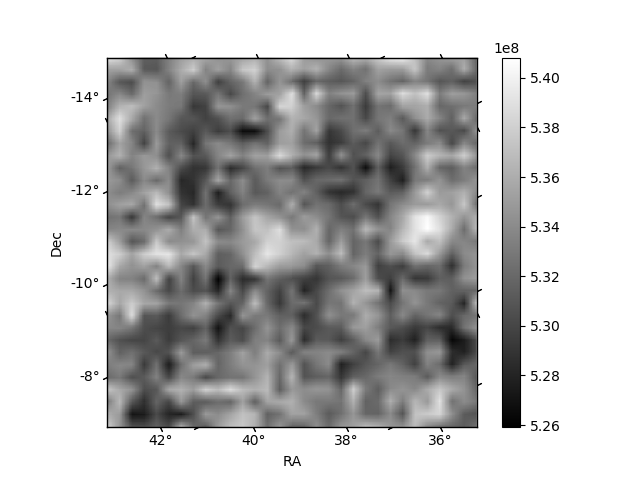
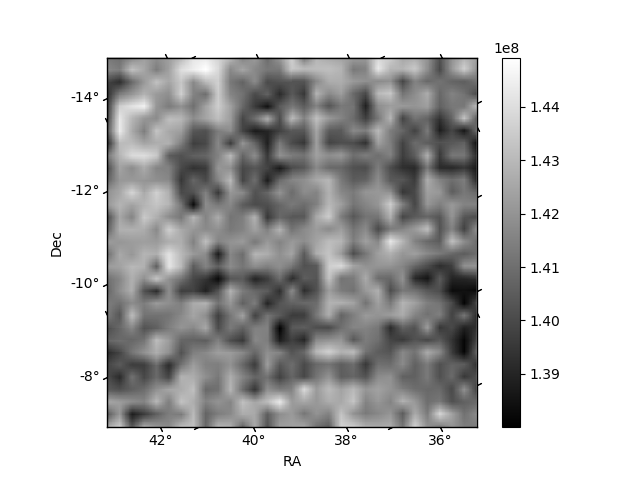
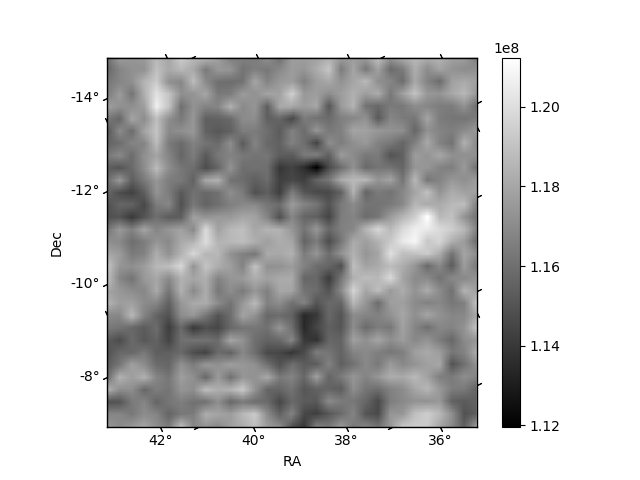
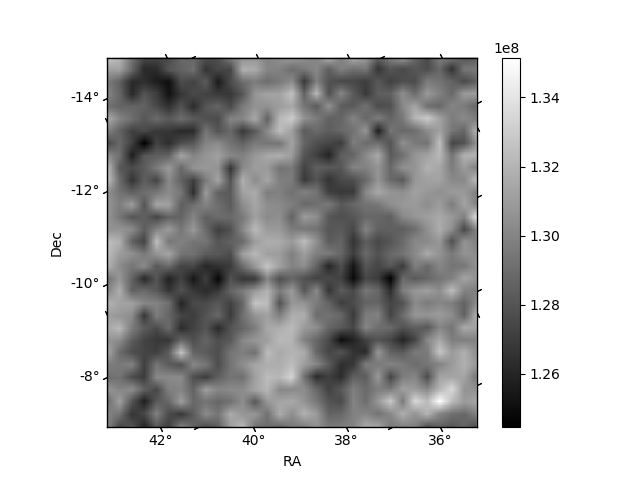
Histogram calculated using DETX and DETY for each event in the final _common_clean file
| Quadrant A | 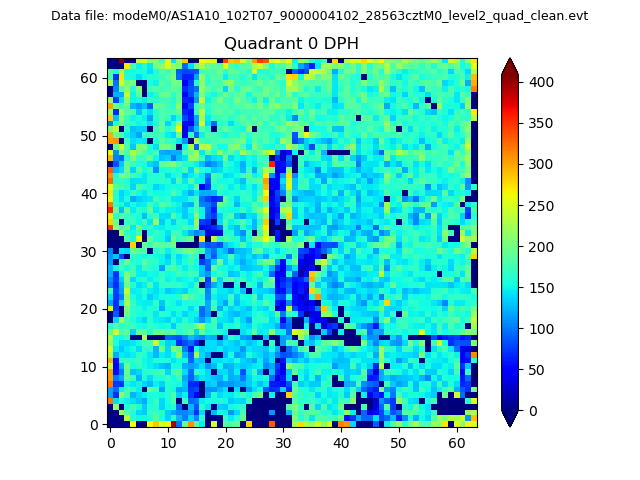 |
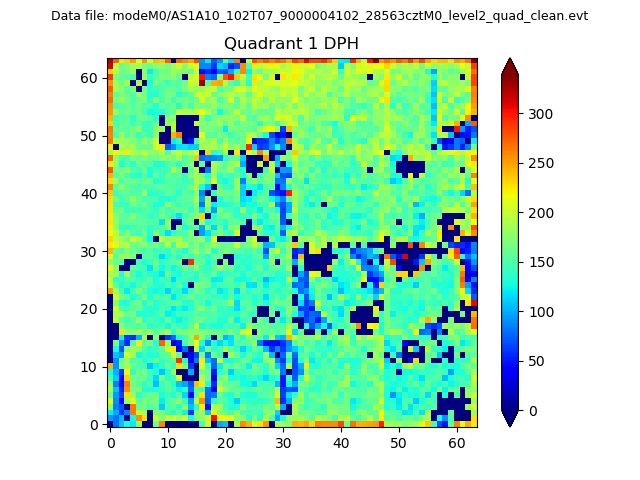 |
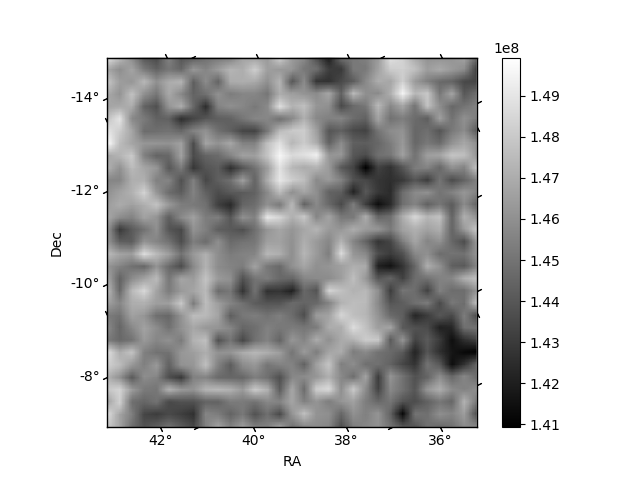
Quadrant B |
|---|---|---|---|
| Quadrant D | 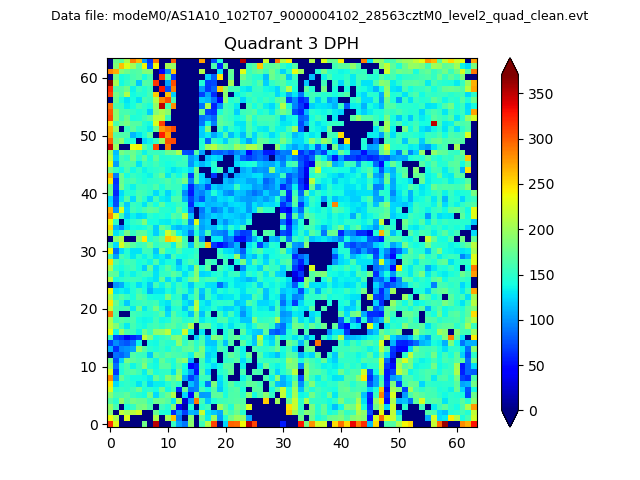 |
 |
Quadrant C |
| Plot type | Count rate plots | Images |
|---|---|---|
| Comparison with Poisson distribution Blue bars denote a histogram of data divided into 1 sec bins. Red curve is a Poisson curve with rate = median count rate of data. |
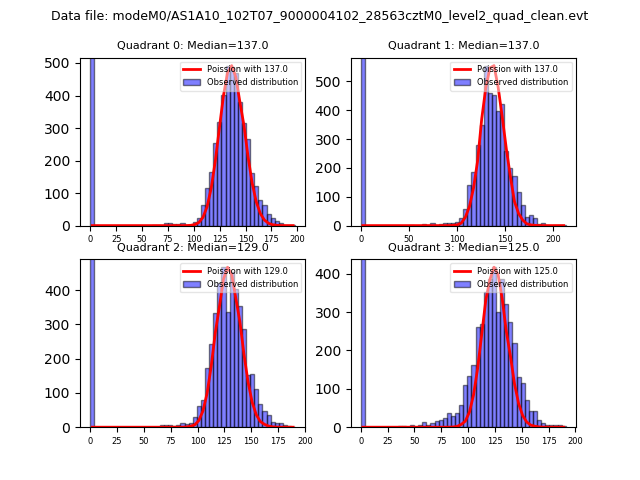 |
 |
| Quadrant-wise count rates Data is divided into 100 sec bins |
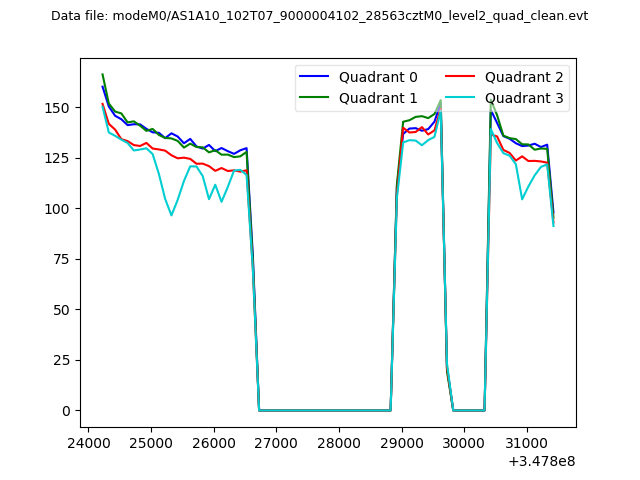 |
|
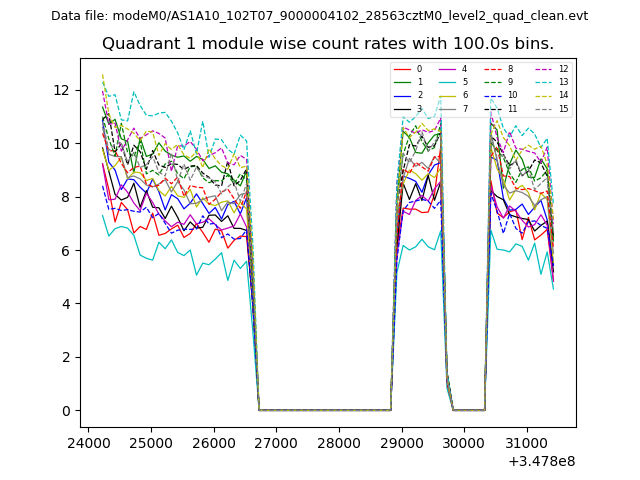
| Module-wise count rates for Quadrant A Data is divided into 100 sec bins |
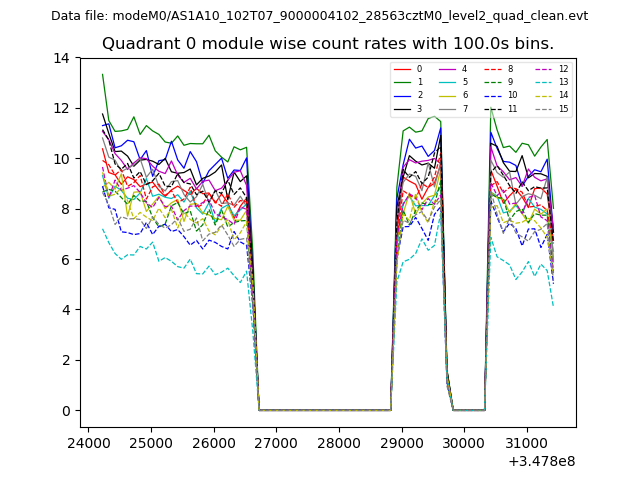 |
 |
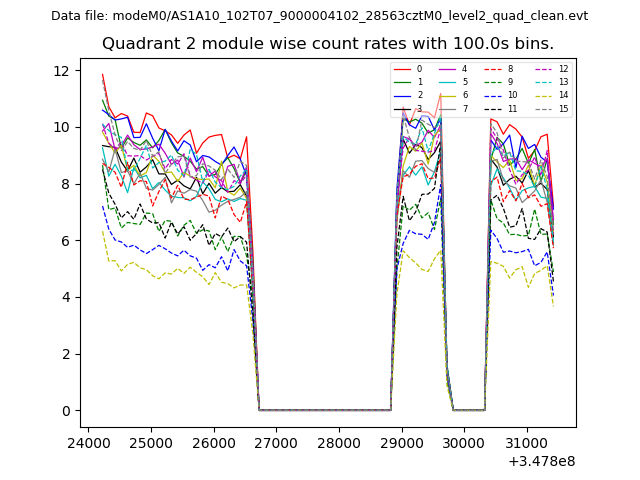
| Module-wise count rates for Quadrant B Data is divided into 100 sec bins |
 |
 |
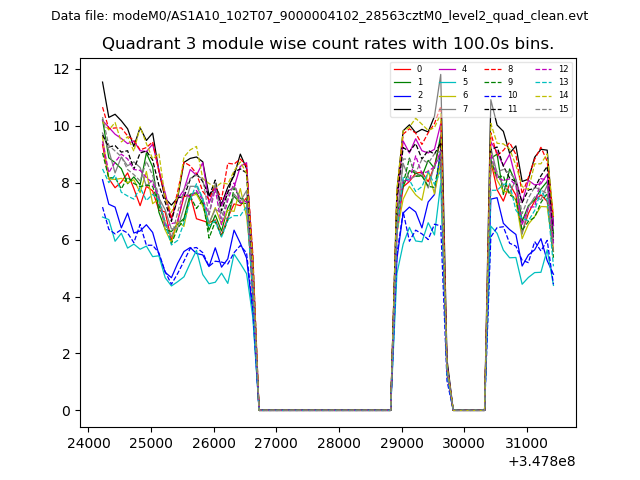
| Module-wise count rates for Quadrant C Data is divided into 100 sec bins |
 |
 |
| Module-wise count rates for Quadrant D Data is divided into 100 sec bins |
 |
 |
| Parameter | Plot |
|---|---|
| CZT HV Monitor | 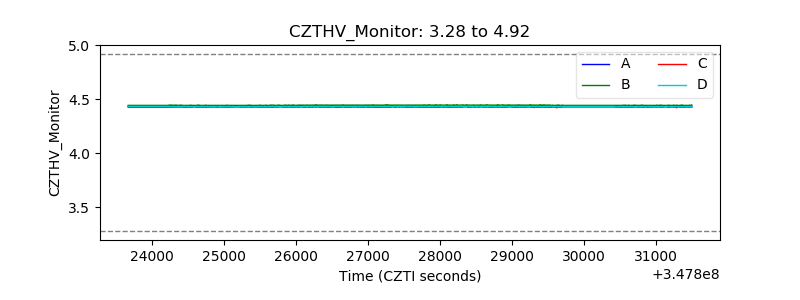 |
| D_VDD | 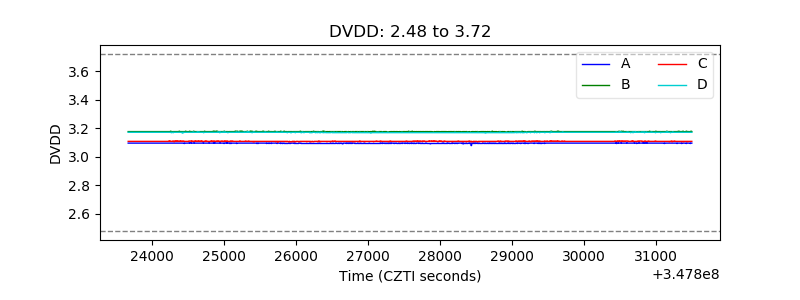 |
| Temperature 1 | 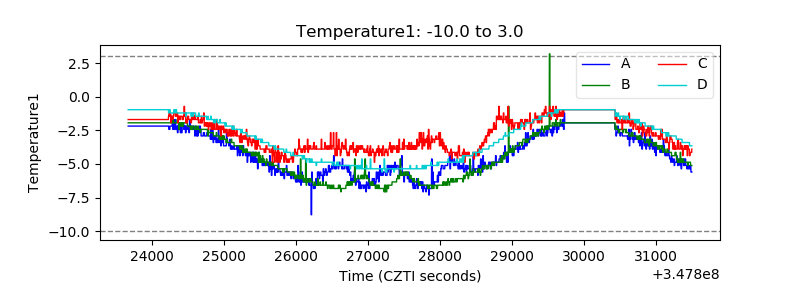 |
| Veto HV Monitor | 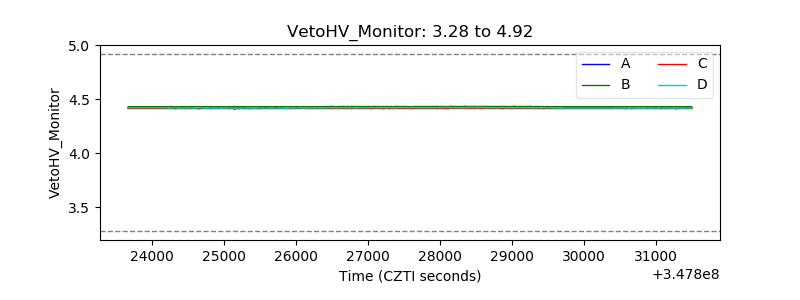 |
| Veto LLD | 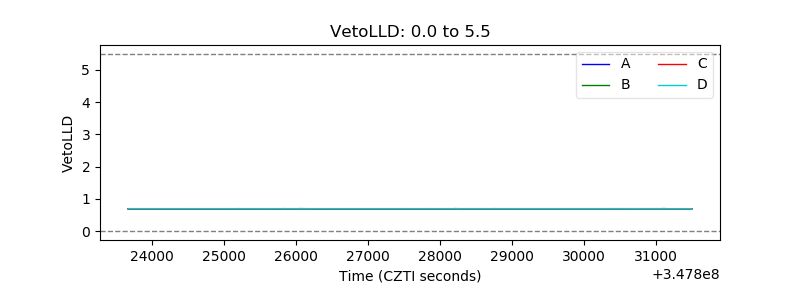 |
| Alpha Counter | 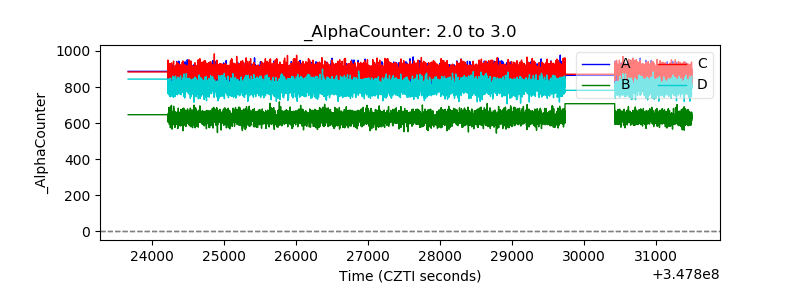 |
| _CPM_Rate | 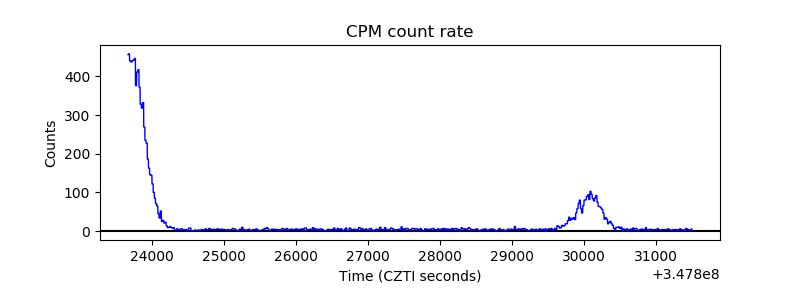 |
| CZT Counter | 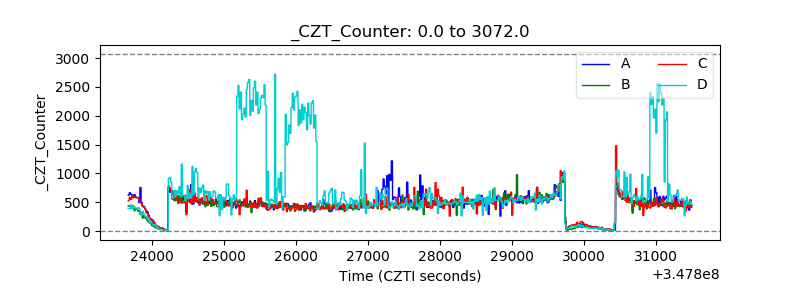 |
| +2.5 Volts monitor |  |
| +5 Volts monitor | 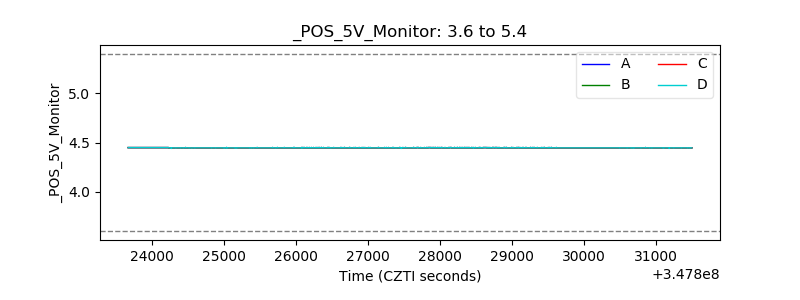 |
| _ROLL_ROT | 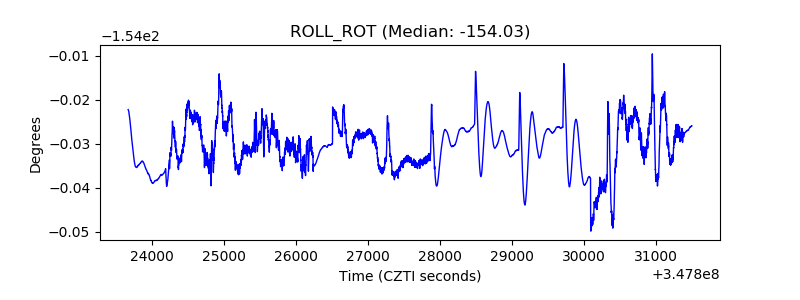 |
| _Roll_DEC | 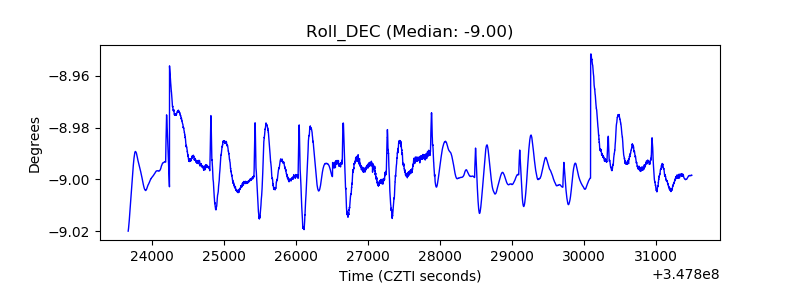 |
| _Roll_RA | 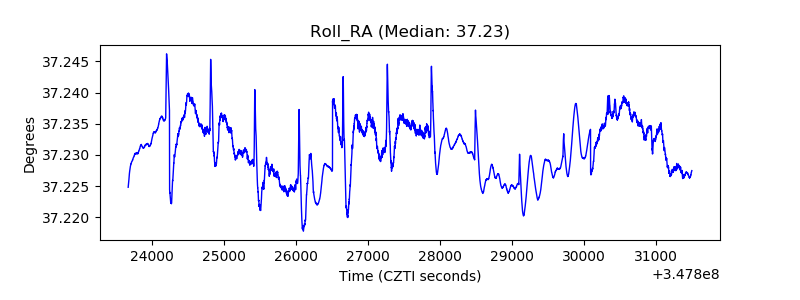 |
| Veto Counter | 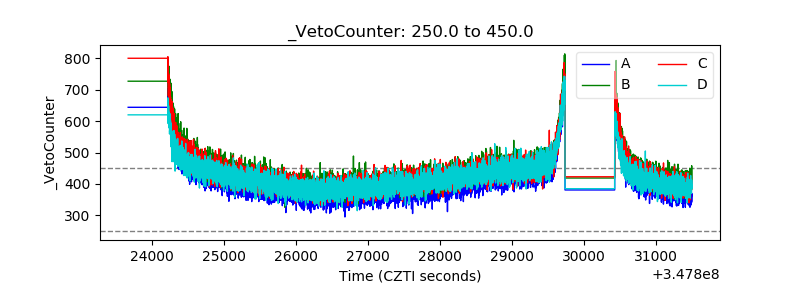 |