| Param | Original file | Final file |
|---|---|---|
| Filename | modeM0/AS1A10_110T01_9000004104cztM0_level2.fits | modeM0/AS1A10_110T01_9000004104cztM0_level2_quad_clean.evt |
| Size (bytes) | 657,944,640 | 528,333,120 |
| Size | 627.5 MB | 503.9 MB |
| Events in quadrant A | 4,129,456 | 3,040,453 |
| Events in quadrant B | 3,929,768 | 3,042,438 |
| Events in quadrant C | 4,018,774 | 2,885,780 |
| Events in quadrant D | 3,422,706 | 2,606,139 |
| Mode SS | |||
|---|---|---|---|
| Quadrant | BADHDUFLAG | Total packets | Discarded packets |
| A | 0 | 1312 | 0 |
| B | 0 | 1312 | 0 |
| C | 0 | 1312 | 0 |
| D | 0 | 1312 | 0 |
| Mode M0 | |||
|---|---|---|---|
| Quadrant | BADHDUFLAG | Total packets | Discarded packets |
| A | 0 | 139342 | 0 |
| B | 0 | 141975 | 0 |
| C | 0 | 138530 | 0 |
| D | 0 | 192708 | 0 |
| Mode M9 | |||
|---|---|---|---|
| Quadrant | BADHDUFLAG | Total packets | Discarded packets |
| A | 0 | 106 | 0 |
| B | 0 | 106 | 0 |
| C | 0 | 106 | 0 |
| D | 0 | 106 | 0 |
| Quadrant | Total seconds | Saturated seconds | Saturation percentage |
|---|---|---|---|
| A | 64509 | 904 | 1.401355% |
| B | 64509 | 1147 | 1.778046% |
| C | 64509 | 1143 | 1.771846% |
| D | 64509 | 4951 | 7.674898% |
Noise dominated data is calculated using 1-second bins in cleaned event files. If a bin has >2000 counts, and if more than 50% of those come from <1% of pixels, then it is considered to be noise-dominated and hence unusable.
| Quadrant | # 1 sec bins | Bins with >0 counts | Bins with >2000 counts | High rate bins dominated by noise | Noise dominated (total time) | Noise dominated (detector-on time) | Marked lightcurve |
|---|---|---|---|---|---|---|---|
| A | 74949 | 64497 | 0 | 0 | 0.00% | 0.00% | 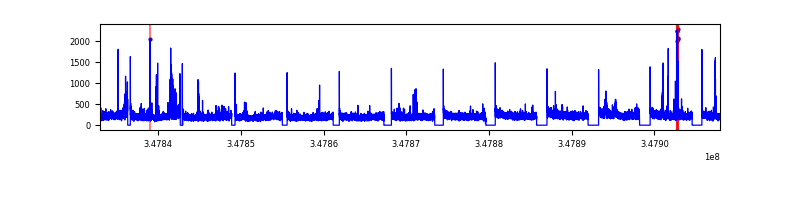 |
| B | 74949 | 64495 | 0 | 0 | 0.00% | 0.00% |  |
| C | 74949 | 64497 | 0 | 0 | 0.00% | 0.00% | 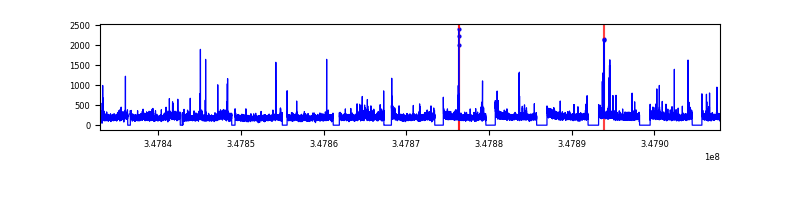 |
| D | 74948 | 64448 | 0 | 0 | 0.00% | 0.00% |  |
Top three noisy pixels from each quadrant. If the there are fewer than three noisy pixels in the level2.evt file, extra rows are filled as -1
| Pixel properties | Quadrant properties | ||||||
|---|---|---|---|---|---|---|---|
| Quadrant | DetID | PixID | Counts | Sigma | Mean | Median | Sigma |
| A | 0 | 29 | 3906 | 10.94 | 1076 | 1012 | 264.4 |
| A | 7 | 110 | 3316 | 8.71 | 1076 | 1012 | 264.4 |
| A | 9 | 19 | 3074 | 7.8 | 1076 | 1012 | 264.4 |
| B | 2 | 9 | 3163 | 10.67 | 1039 | 991 | 203.6 |
| B | 5 | 128 | 2747 | 8.62 | 1039 | 991 | 203.6 |
| B | 2 | 8 | 2609 | 7.95 | 1039 | 991 | 203.6 |
| C | 2 | 191 | 2720 | 6.39 | 1064 | 998 | 269.6 |
| C | 9 | 209 | 2713 | 6.36 | 1064 | 998 | 269.6 |
| C | 3 | 126 | 2699 | 6.31 | 1064 | 998 | 269.6 |
| D | 15 | 46 | 2415 | 5.88 | 978 | 894 | 258.5 |
| D | 6 | 231 | 2391 | 5.79 | 978 | 894 | 258.5 |
| D | 6 | 67 | 2344 | 5.61 | 978 | 894 | 258.5 |
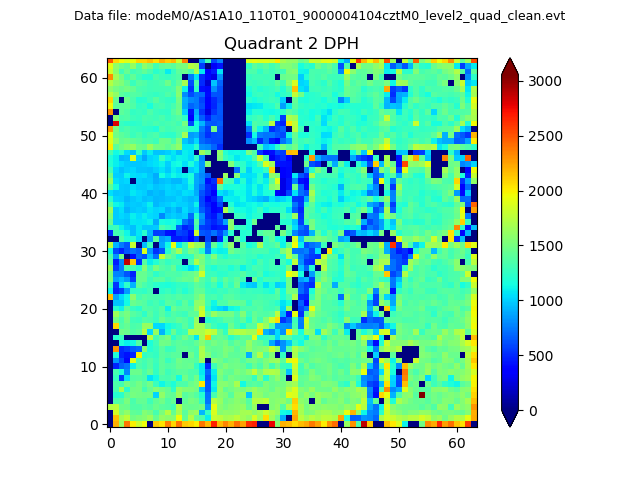
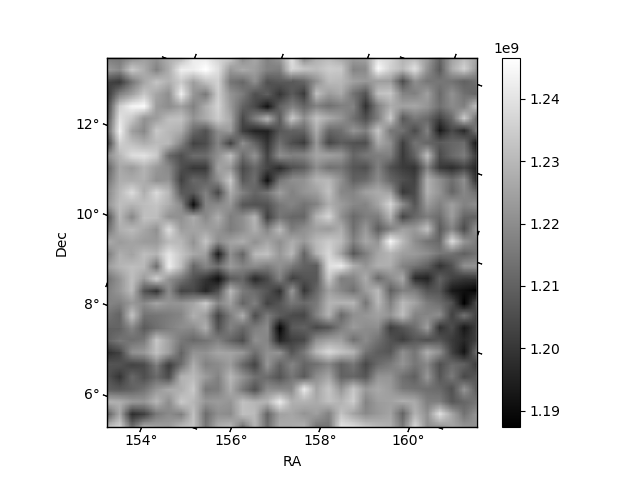
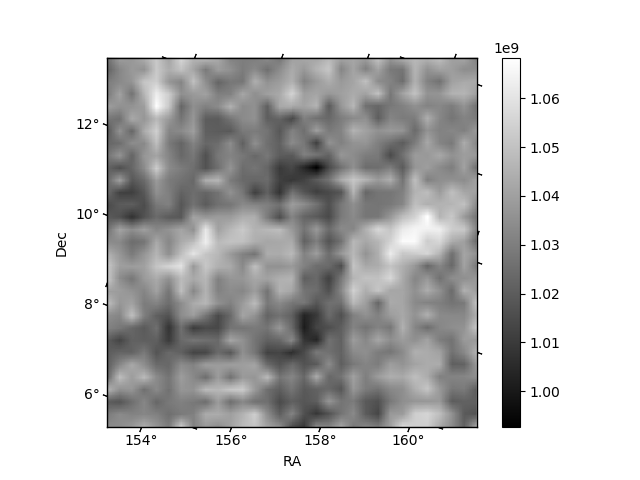
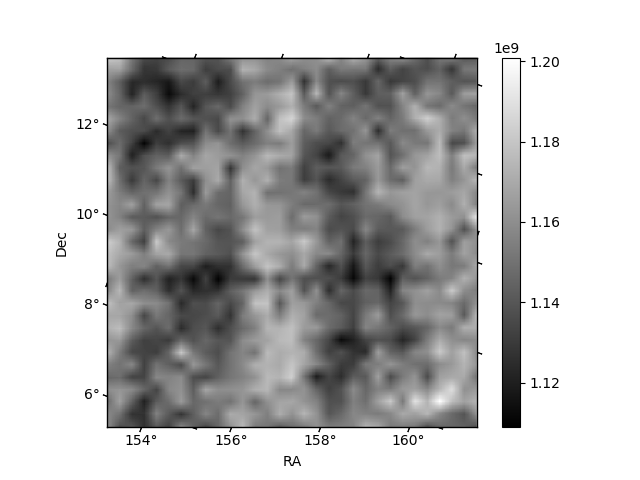
Histogram calculated using DETX and DETY for each event in the final _common_clean file
| Quadrant A | 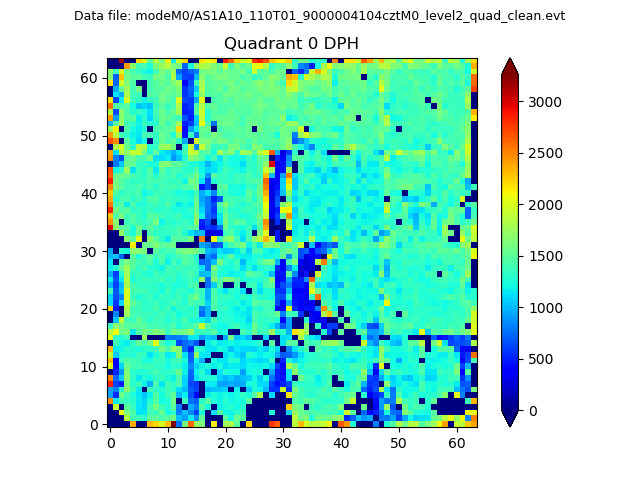 |
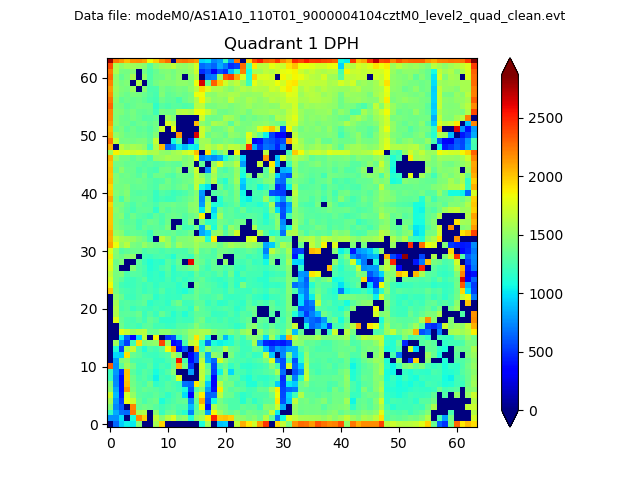 |
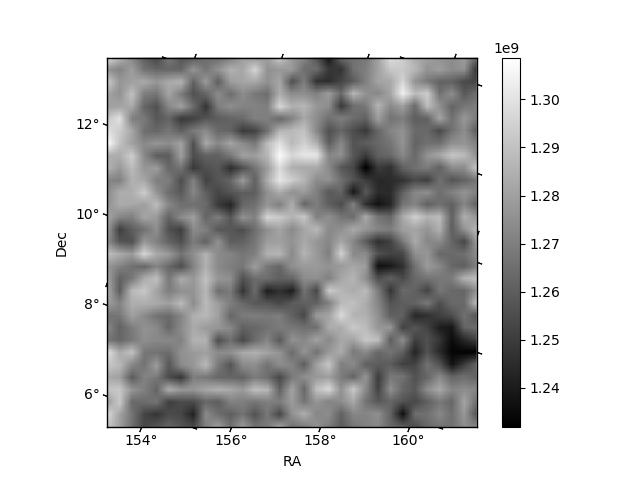
Quadrant B |
|---|---|---|---|
| Quadrant D | 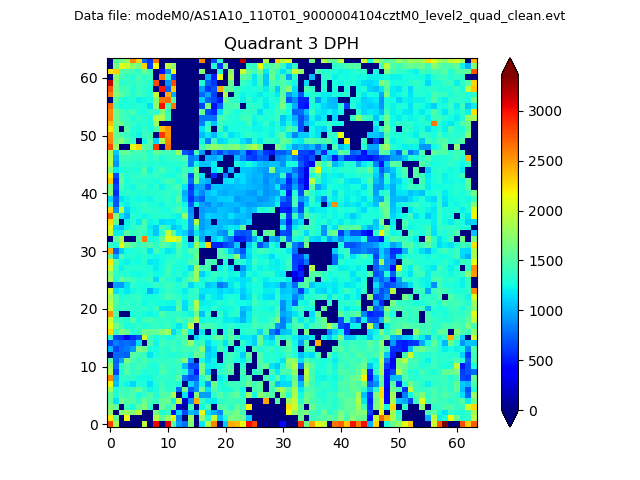 |
 |
Quadrant C |
| Plot type | Count rate plots | Images |
|---|---|---|
| Comparison with Poisson distribution Blue bars denote a histogram of data divided into 1 sec bins. Red curve is a Poisson curve with rate = median count rate of data. |
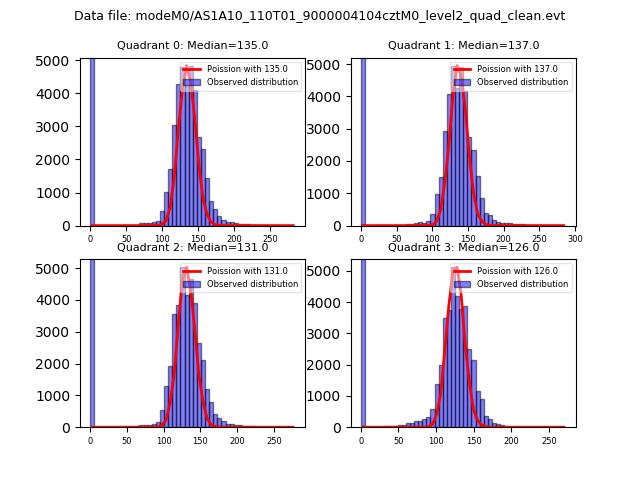 |
 |
| Quadrant-wise count rates Data is divided into 100 sec bins |
 |
|
| Module-wise count rates for Quadrant A Data is divided into 100 sec bins |
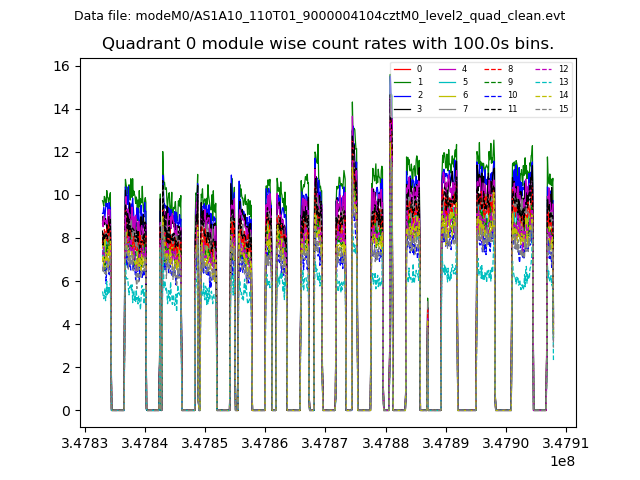 |
 |
| Module-wise count rates for Quadrant B Data is divided into 100 sec bins |
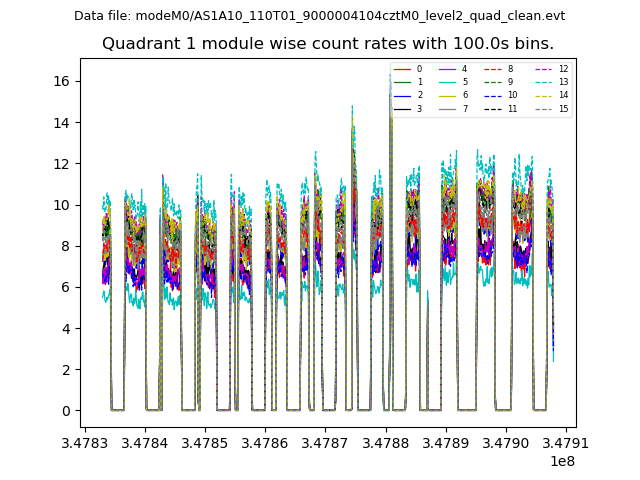 |
 |
| Module-wise count rates for Quadrant C Data is divided into 100 sec bins |
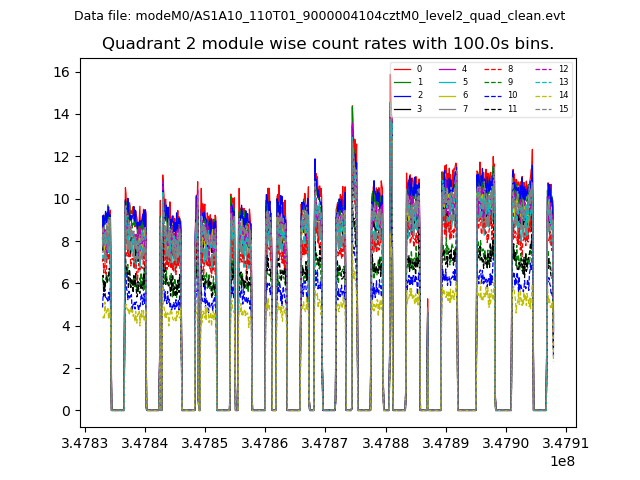 |
 |
| Module-wise count rates for Quadrant D Data is divided into 100 sec bins |
 |
 |
| Parameter | Plot |
|---|---|
| CZT HV Monitor | 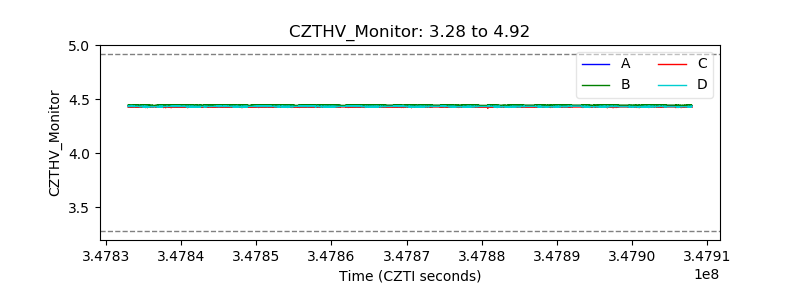 |
| D_VDD | 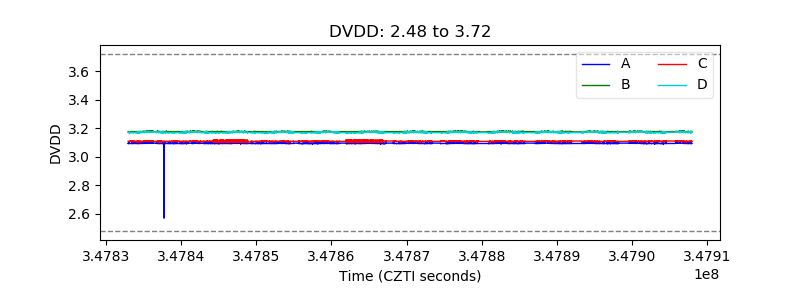 |
| Temperature 1 | 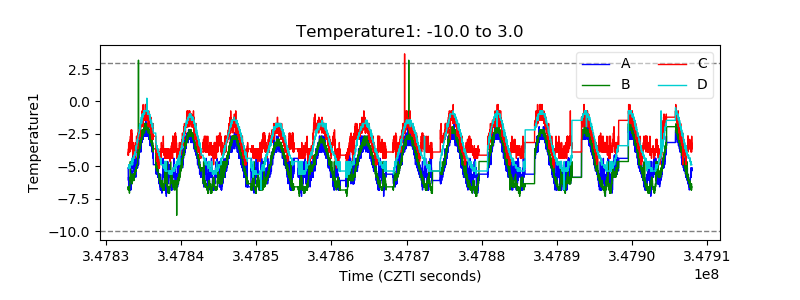 |
| Veto HV Monitor |  |
| Veto LLD | 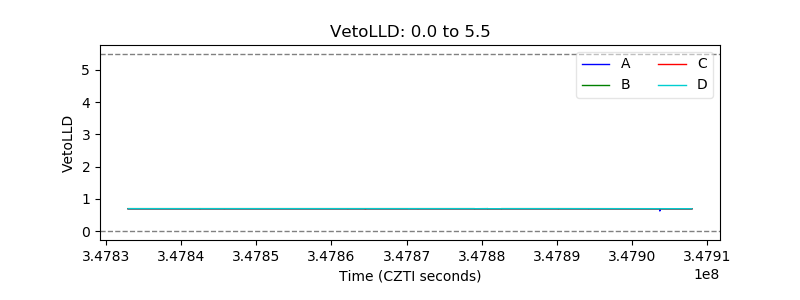 |
| Alpha Counter | 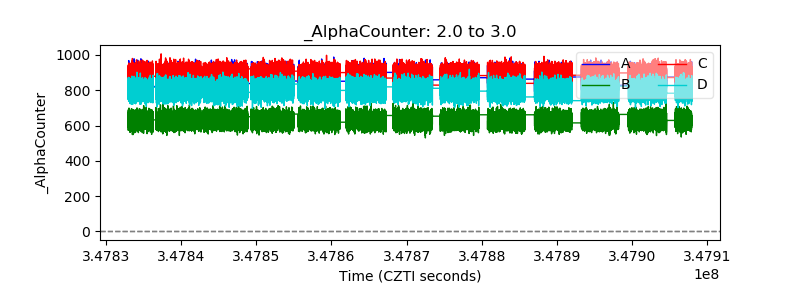 |
| _CPM_Rate | 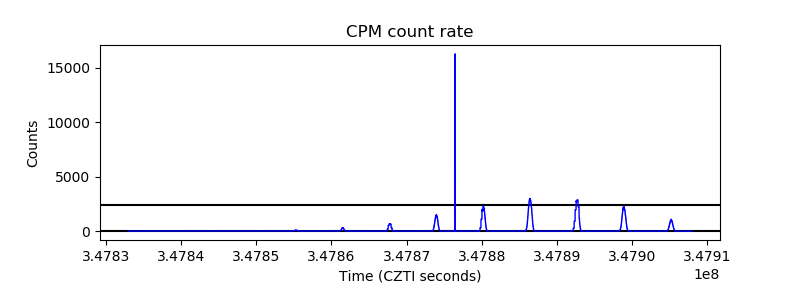 |
| CZT Counter | 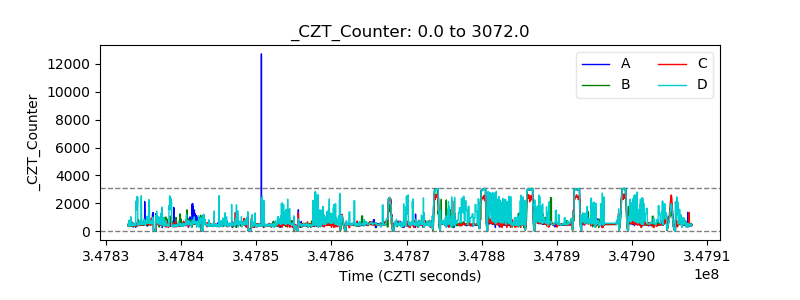 |
| +2.5 Volts monitor |  |
| +5 Volts monitor | 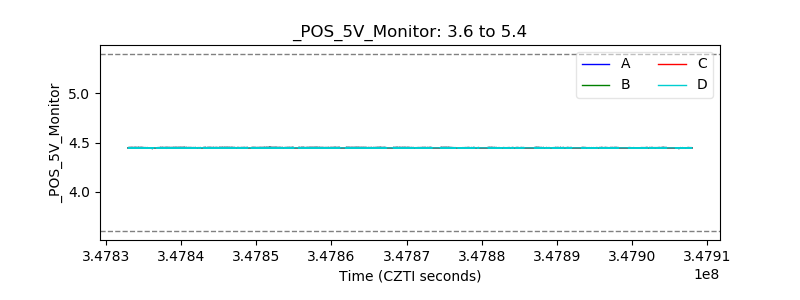 |
| _ROLL_ROT | 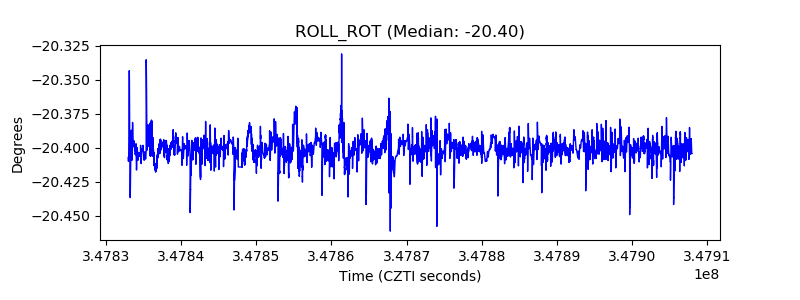 |
| _Roll_DEC | 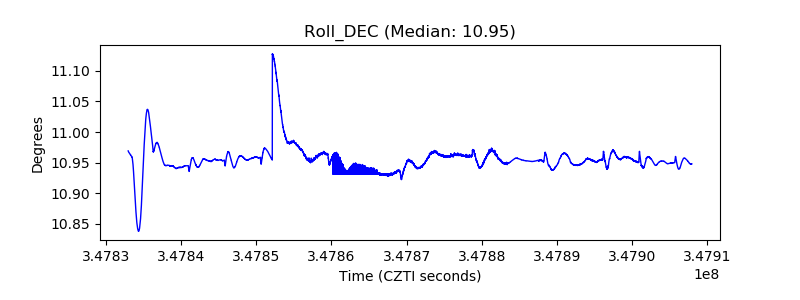 |
| _Roll_RA | 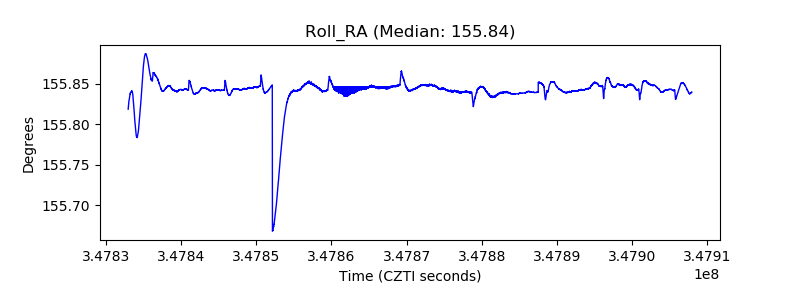 |
| Veto Counter | 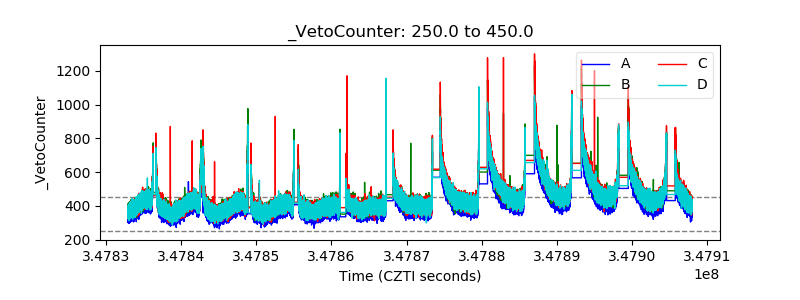 |