| Param | Original file | Final file |
|---|---|---|
| Filename | modeM0/AS1A10_110T01_9000004104_28563cztM0_level2.evt | modeM0/AS1A10_110T01_9000004104_28563cztM0_level2_quad_clean.evt |
| Size (bytes) | 372,216,960 | 58,066,560 |
| Size | 355.0 MB | 55.4 MB |
| Events in quadrant A | 2,576,573 | 362,991 |
| Events in quadrant B | 2,481,614 | 369,529 |
| Events in quadrant C | 2,438,081 | 350,602 |
| Events in quadrant D | 3,451,593 | 339,857 |
| Mode SS | |||
|---|---|---|---|
| Quadrant | BADHDUFLAG | Total packets | Discarded packets |
| A | 0 | 98 | 0 |
| B | 0 | 98 | 0 |
| C | 0 | 98 | 0 |
| D | 0 | 98 | 0 |
| Mode M0 | |||
|---|---|---|---|
| Quadrant | BADHDUFLAG | Total packets | Discarded packets |
| A | 0 | 10641 | 1 |
| B | 0 | 10336 | 1 |
| C | 0 | 10183 | 2 |
| D | 0 | 13450 | 1 |
| Mode M9 | |||
|---|---|---|---|
| Quadrant | BADHDUFLAG | Total packets | Discarded packets |
| A | 0 | 3 | 0 |
| B | 0 | 3 | 0 |
| C | 0 | 3 | 0 |
| D | 0 | 3 | 0 |
| Quadrant | Total seconds | Saturated seconds | Saturation percentage |
|---|---|---|---|
| A | 4769 | 122 | 2.558188% |
| B | 4769 | 99 | 2.075907% |
| C | 4768 | 106 | 2.223154% |
| D | 4768 | 228 | 4.781879% |
Noise dominated data is calculated using 1-second bins in cleaned event files. If a bin has >2000 counts, and if more than 50% of those come from <1% of pixels, then it is considered to be noise-dominated and hence unusable.
| Quadrant | # 1 sec bins | Bins with >0 counts | Bins with >2000 counts | High rate bins dominated by noise | Noise dominated (total time) | Noise dominated (detector-on time) | Marked lightcurve |
|---|---|---|---|---|---|---|---|
| A | 5094 | 4769 | 11 | 11 | 0.22% | 0.23% | 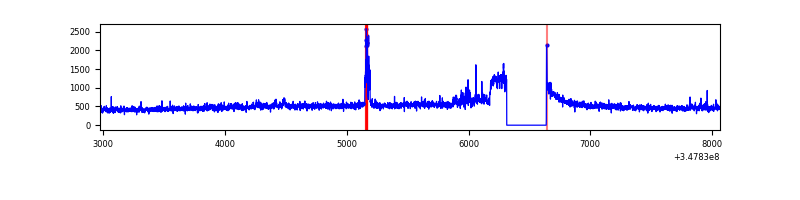 |
| B | 5094 | 4769 | 1 | 1 | 0.02% | 0.02% | 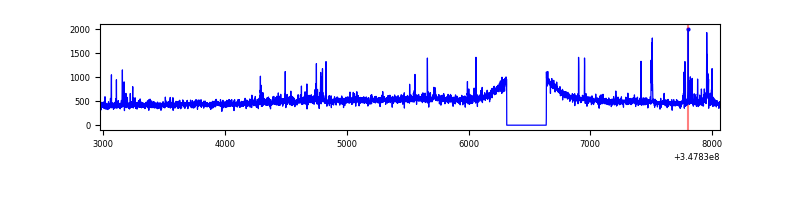 |
| C | 5093 | 4769 | 0 | 0 | 0.00% | 0.00% | 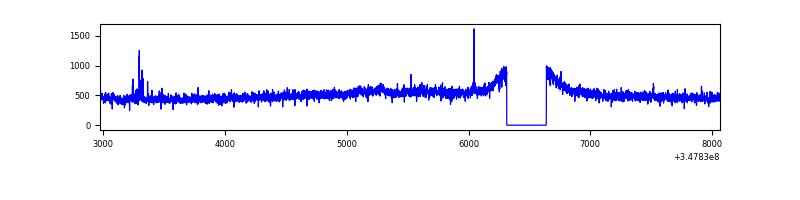 |
| D | 5093 | 4769 | 230 | 230 | 4.52% | 4.82% | 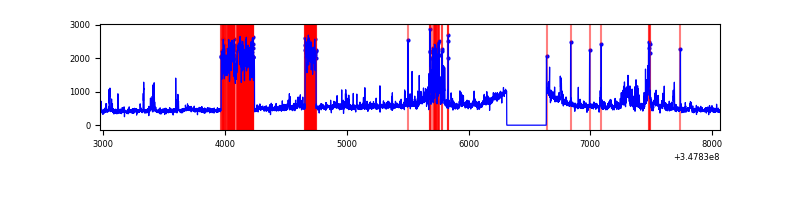 |
Top three noisy pixels from each quadrant. If the there are fewer than three noisy pixels in the level2.evt file, extra rows are filled as -1
| Pixel properties | Quadrant properties | ||||||
|---|---|---|---|---|---|---|---|
| Quadrant | DetID | PixID | Counts | Sigma | Mean | Median | Sigma |
| A | 15 | 174 | 181298 | 1453.52 | 610 | 597 | 124.3 |
| A | 14 | 238 | 36828 | 291.43 | 610 | 597 | 124.3 |
| A | 13 | 254 | 7901 | 58.75 | 610 | 597 | 124.3 |
| B | 4 | 171 | 49117 | 404.49 | 606 | 590 | 120.0 |
| B | 5 | 255 | 27247 | 222.2 | 606 | 590 | 120.0 |
| B | 12 | 111 | 14936 | 119.58 | 606 | 590 | 120.0 |
| C | 14 | 238 | 93663 | 668.03 | 584 | 586 | 139.3 |
| C | 7 | 247 | 60623 | 430.89 | 584 | 586 | 139.3 |
| C | 3 | 233 | 6611 | 43.24 | 584 | 586 | 139.3 |
| D | 8 | 195 | 796181 | 5673.19 | 584 | 567 | 140.2 |
| D | 2 | 250 | 212563 | 1511.65 | 584 | 567 | 140.2 |
| D | 1 | 52 | 171206 | 1216.75 | 584 | 567 | 140.2 |
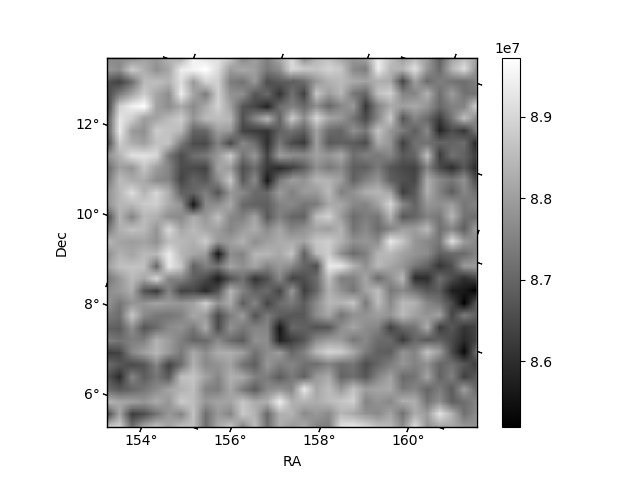
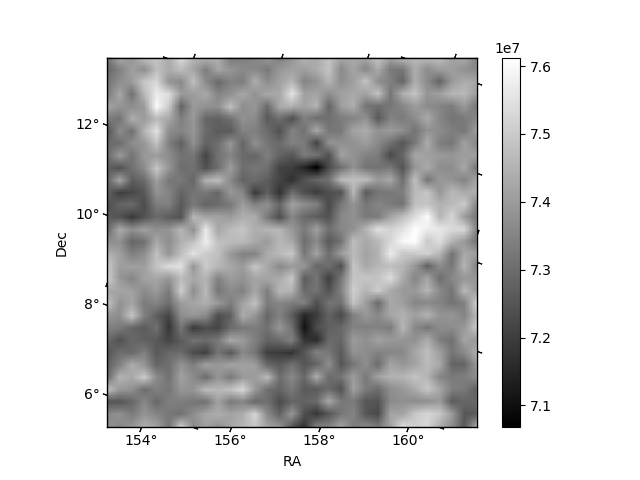
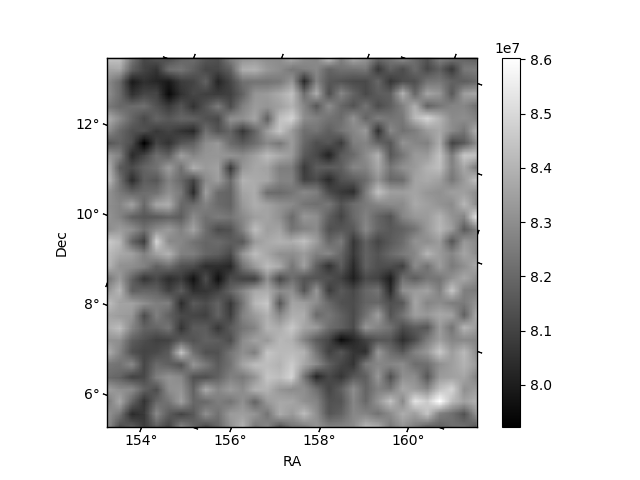
Histogram calculated using DETX and DETY for each event in the final _common_clean file
| Quadrant A | 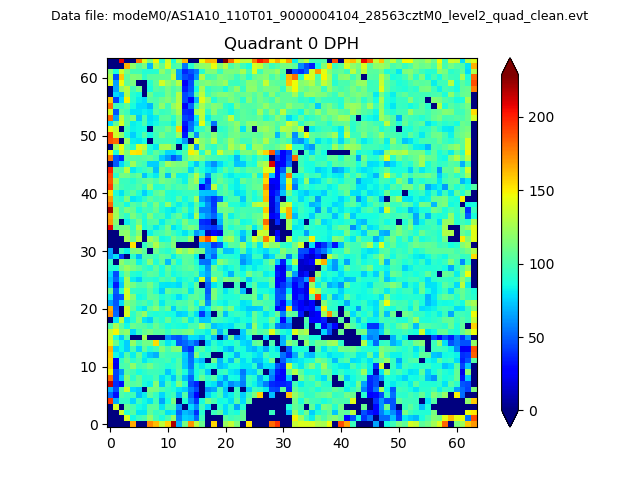 |
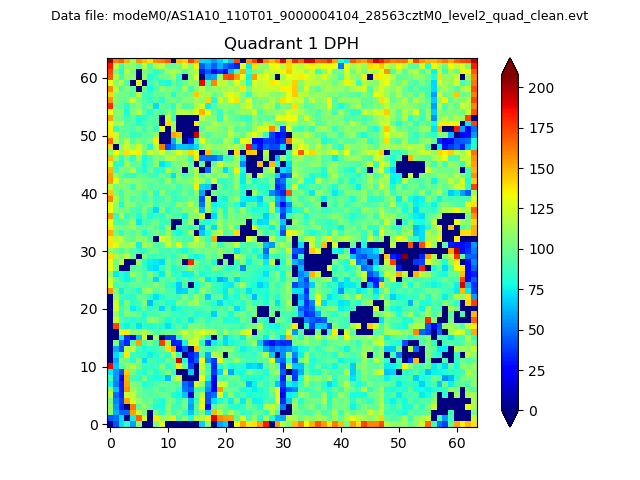 |
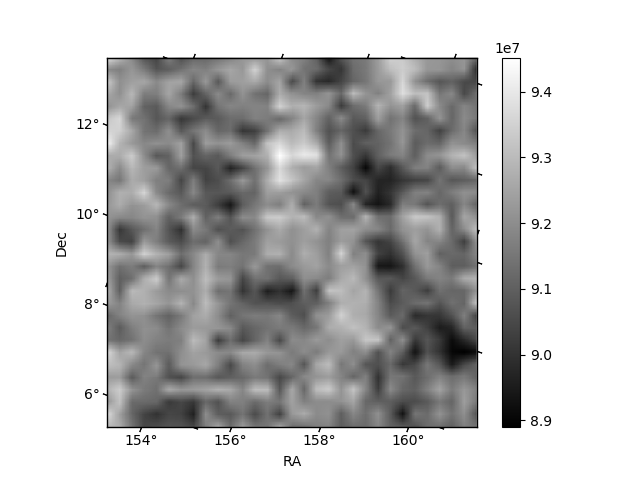
Quadrant B |
|---|---|---|---|
| Quadrant D | 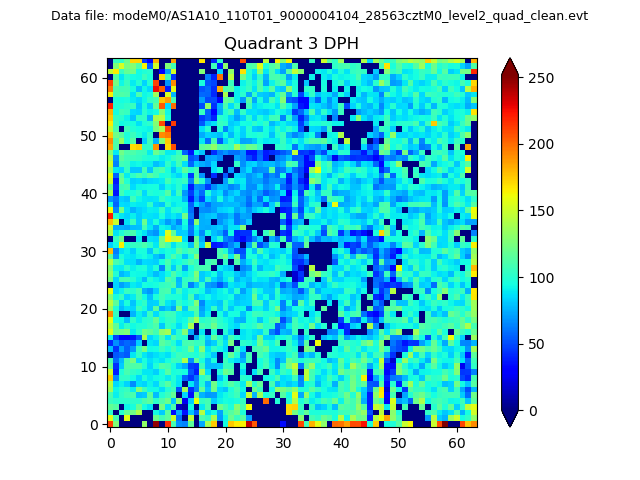 |
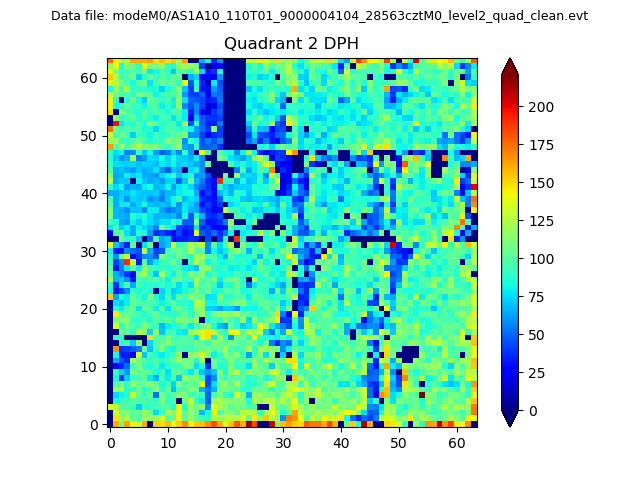 |
Quadrant C |
| Plot type | Count rate plots | Images |
|---|---|---|
| Comparison with Poisson distribution Blue bars denote a histogram of data divided into 1 sec bins. Red curve is a Poisson curve with rate = median count rate of data. |
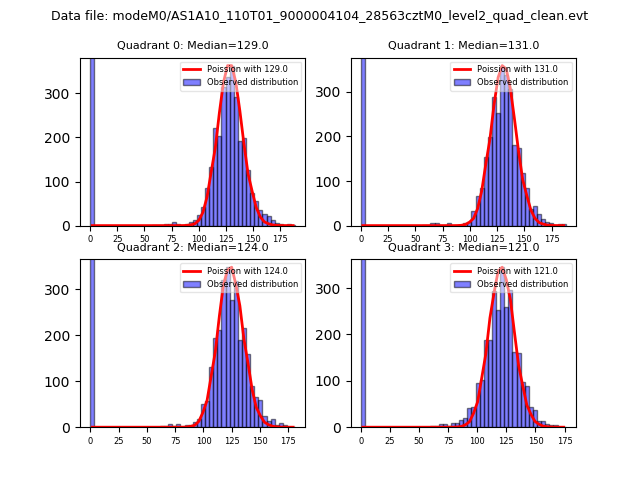 |
 |
| Quadrant-wise count rates Data is divided into 100 sec bins |
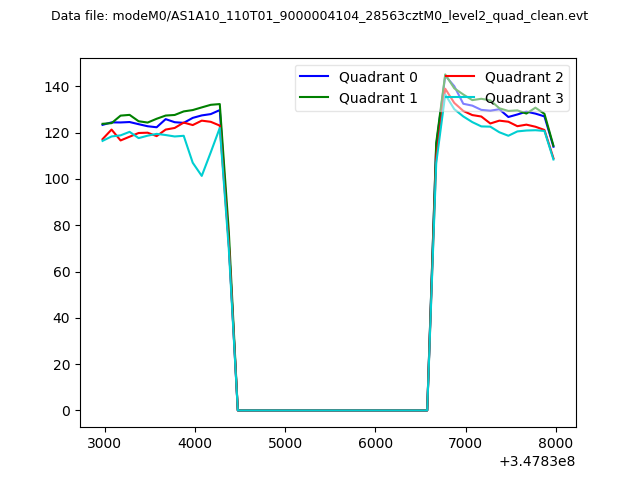 |
|
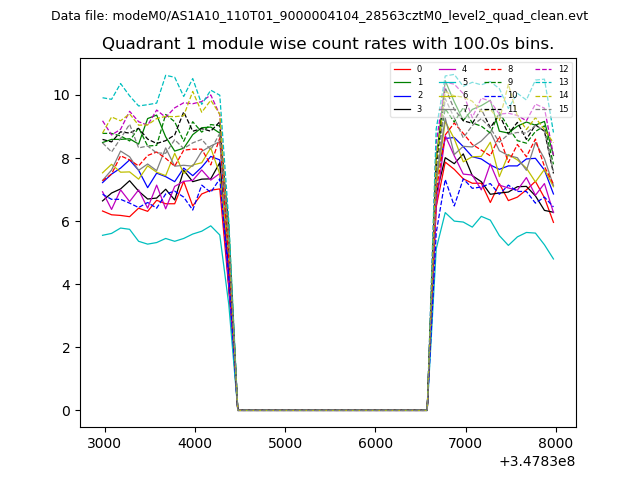
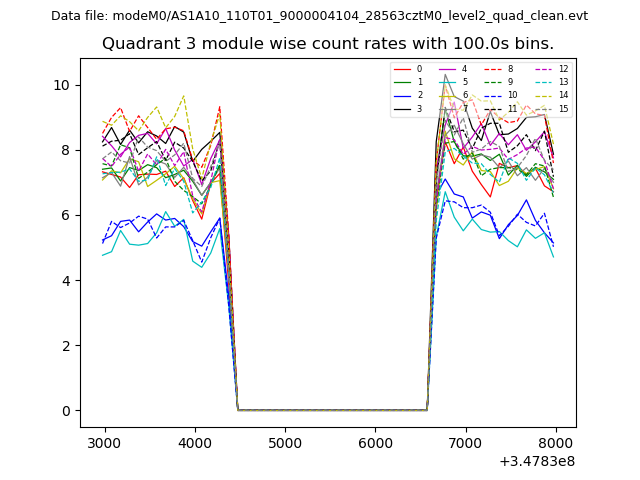
| Module-wise count rates for Quadrant A Data is divided into 100 sec bins |
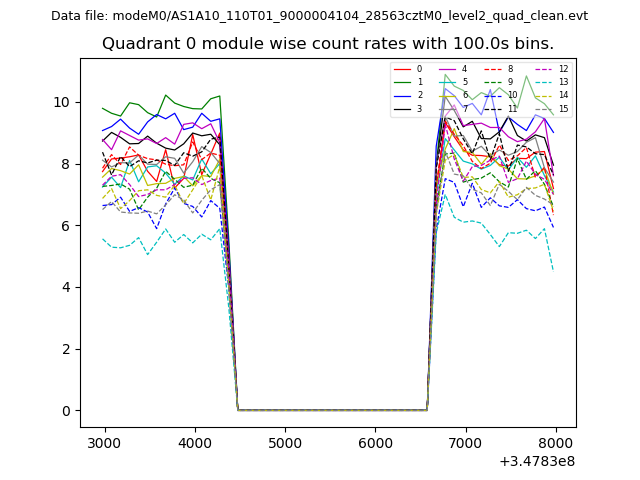 |
 |
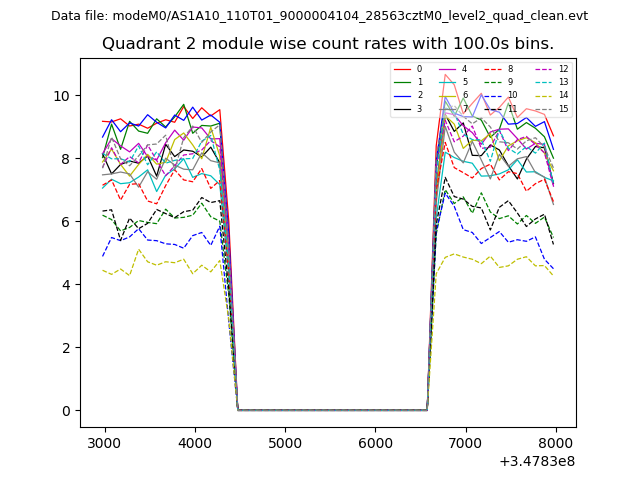
| Module-wise count rates for Quadrant B Data is divided into 100 sec bins |
 |
 |
| Module-wise count rates for Quadrant C Data is divided into 100 sec bins |
 |
 |
| Module-wise count rates for Quadrant D Data is divided into 100 sec bins |
 |
 |
| Parameter | Plot |
|---|---|
| CZT HV Monitor | 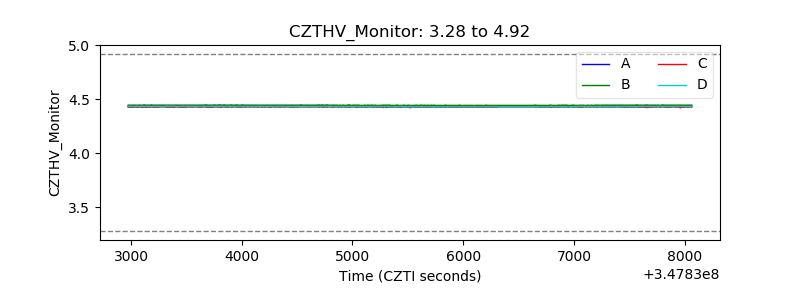 |
| D_VDD | 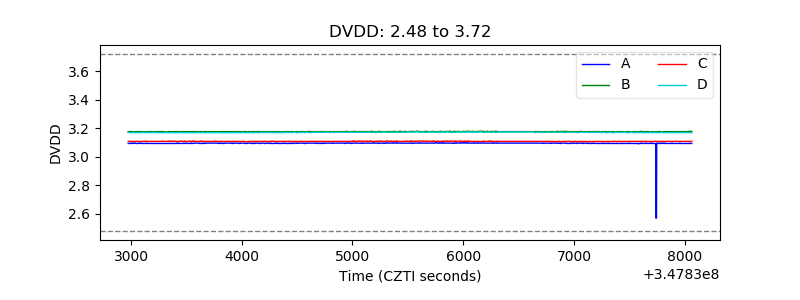 |
| Temperature 1 | 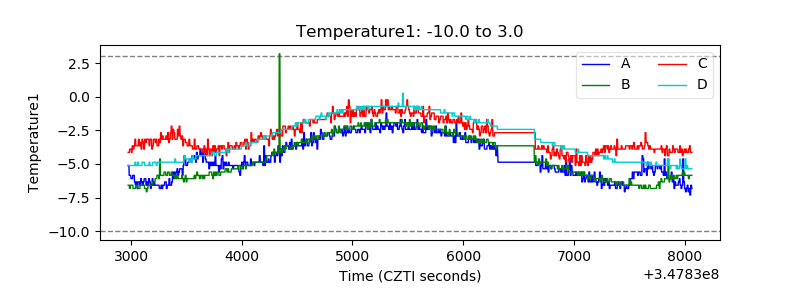 |
| Veto HV Monitor | 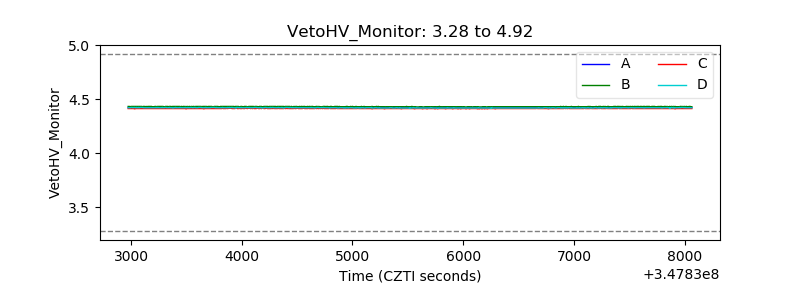 |
| Veto LLD | 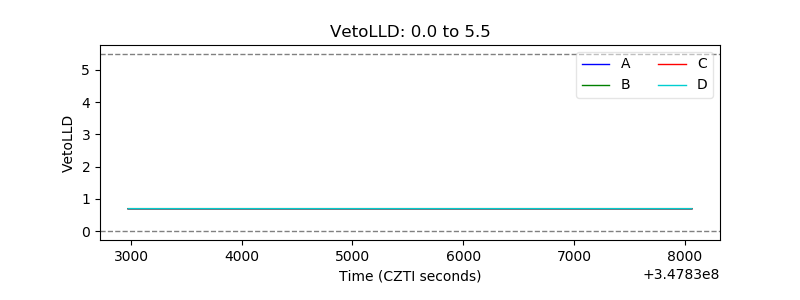 |
| Alpha Counter | 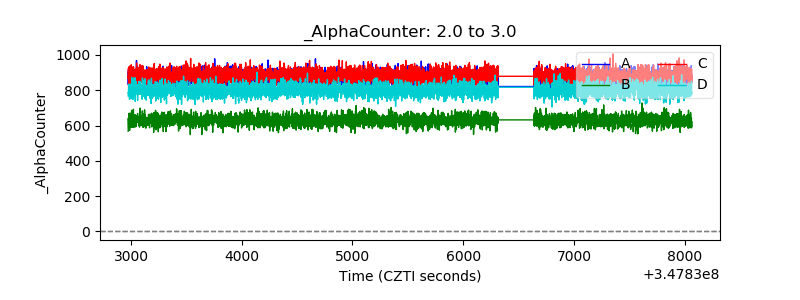 |
| _CPM_Rate | 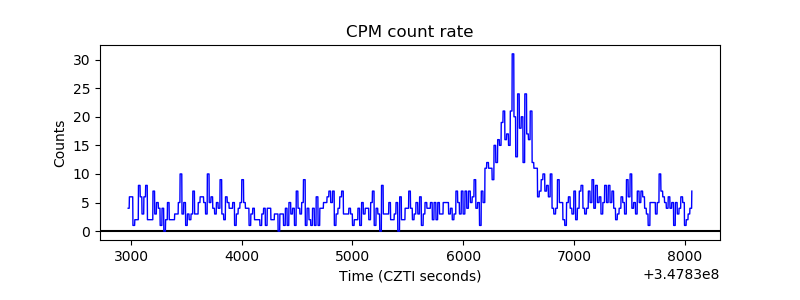 |
| CZT Counter |  |
| +2.5 Volts monitor |  |
| +5 Volts monitor |  |
| _ROLL_ROT | 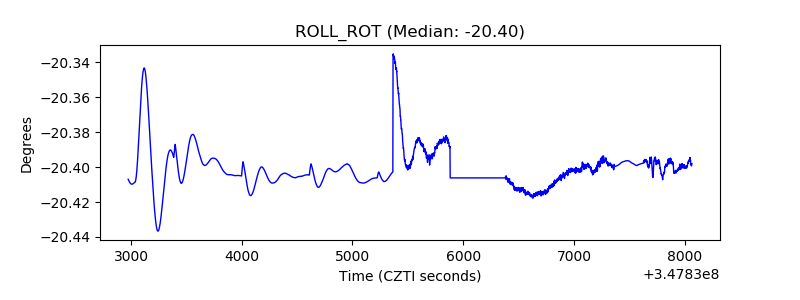 |
| _Roll_DEC | 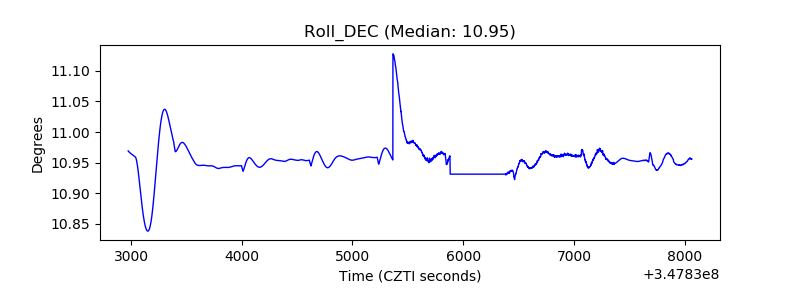 |
| _Roll_RA | 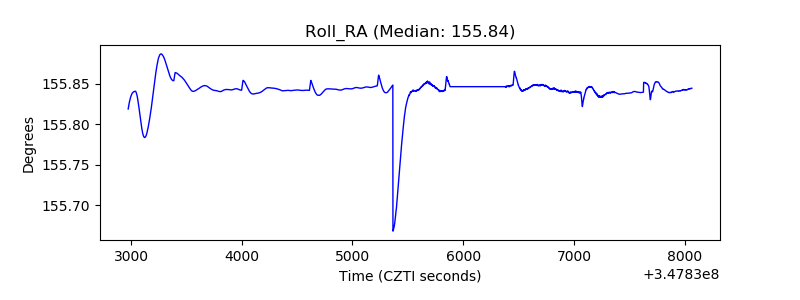 |
| Veto Counter | 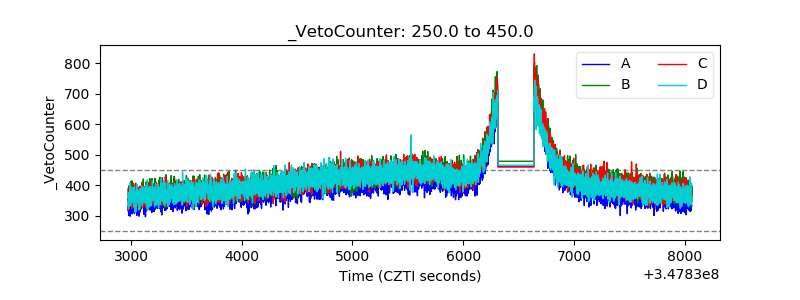 |