| Param | Original file | Final file |
|---|---|---|
| Filename | modeM0/AS1A10_110T01_9000004104_28567cztM0_level2.evt | modeM0/AS1A10_110T01_9000004104_28567cztM0_level2_quad_clean.evt |
| Size (bytes) | 1,796,091,840 | 288,832,320 |
| Size | 1.7 GB | 275.5 MB |
| Events in quadrant A | 12,213,088 | 1,797,718 |
| Events in quadrant B | 12,179,701 | 1,827,759 |
| Events in quadrant C | 12,022,807 | 1,743,756 |
| Events in quadrant D | 16,329,681 | 1,697,547 |
| Mode SS | |||
|---|---|---|---|
| Quadrant | BADHDUFLAG | Total packets | Discarded packets |
| A | 0 | 498 | 0 |
| B | 0 | 498 | 0 |
| C | 0 | 498 | 0 |
| D | 0 | 498 | 0 |
| Mode M0 | |||
|---|---|---|---|
| Quadrant | BADHDUFLAG | Total packets | Discarded packets |
| A | 0 | 52371 | 5 |
| B | 0 | 51868 | 5 |
| C | 0 | 51324 | 5 |
| D | 0 | 65236 | 5 |
| Mode M9 | |||
|---|---|---|---|
| Quadrant | BADHDUFLAG | Total packets | Discarded packets |
| A | 0 | 24 | 0 |
| B | 0 | 24 | 0 |
| C | 0 | 24 | 0 |
| D | 0 | 24 | 0 |
| Quadrant | Total seconds | Saturated seconds | Saturation percentage |
|---|---|---|---|
| A | 24436 | 364 | 1.489606% |
| B | 24437 | 372 | 1.522282% |
| C | 24437 | 402 | 1.645046% |
| D | 24437 | 807 | 3.302369% |
Noise dominated data is calculated using 1-second bins in cleaned event files. If a bin has >2000 counts, and if more than 50% of those come from <1% of pixels, then it is considered to be noise-dominated and hence unusable.
| Quadrant | # 1 sec bins | Bins with >0 counts | Bins with >2000 counts | High rate bins dominated by noise | Noise dominated (total time) | Noise dominated (detector-on time) | Marked lightcurve |
|---|---|---|---|---|---|---|---|
| A | 26781 | 24437 | 25 | 25 | 0.09% | 0.10% | 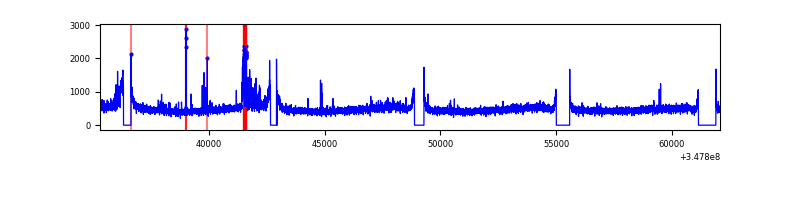 |
| B | 26782 | 24437 | 20 | 20 | 0.07% | 0.08% | 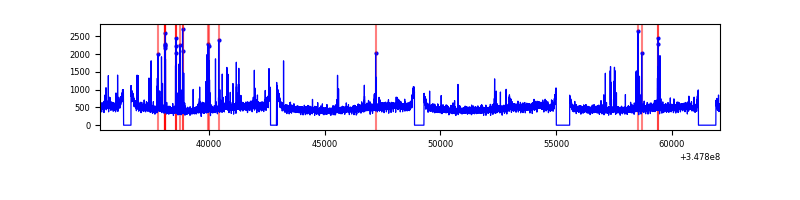 |
| C | 26782 | 24440 | 14 | 14 | 0.05% | 0.06% | 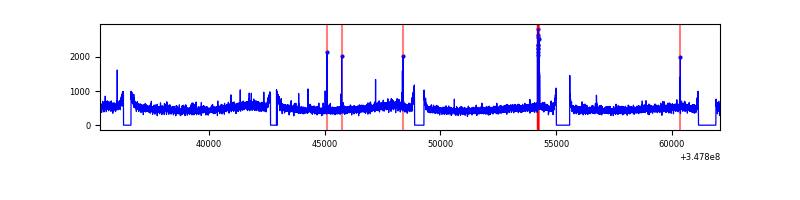 |
| D | 26782 | 24440 | 762 | 762 | 2.85% | 3.12% | 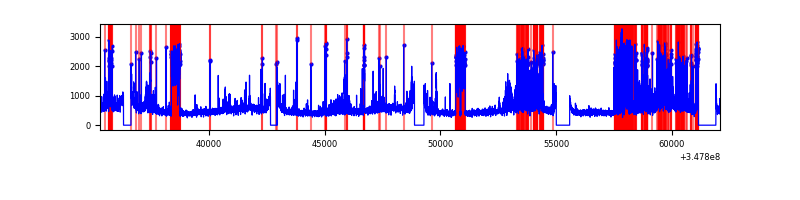 |
Top three noisy pixels from each quadrant. If the there are fewer than three noisy pixels in the level2.evt file, extra rows are filled as -1
| Pixel properties | Quadrant properties | ||||||
|---|---|---|---|---|---|---|---|
| Quadrant | DetID | PixID | Counts | Sigma | Mean | Median | Sigma |
| A | 15 | 174 | 453111 | 743.06 | 3013 | 2947 | 605.8 |
| A | 14 | 238 | 99476 | 159.34 | 3013 | 2947 | 605.8 |
| A | 13 | 254 | 35206 | 53.25 | 3013 | 2947 | 605.8 |
| B | 4 | 171 | 266547 | 457.08 | 2985 | 2904 | 576.8 |
| B | 12 | 111 | 74235 | 123.67 | 2985 | 2904 | 576.8 |
| B | 10 | 245 | 72642 | 120.9 | 2985 | 2904 | 576.8 |
| C | 14 | 238 | 459960 | 672.79 | 2880 | 2895 | 679.4 |
| C | 7 | 247 | 260393 | 379.03 | 2880 | 2895 | 679.4 |
| C | 10 | 22 | 42541 | 58.36 | 2880 | 2895 | 679.4 |
| D | 1 | 52 | 2270026 | 3287.86 | 2884 | 2809 | 689.6 |
| D | 8 | 195 | 1881302 | 2724.14 | 2884 | 2809 | 689.6 |
| D | 2 | 250 | 1031591 | 1491.91 | 2884 | 2809 | 689.6 |
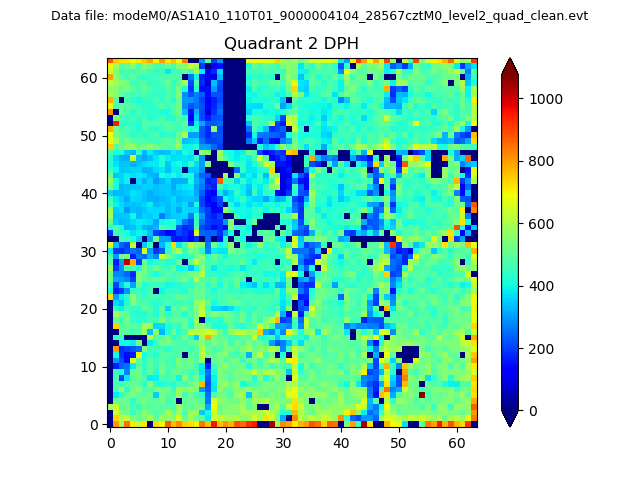
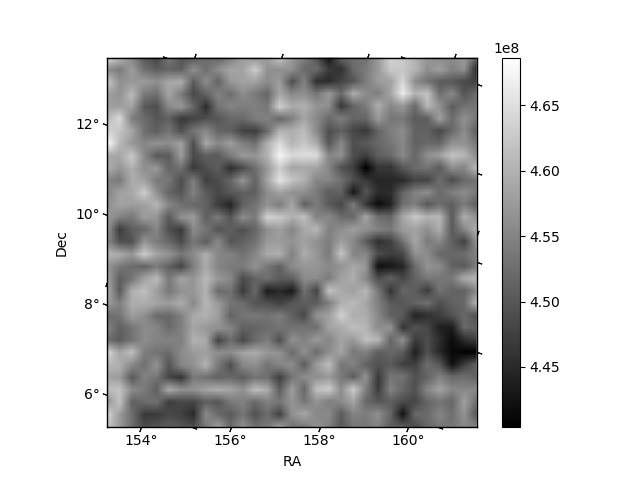
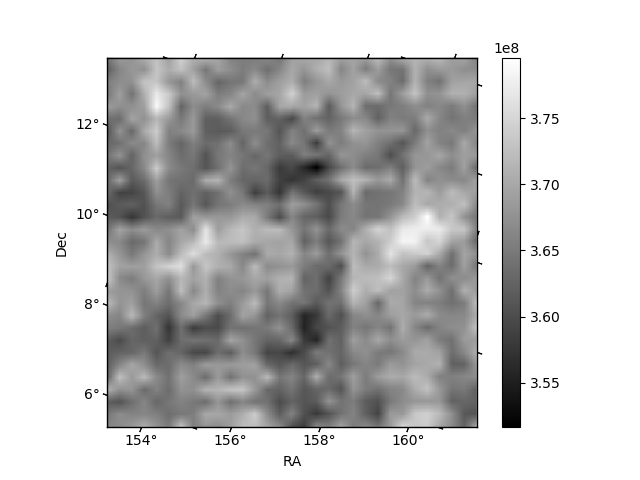
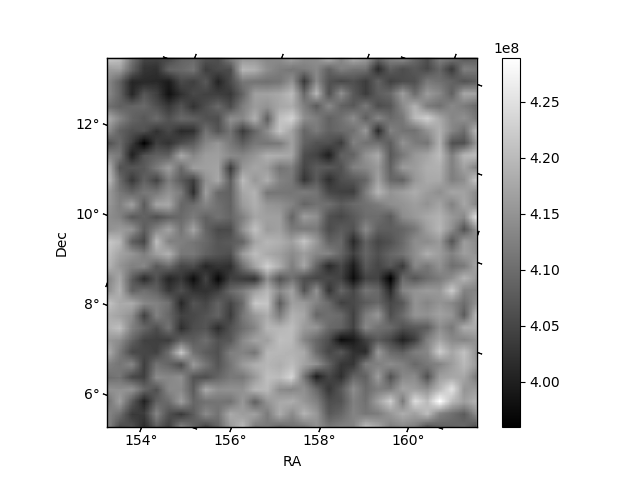
Histogram calculated using DETX and DETY for each event in the final _common_clean file
| Quadrant A | 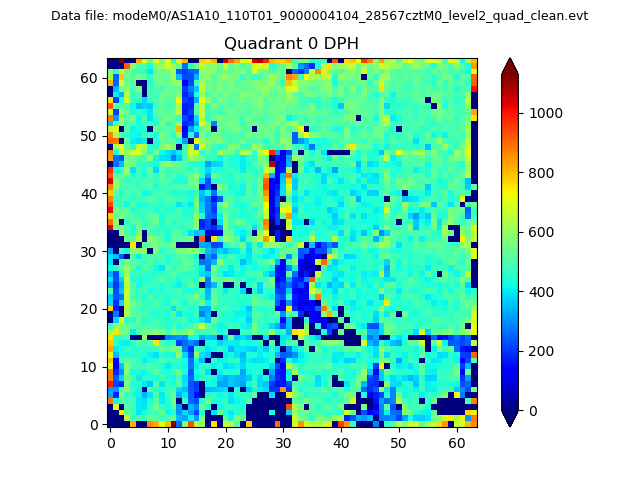 |
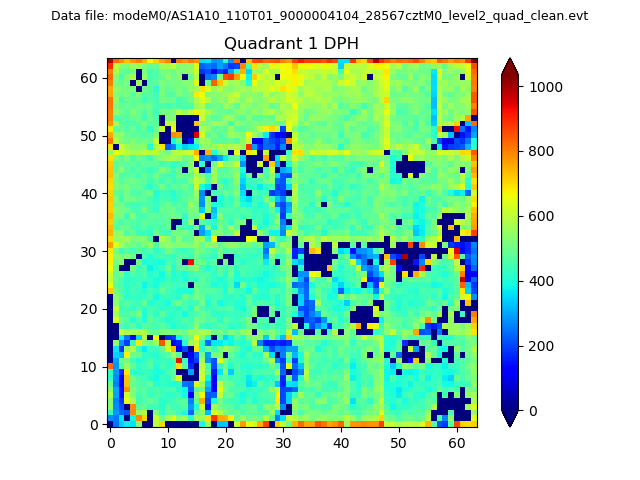 |
Quadrant B |
|---|---|---|---|
| Quadrant D | 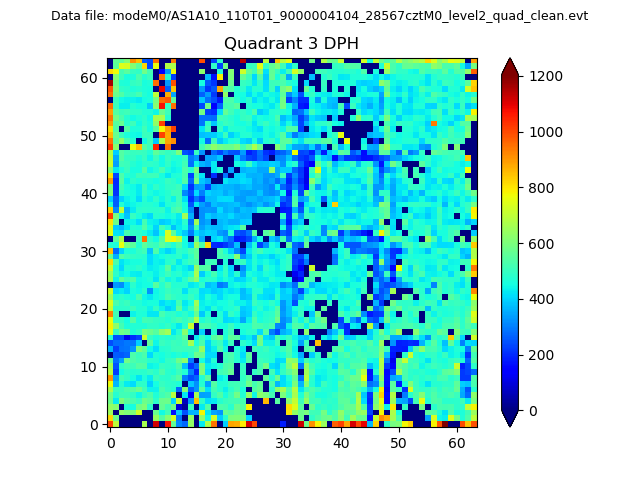 |
 |
Quadrant C |
| Plot type | Count rate plots | Images |
|---|---|---|
| Comparison with Poisson distribution Blue bars denote a histogram of data divided into 1 sec bins. Red curve is a Poisson curve with rate = median count rate of data. |
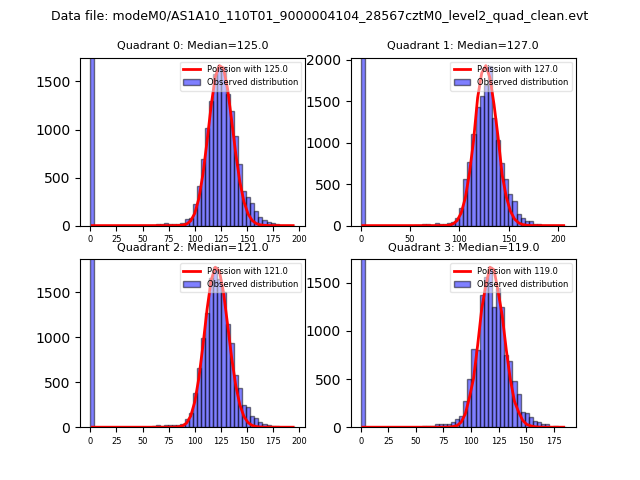 |
 |
| Quadrant-wise count rates Data is divided into 100 sec bins |
 |
|
| Module-wise count rates for Quadrant A Data is divided into 100 sec bins |
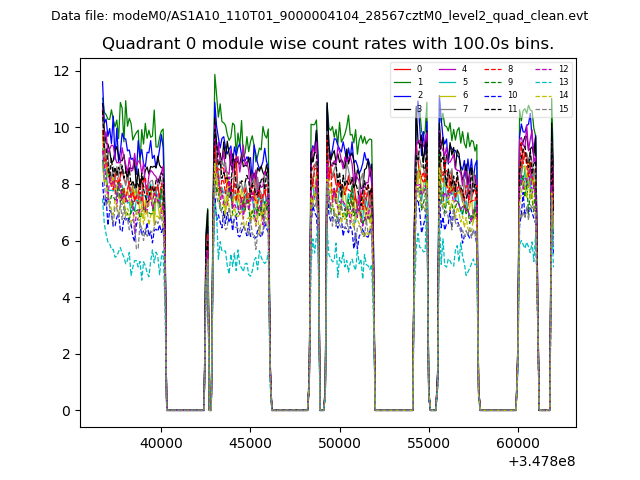 |
 |
| Module-wise count rates for Quadrant B Data is divided into 100 sec bins |
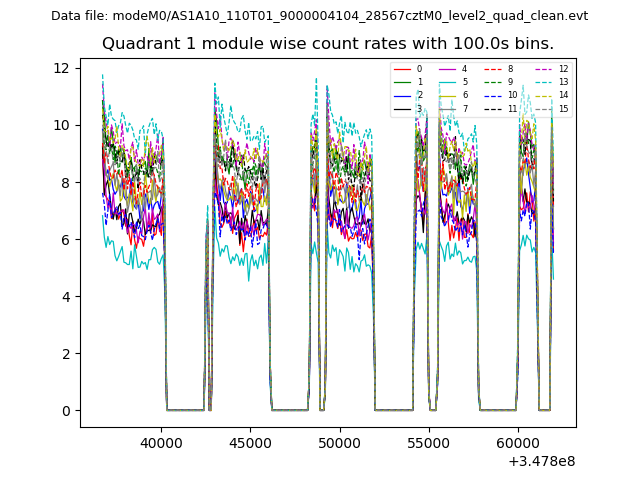 |
 |
| Module-wise count rates for Quadrant C Data is divided into 100 sec bins |
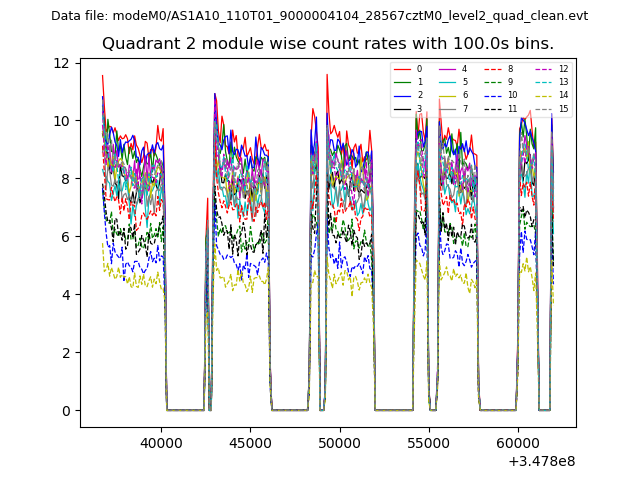 |
 |
| Module-wise count rates for Quadrant D Data is divided into 100 sec bins |
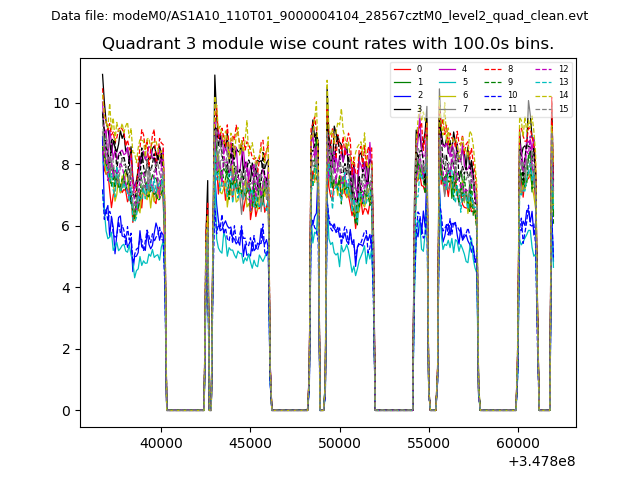 |
 |
| Parameter | Plot |
|---|---|
| CZT HV Monitor | 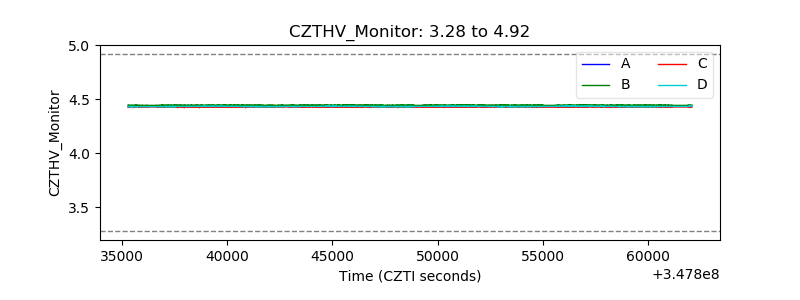 |
| D_VDD | 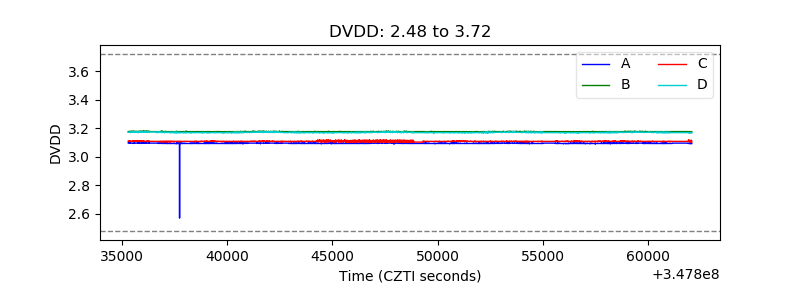 |
| Temperature 1 | 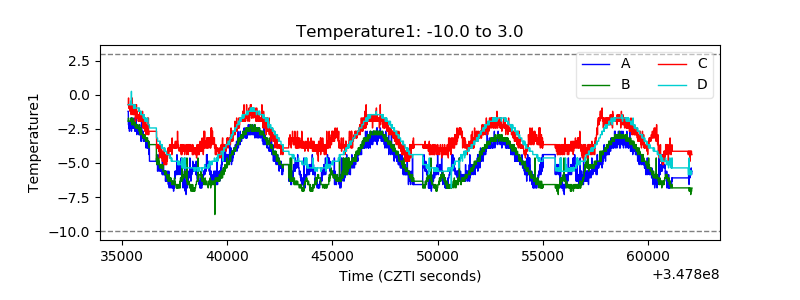 |
| Veto HV Monitor | 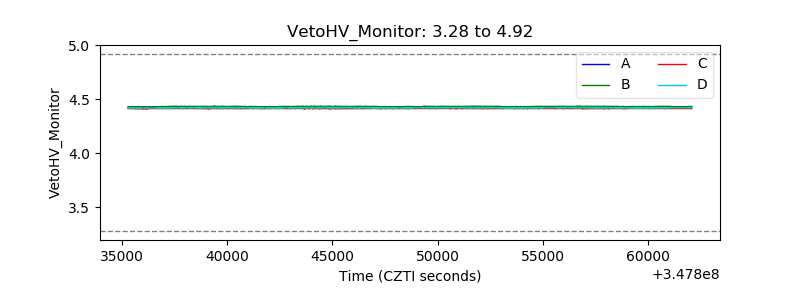 |
| Veto LLD | 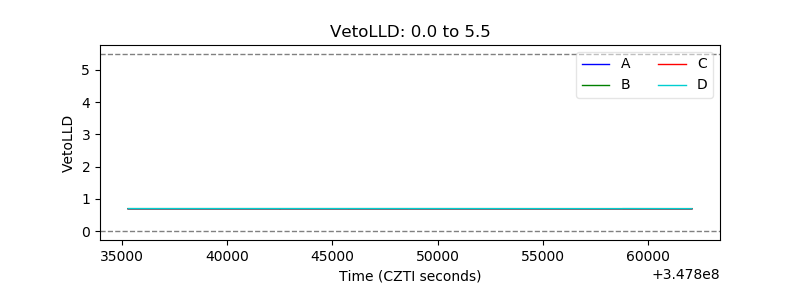 |
| Alpha Counter | 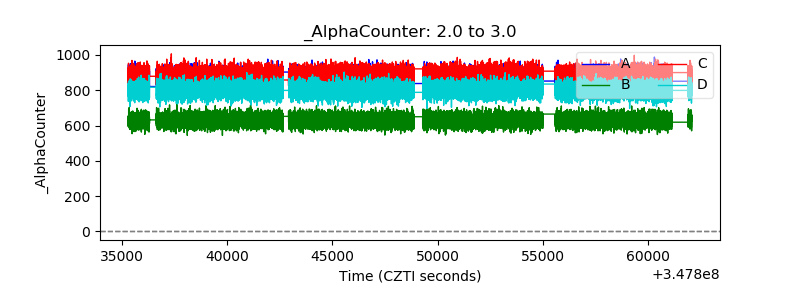 |
| _CPM_Rate | 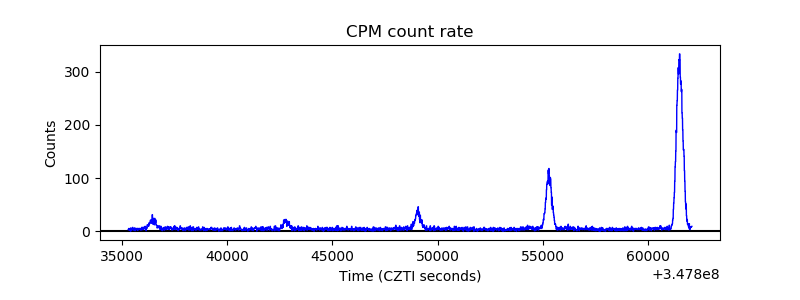 |
| CZT Counter | 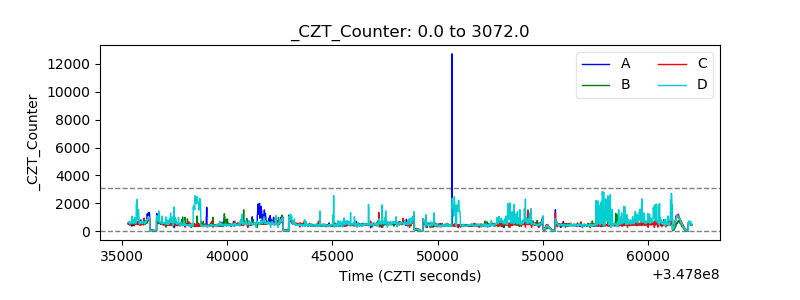 |
| +2.5 Volts monitor |  |
| +5 Volts monitor |  |
| _ROLL_ROT | 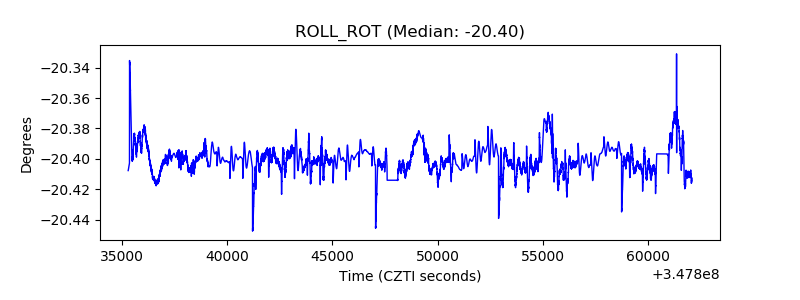 |
| _Roll_DEC | 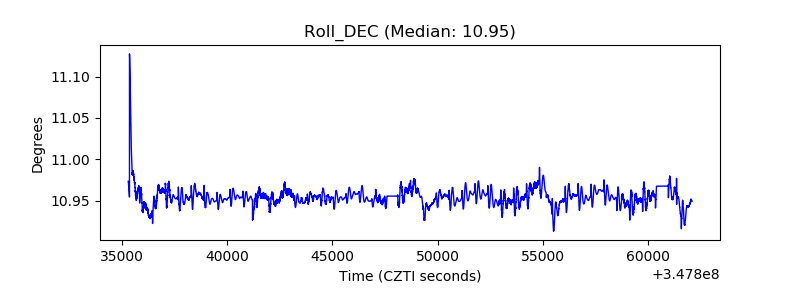 |
| _Roll_RA | 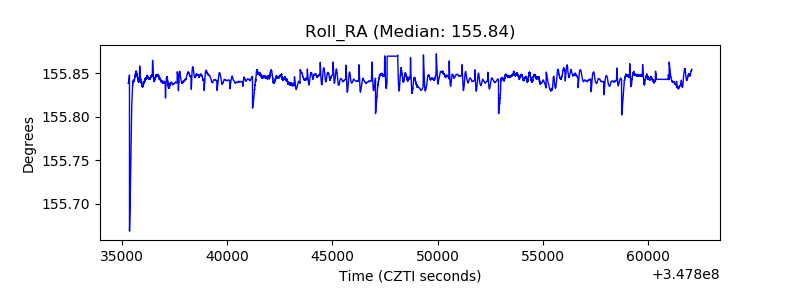 |
| Veto Counter | 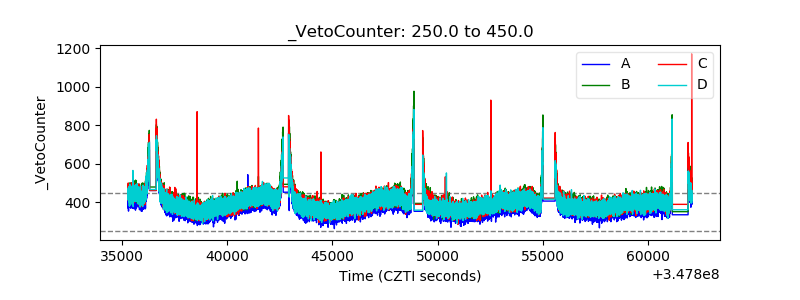 |